phytoplankton
Type of resources
Available actions
Topics
Keywords
Contact for the resource
Provided by
Formats
Representation types
Update frequencies
status
-
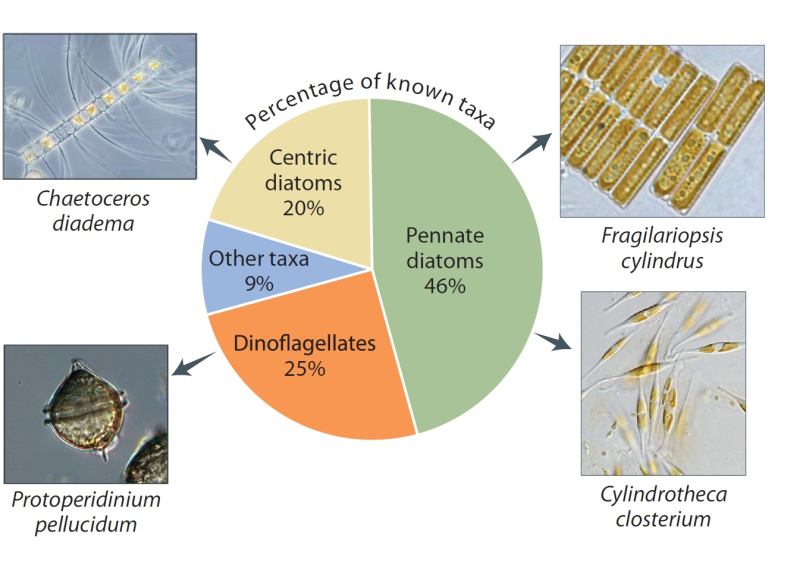
The number of species depends partly on what has been studied. Proportions vary somewhat around the Arctic, but diatoms and dinoflagellates are the most diverse groups everywhere. The greatest sampling effort has been in the Laptev Sea, Hudson Bay, and the Norwegian sector of the Barents Sea. Species shown are among the most commonly recorded. Published in the Life Linked to Ice released in 2013, page 26. Life Linked to Ice: A guide to sea-ice-associated biodiversity in this time of rapid change. CAFF Assessment Series No. 10. Conservation of Arctic Flora and Fauna, Iceland. ISBN: 978-9935-431-25-7.
-
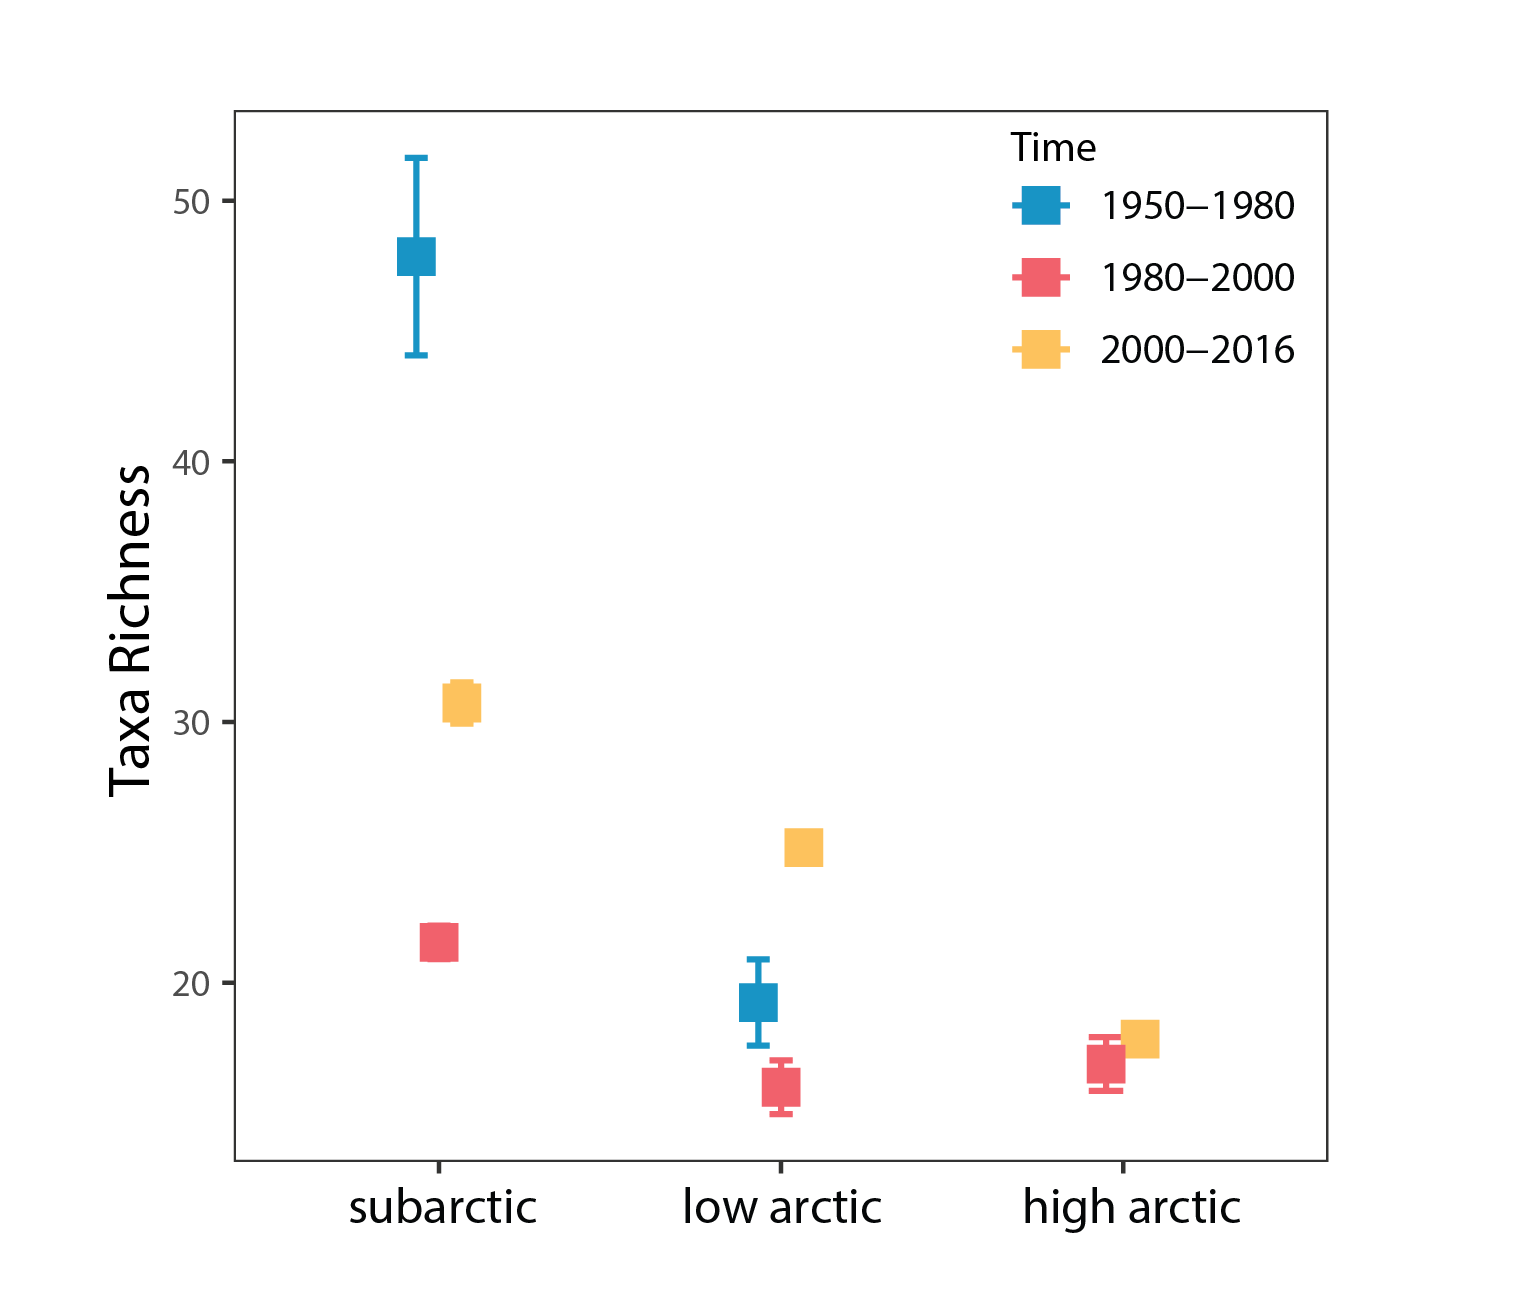
Phytoplankton species richness averaged by time periods ±SE in each Arctic region. State of the Arctic Freshwater Biodiversity Report - Chapter 4 - Page 49 - Figure 4-20
-
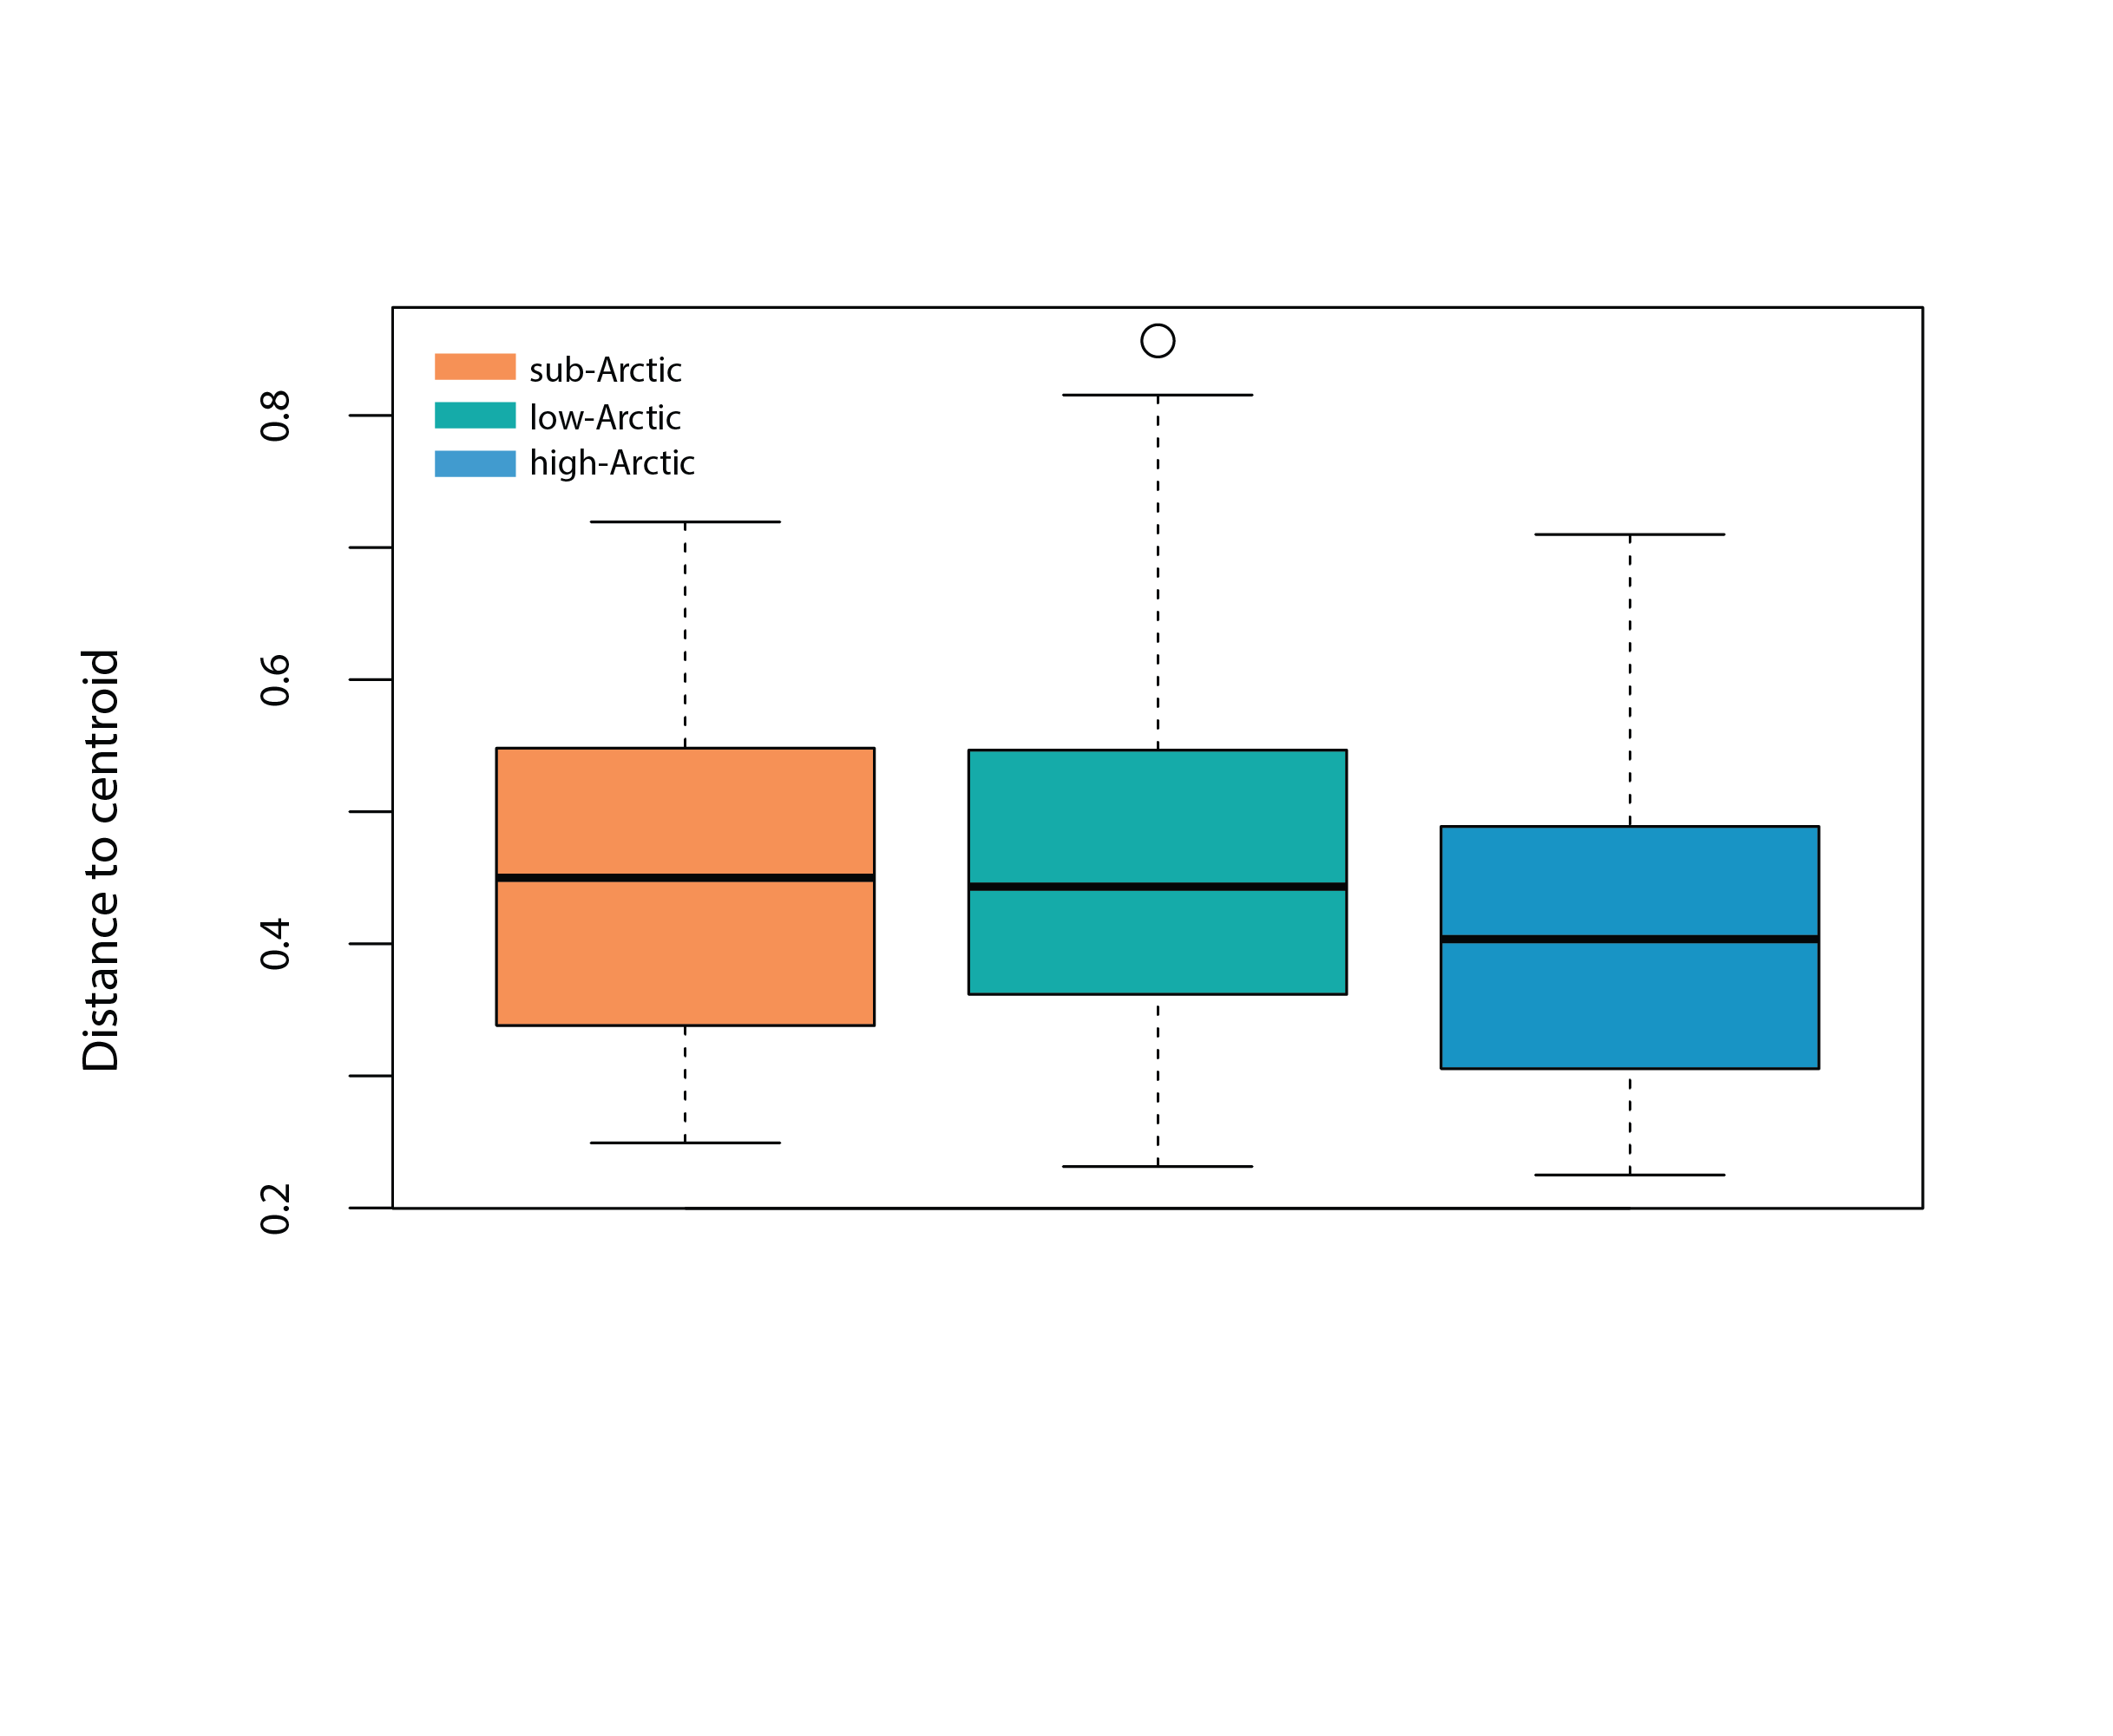
Box plot represents the homogeneity of assemblages in high Arctic (n=190), low Arctic (n=370) and sub-Arctic lakes (n=1151), i.e., the distance of individual lake phytoplankton assemblages to the group centroid in multivariate space. The mean distance to the centroid for each of the regions can be seen as an estimated of beta diversity, with increasing distance equating to greater differences among assemblages. State of the Arctic Freshwater Biodiversity Report - Chapter 4 - Page 48 - Figure 4-18
-
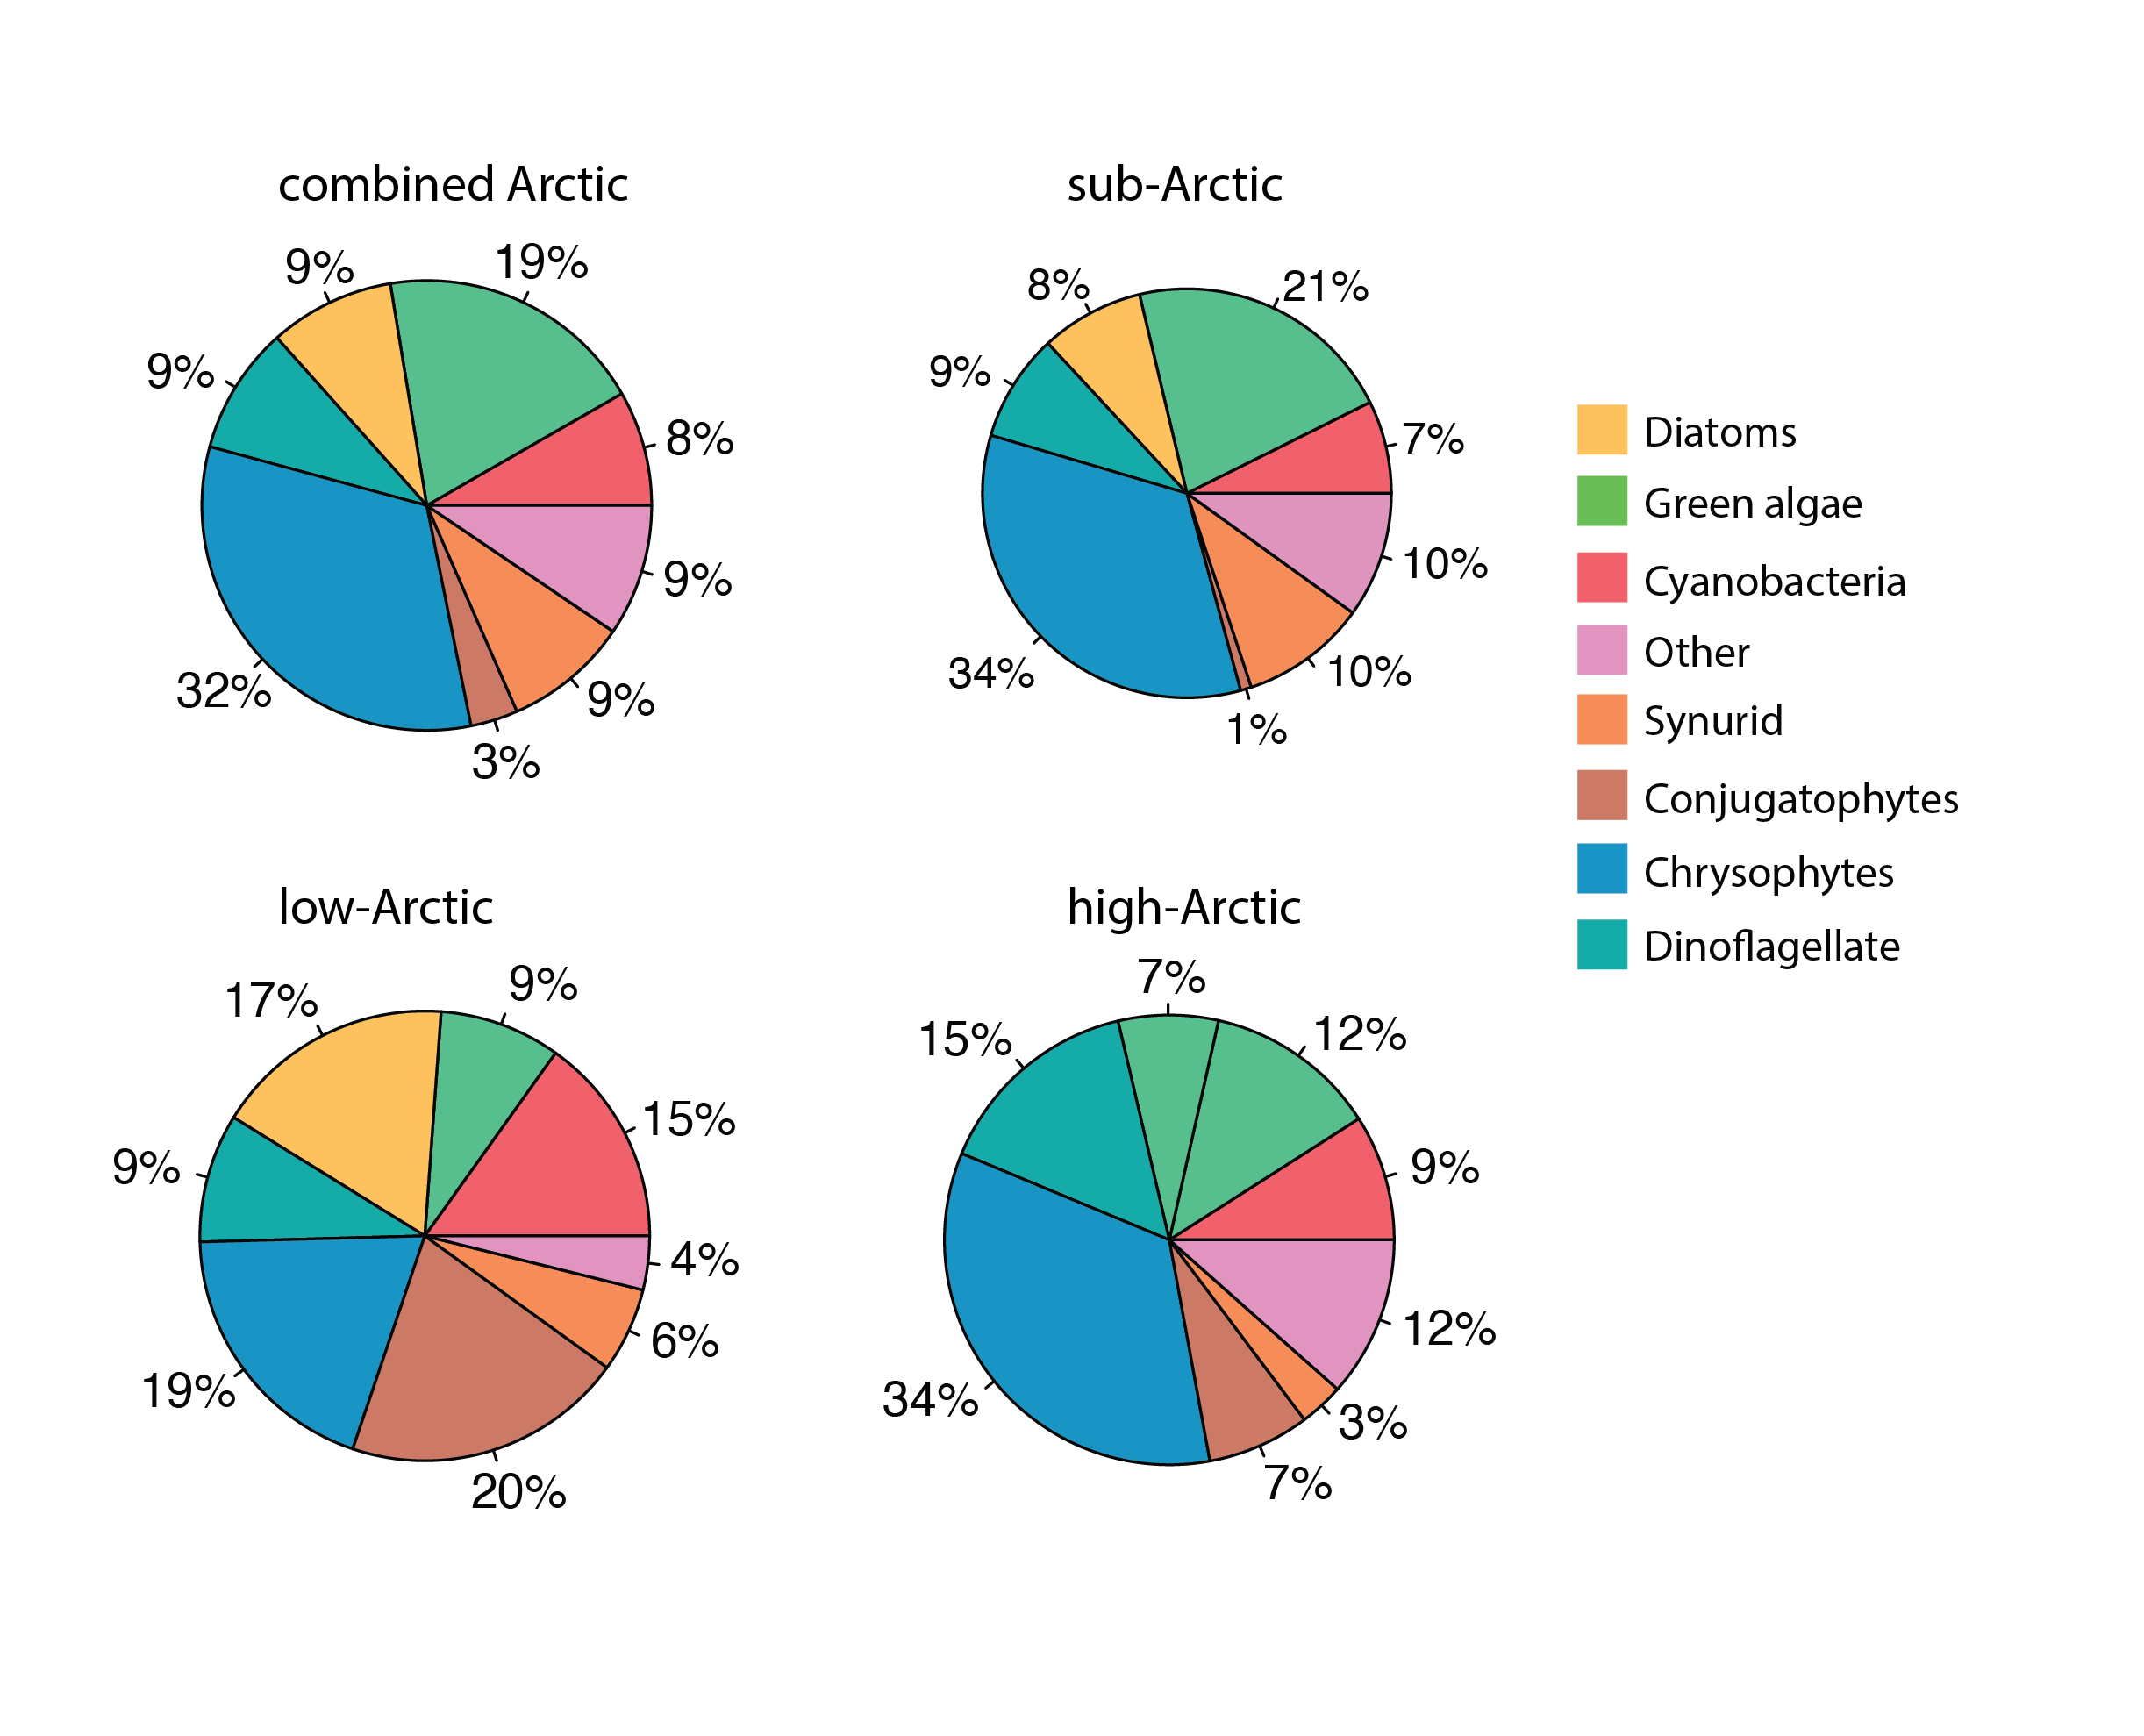
Phytoplankton percent composition by dominant classes across the three Arctic regions, using relative presence across stations calculated from from presence – absence data. State of the Arctic Freshwater Biodiversity Report - Chapter 4 - Page 48 - Figure 4-19
-

This layer represents areas where primary production is considered to be high. Primary production includes microscopic algal blooms, named phytoplankton, a food resource at the base of the food web of marine ecosystems. The knowledge of these zones can serve as a proxy to identify areas of the St. Lawrence where productivity is higher at different times of the year. Impacting his component may influence the rest of the life cycle in the affected area. Data were generated from the Gulf of St. Lawrence Biogeochemical Model (GSBM) developed by Dr. Diane Lavoie. This model makes it possible to calculate, using 10 variables, the primary production in each cell of the grid of the model. This calculation was done at a monthly resolution and a threshold was then applied to the data to keep only those cells where the estimated concentrations exceeded 20 mg C / m-2. This level of primary production is considered high. Additional Information Monthly mean primary production (mg C m-2) in the first 50 meters of the simulated surface with the three-dimensional CANOPA-GSBM numerical model over a period of 13 years (1998-2010). The Gulf of St. Lawrence Biogeochemical Model (GSBM) simulates biogeochemical cycles of oxygen, carbon and nitrogen, and the biological components that determine the dynamics of the planktonic ecosystem. The model has 10 state variables. The NPZD (nutrients, primary production, zooplankton, detritus) model includes both simplified herbivorous and microbial food chains typical of bloom and post-bloom conditions. The export of biogenic matter at depth is mediated by the herbivorous food web (nitrate, large phytoplankton (diatoms), mesozooplankton, particulate organic matter), while the microbial food web (ammonium, small phytoplankton, microzooplankton, dissolved organic matter) is mainly responsible for nutrient recycling in the euphotic zone. Nitrate is also supplied by rivers. The tight coupling between small phytoplankton growth and microzooplankton grazing, autochtonous nitrogen release and (dissolved organic nitrogen) DON remineralization to ammonium (NH4+) is used to represent the dynamic of the microbial food chain. Biological transfer functions are derived from bulk formulations using mean parameters found in the literature. Biological variables are calculated in nitrogen units and algal biomass and production converted to Chl a and carbon units using fixed stoichiometric ratios. Detrital particulate organic nitrogen (PON) gets fragmented to dissolved organic nitrogen (DON) as it sinks toward the bottom. The phytoplankton growth rate is a function of light and nutrient availability. The available light for phytoplankton growth is a function of sea-ice cover, Chl a and colored dissolved organic matter (CDOM). The GSBM biogeochemical model, coupled with the CANOPA regional circulation model, was used to produce the Chl a layer. The grid of the model is 1/12° horizontally (about 6 x 8 km), 46 layers vertical and covers the Gulf of St. Lawrence, Scotian Shelf and Gulf of Maine regions. The vertical resolution is variable (between 6 m close to the surface to 90 m at depths of about 500 m). This model includes tidal forcing and the freshwater supply of the St. Lawrence River and the many rivers in the region, as well as atmospheric forcing (temperature, wind, etc.) produced by an independent model (National Center for Environmental Prediction (NCEP) Climate Forecast System Version 2). In addition, the circulation model is coupled with a model of sea ice that reproduces the seasonality of the ice cover in the region. The temperature and salinity fields are produced freely by the model and only constrained by monthly climatologies of these conditions at the boundaries of the model domain. The simulation was carried out over a part of the period covering the Zonal Monitoring Program (AZMP) from 1998 to 2010.
-
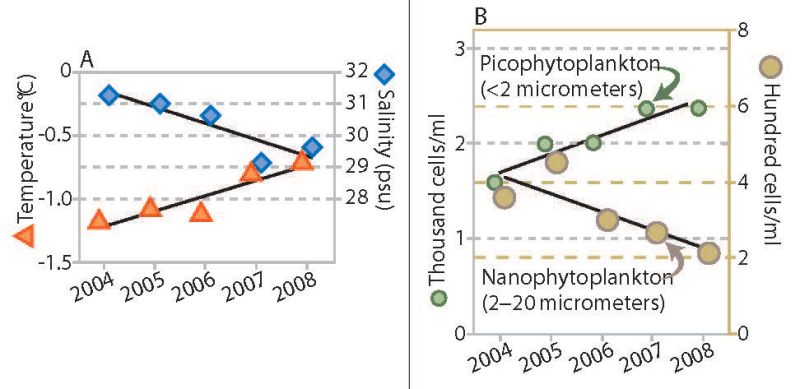
Trends in water temperature and salinity (A) and density of phytoplankton of two size ranges (B), Canada Basin, 2004 to 2008. Stratification of the water column increased throughout the Canada Basin over a recent five-year period, accompanied by a change in phytoplankton communities. The upper ocean layer showed trends of increased temperature and decreased salinity (Figure 18A), which combine to make this layer progressively less dense. The layer of water below this did not change in density over this period (not shown). The larger size class of phytoplankton (which would include diatoms) decreased in abundance, while the smaller types of plankton increased (Figure 18B). In addition to the trends shown, nutrient content in the upper ocean water layer decreased. Abundance of microbes (bacteria and similar organisms) that subsist on organic matter increased. Total phytoplankton biomass, however, remained unchanged. If this trend towards smaller species of phytoplankton and microbes is sustained, it may lead to reduced production of zooplankton, an impact that would be transmitted through the food web to birds, fish and mammals. Published in the Life Linked to Ice released in 2013, page 30. Life Linked to Ice: A guide to sea-ice-associated biodiversity in this time of rapid change. CAFF Assessment Series No. 10. Conservation of Arctic Flora and Fauna, Iceland. ISBN: 978-9935-431-25-7.
-
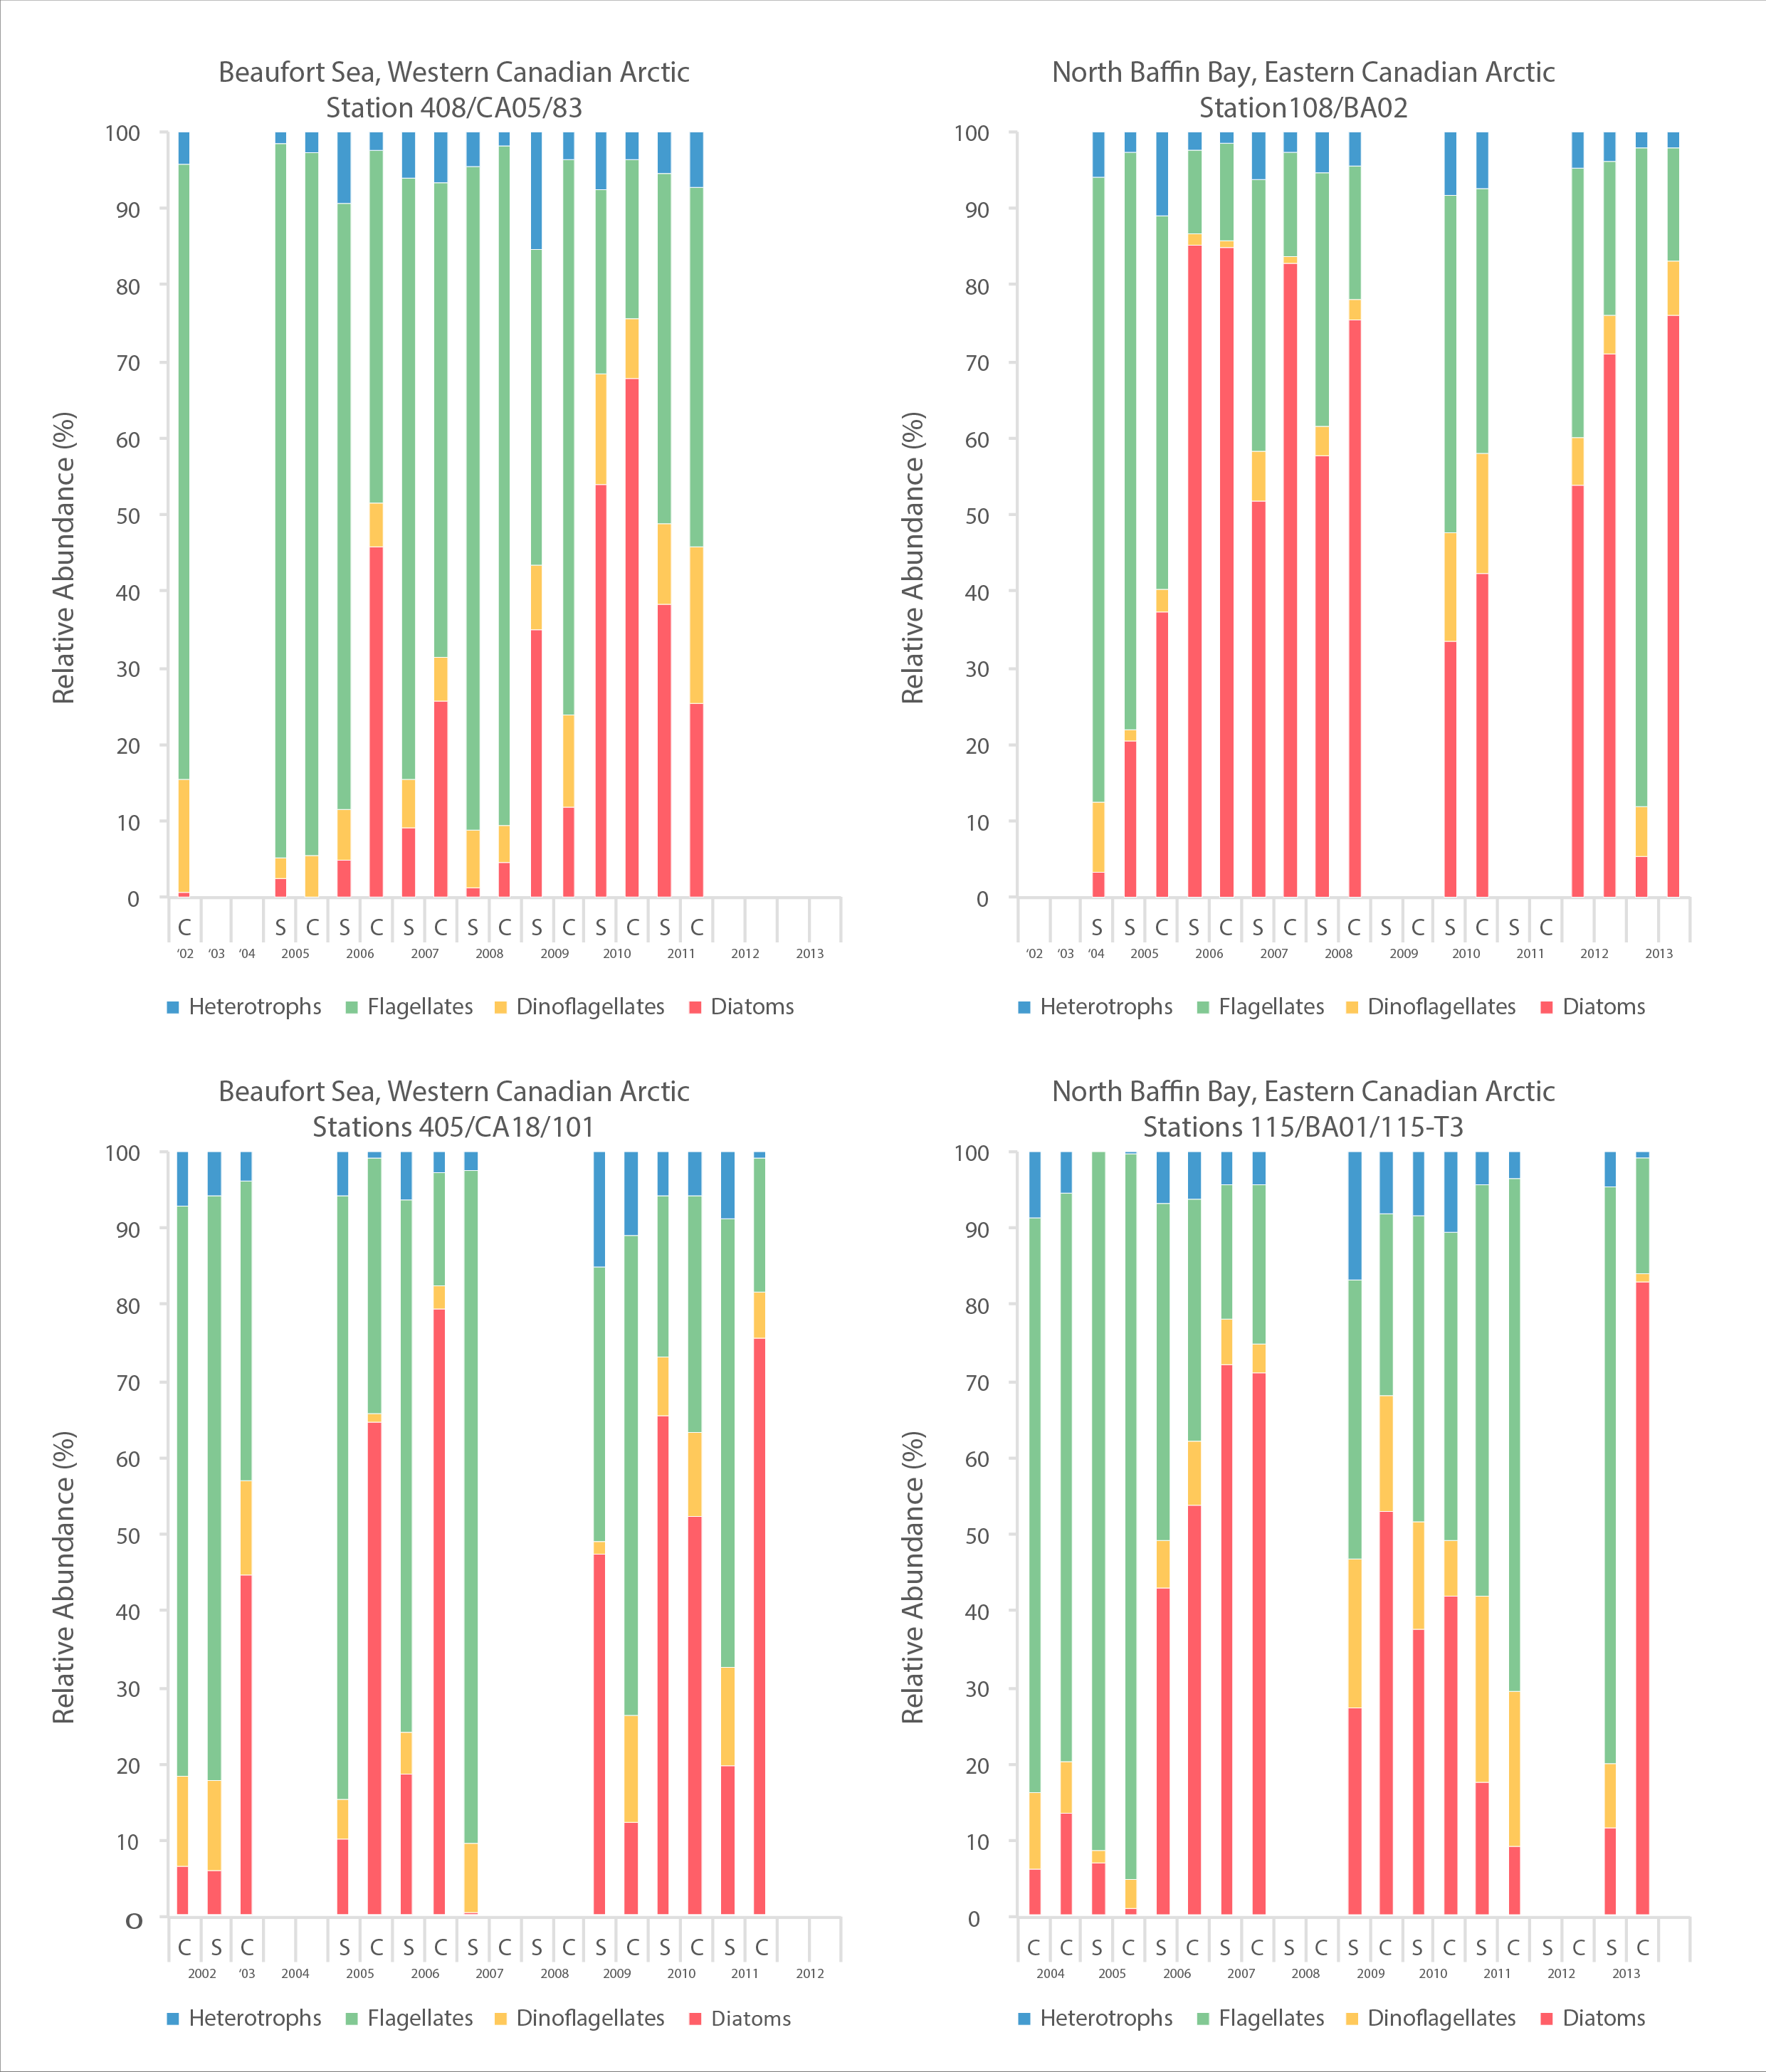
A time series of cell abundances, as determined by microscopy, of major phytoplankton groups from 2002-2013 for four sites, two in an east-west transect in Amundsen Gulf, Beaufort Sea and two in an east-west transect in northern Baffin Bay. STATE OF THE ARCTIC MARINE BIODIVERSITY REPORT - <a href="https://arcticbiodiversity.is/findings/plankton" target="_blank">Chapter 3</a> - Page 73 - Figure 3.2.4 A time series of cell abundances, as determined by microscopy, of major phytoplankton groups from 2002-2013 for four sites, 2 in the Beaufort Sea and 2 in northern Baffin Bay. Cell abundances are given as cells per liter. On most sampling dates, there is data from surface water and from the subsurface chlorophyll maximum (Cmax in the spreadsheet). Some additional information is included in the column headings, such as the percent of light at the sample depth; however, this should not be included in the figure. You may or may not want to include a map element in this figure, and rough coordinates of the sampling sites are included. The second sheet of the excel file presents the same data but at a finer scale of taxonomic resolution. It is the first sheet that should be used.
-

This data set includes information on sampling locations, water chemistry and chlorophyll collected at 18 locations in the Great Lakes-St. Lawrence River and 4 locations in Lake Simcoe.
-

The Lake Simcoe lake monitoring program provides measurements of chemical and physical water quality limits such as total phosphorus, nitrogen, chlorophyll a, pH, alkalinity, conductivity, dissolved organic and inorganic carbon, silica, other ions, water transparency, temperature and dissolved oxygen. Samples are collected biweekly during the spring, summer and fall. *[pH]: potential of hydrogen
 Arctic SDI catalogue