 Arctic SDI catalogue
salinity
Type of resources
Available actions
Topics
Keywords
Contact for the resource
Provided by
Years
Formats
Representation types
Update frequencies
status
-
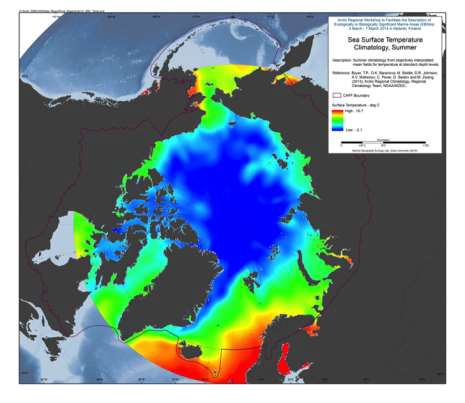
A set of mean fields for temperature and salinity for the Arctic Seas and environs are available for viewing and downloading. Area: The area encompassed is all longitudes from 60°N to 90°N latitudes. Horizontal resolution: Temperature and salinity are available on a 1°x1° and a 1/4°x1/4° latitude/longitude grid. Time resolution: All climatologies for all variables use all available data regardless of year of measurement. Climatologies were calculated for annual (all-data), seasonal, and monthly time periods. Seasons are as follows: Winter (Jan.-Mar.), Spring (Apr.-Jun.), Summer (Jul.-Aug.), Fall (Oct.-Dec.). Vertical resolution: Temperature and salinity are available on 87 standard levels with higher vertical resolution than the World Ocean Atlas 2009 (WOA09), but levels extend from the surface to 4000 m. Units: Temperature units are °C. Salinity is unitless on the Practical Salinity Scale-1978 [PSS]. Data used: All data from the area found in the World Ocean Database (WOD) as of the end of 2011. For a description of this dataset, please see World Ocean Database 2009 Introduction Method: The method followed for calculation of the mean climatological fields is detailed in the following publications: Temperature: Locarnini et al., 2010, Salinity: Antonov et al., 2010. Additional details on the 1/4° climatological calculation are found in Boyer et al., 2005, from: <a href="http://www.nodc.noaa.gov/OC5/regional_climate/arctic/" target="_blank">NOAA</a> Reference: Boyer, T.P., O.K. Baranova, M. Biddle, D.R. Johnson, A.V. Mishonov, C. Paver, D. Seidov and M. Zweng (2012), Arctic Regional Climatology, Regional Climatology Team, NOAA/NODC, source: <a href="www.nodc.noaa.gov/OC5/regional_climate/arctic" target="_blank">NOAA</a>
-
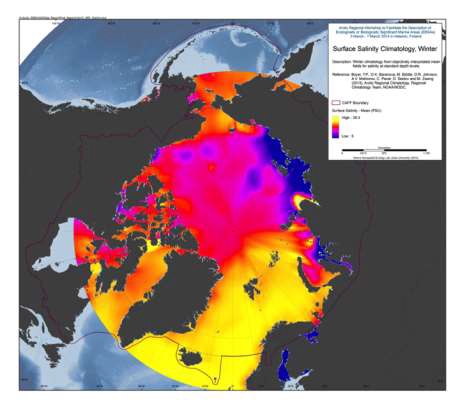
A set of mean fields for temperature and salinity for the Arctic Seas and environs are available for viewing and downloading. Area: The area encompassed is all longitudes from 60°N to 90°N latitudes. Horizontal resolution: Temperature and salinity are available on a 1°x1° and a 1/4°x1/4° latitude/longitude grid. Time resolution: All climatologies for all variables use all available data regardless of year of measurement. Climatologies were calculated for annual (all-data), seasonal, and monthly time periods. Seasons are as follows: Winter (Jan.-Mar.), Spring (Apr.-Jun.), Summer (Jul.-Aug.), Fall (Oct.-Dec.). Vertical resolution: Temperature and salinity are available on 87 standard levels with higher vertical resolution than the World Ocean Atlas 2009 (WOA09), but levels extend from the surface to 4000 m. Units: Temperature units are °C. Salinity is unitless on the Practical Salinity Scale-1978 [PSS]. Data used: All data from the area found in the World Ocean Database (WOD) as of the end of 2011. For a description of this dataset, please see World Ocean Database 2009 IntroductionMethod: The method followed for calculation of the mean climatological fields is detailed in the following publications: Temperature: Locarnini et al., 2010, Salinity: Antonov et al., 2010. Additional details on the 1/4° climatological calculation are found in Boyer et al., 2005, from: <a href="http://www.nodc.noaa.gov/OC5/regional_climate/arctic/" target="_blank">NOAA</a> Reference: Boyer, T.P., O.K. Baranova, M. Biddle, D.R. Johnson, A.V. Mishonov, C. Paver, D. Seidov and M. Zweng (2012), Arctic Regional Climatology, Regional Climatology Team, NOAA/NODC, source: <a href="www.nodc.noaa.gov/OC5/regional_climate/arctic" target="_blank">NOAA</a>
-
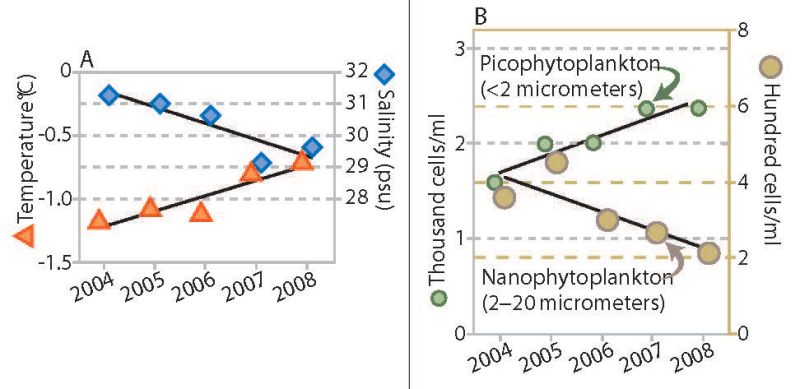
Trends in water temperature and salinity (A) and density of phytoplankton of two size ranges (B), Canada Basin, 2004 to 2008. Stratification of the water column increased throughout the Canada Basin over a recent five-year period, accompanied by a change in phytoplankton communities. The upper ocean layer showed trends of increased temperature and decreased salinity (Figure 18A), which combine to make this layer progressively less dense. The layer of water below this did not change in density over this period (not shown). The larger size class of phytoplankton (which would include diatoms) decreased in abundance, while the smaller types of plankton increased (Figure 18B). In addition to the trends shown, nutrient content in the upper ocean water layer decreased. Abundance of microbes (bacteria and similar organisms) that subsist on organic matter increased. Total phytoplankton biomass, however, remained unchanged. If this trend towards smaller species of phytoplankton and microbes is sustained, it may lead to reduced production of zooplankton, an impact that would be transmitted through the food web to birds, fish and mammals. Published in the Life Linked to Ice released in 2013, page 30. Life Linked to Ice: A guide to sea-ice-associated biodiversity in this time of rapid change. CAFF Assessment Series No. 10. Conservation of Arctic Flora and Fauna, Iceland. ISBN: 978-9935-431-25-7.
-
The Coastal Environmental Baseline Program is a multi-year Fisheries and Oceans Canada initiative designed to work with Indigenous and local communities and other key parties to collect coastal environmental data at six pilot sites across Canada (Port of Vancouver, Port of Prince Rupert, Lower St. Lawrence Estuary, Port of Saint John, Placentia Bay, and Iqaluit). The goal of the Program is to gather local information in these areas in effort to build a better understanding of marine ecological conditions. The Maritimes region has developed a habitat classification program to align with the oceanographic interests and data needs of local communities and stakeholders, with the goal of sharing this information via open data. In 2020, a habitat survey in the lower Musquash Marine Protected Area (MPA) was undertaken to further develop this project, using an Autonomous Underwater Vehicle (AUV) equipped with high-frequency (450 kHz) side scan sonar to build a habitat map of the MPA. This dataset includes mosaicked series of sonar images (raw & position-corrected versions), covering roughly 6 km2 of marine and intertidal areas in the Musquash MPA. Doppler Velocity logs and mission-specific files for each survey are also included, along with detailed methodological documentation. These data were generated from 17 separate survey missions that were completed in August, September and October 2020.
-

Locations of sampling stations for sensor strings deployed as part of the Centre for Marine Applied Research's (CMAR) Coastal Monitoring Program. Sensor strings record high-resolution temperature, dissolved oxygen, and intermittent salinity data at various depths, typically for several months. The dataset for each county is available at https://data.novascotia.ca/browse?Detailed-Metadata_Department=Fisheries+and+Aquaculture&tags=coastal+monitoring+program For more information on CMAR and the Coastal Monitoring Program go to: https://cmar.ca/reports/
-
Oceanographic data from stationary moorings deployed as part of the Centre for Marine Applied Research's (CMAR) Coastal Monitoring Program.
-
Oceanographic data from stationary moorings deployed as part of the Centre for Marine Applied Research's (CMAR) Coastal Monitoring Program.
-
Oceanographic data from stationary moorings deployed as part of the Centre for Marine Applied Research's (CMAR) Coastal Monitoring Program.
-
Oceanographic data from stationary moorings deployed as part of the Centre for Marine Applied Research's (CMAR) Coastal Monitoring Program.
-
Oceanographic data from stationary moorings deployed as part of the Centre for Marine Applied Research's (CMAR) Coastal Monitoring Program.