 Arctic SDI catalogue
Biological diversity
Type of resources
Categories
Available actions
Topics
Keywords
Contact for the resource
Provided by
Formats
Representation types
Update frequencies
status
-
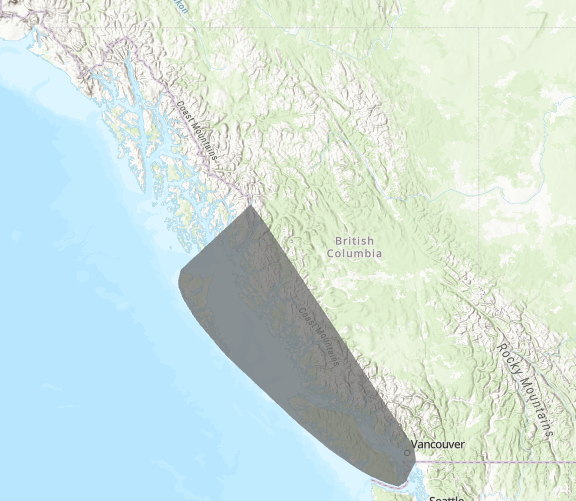
To ensure informed decision-making, management, and conservation of marine ecosystems along the British Columbia (BC) coastline, a comprehensive understanding of marine communities and habitats is necessary. Marine planning initiatives, including environmental incident response planning and the development of a marine protected area network, have long been challenged by significant gaps in our knowledge of the distribution of many nearshore marine species. This lack of critical information can impede our ability to effectively manage and protect vulnerable species and ecosystems. We developed a set of species distribution models (single-SDMs) using data collected from the benthic habitat mapping survey. These models correlate species occurrence data with environmental variables. We used these models to make predictions of the probability of occurrence of each species across the entire BC coast. A cluster analysis of the single-SDM predictions was then used to determine biotopes, which are distinct combinations of physical and chemical water properties and associated biological communities. We defined and mapped the spatial distribution and probability of nine nearshore macrofauna epibenthic biotopes along with three physiotopes based on environmental conditions. The definition of the biotopes includes correlated species, the type of substrate, and range of environmental conditions (slope, depth, current, temperature, salinity, and tidal current) occurring within each biotope. The biotopes defined here are a first, but important, step in quantitative bioregionalization for the Pacific region as the resolution of nearshore marine community information has been lacking in BC and has hindered marine spatial initiatives. This dataset contains 71 of the 72 single-SDMs (which excludes Northern abalone, an endangered species), the spatial distribution of 9 biotopes and 3 physiotopes, and the species richness calculated as the sum of occurrence probabilities across all 72 species.
-

Survey data depicting the presence of the endangered Rocky Mountain Ridged Mussel (Gonidea angulata) from 2008-2011. Surveys were conducted by different researchers at different locations.
-

The nematode collection was begun by A.D. Baker in 1943 and is the primary depository for Canadian nematodes excluding parasites of humans and other animals. There are nearly 30,000 slides and 5000 vials of over 88,000 roundworm specimens in the Canadian National Collection of Insects, Arachnids, and Nematodes (CNC), including approximately 5000 primary and secondary types of nearly 400 species. The nematode type catalogue, as of 1985 (from Journal of Nematology 17: 220–234) is available online. This checklist is based on a subset of CNC’s nematode (roundworm) accessions from Canada’s provinces and territories. This checklist is not exhaustive; nematodes regulated by the Canadian Food Inspection Agency are purposefully removed from this compilation. Scientific names were cross-referenced against valid and accepted names indicated in Nemys, the World Database of Nematodes. Dataset Type: Checklist Specimen Type: Preserved specimens
-

This geodatabase includes hotspot maps of 1) nearshore habitat richness, 2) diversity (fish and invertebrates), and 3) biomass (using catch per unit effort of fish and invertebrates), as well as two layers showing the spatial extent of the diversity and biomass hotspot analyses. Full details and methods can be found in the Rubidge et al. 2018 CSAS Research Document 2018/053 available here or at https://waves-vagues.dfo-mpo.gc.ca/Library/40759842.pdf. These data were reviewed as part of a Canadian Science Advisory Secretariat (CSAS) regional peer review process on Nov 1-2, 2017. Habitat Richness Hotspots: Because there are no systematic surveys of nearshore species that span the entire coastline of Northern Shelf Bioregion, the nearshore habitat richness hotspots were developed as a proxy for species diversity in nearshore areas. Habitat richness was calculated from eight habitat features: eelgrass, surfgrass, canopy-forming kelp, estuaries, areas of high rugosity, and hard, mixed, and soft substrate. The number of features within 1 km x 1 km planning units was counted, and hotspots were identified using the Getis-Ord G* tool in ArcGIS. Planning units with Gi_Bin values of 3 (99% confidence) were classified as habitat richness hotspots. Diversity and Biomass Hotspots: Hotspots of fish and invertebrate diversity and biomass were developed as proxies for spatial patterns of productivity in the Northern Shelf Bioregion. Diversity (Shannon diversity) and biomass (kg/hour or count/hook/hour) were calculated from DFO synoptic trawl and outside hard-bottom longline (HBLL) survey catch records. The outside HBLL survey was previously referred to as Pacific Halibut Management Area (PHMA) survey. The synoptic trawl and HBLL surveys have complementary spatial coverage, with the HBLL surveys occurring in more coastal areas (20–260 m) and the synoptic trawl surveys occurring on deeper shelf areas (50–1300 m). Hotspots were identified using the Getis-Ord G* tool in ArcGIS for five separate analyses: fish biomass (trawl), fish diversity (trawl), fish diversity (longline), invertebrate biomass (trawl), and invertebrate diversity (trawl). Using the Minimum Bounding Geometry Tool, convex hull polygons were drawn around groups of hotspot points (Gi_Bin values of 1, 2, or 3; confidence ≥90%) containing 10 or more points. The resulting polygons were then buffered by 1 km and manually edited where needed to exclude any large areas of the polygons that did not include hotspot points.
-
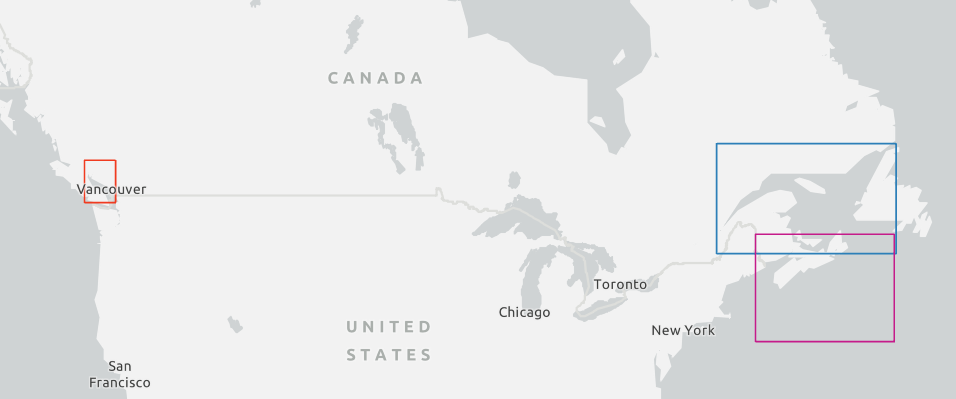
CMIST is a peer-reviewed screening-level risk assessment tool for marine invasive species (Drolet et al. 2016). It is a short questionnaire that follows the invasion process from arrival to impact and is designed so an informed assessor can evaluate one species in an assessment area in approximately one day using easily accessible information from internet databases, primary literature, and grey literature. Species can be those with an invasion history in an area or those that are candidates for future invasions. CMIST is score-based and incorporates both likelihood and impact of invasion as well as uncertainty. Questions are general to make CMIST broadly applicable to different taxa, different assessment areas, and different project goals. To date, CMIST has been tested with molluscs, tunicates, crustaceans, and polychaetes introduced or at risk of introduction to three Canadian marine ecoregions (DFO 2009). CMIST has also been successfully applied to non-indigenous freshwater fish in British Columbia with adapted guidelines (T. Therriault, pers. comm.). Upon completion, CMIST produces a risk score adjusted for the assessor’s uncertainty which, combined with information collected during the assessment, can be used to assist in management decisions. For example, in 2015, CMIST assessments were used to identify high risk invaders in three Canadian marine ecoregions (DFO 2016).
-

This dataset contains the abundance (per m²) and the biomass (mg dry per m²) of macrofauna (≥ 500µm) in eelgrass and adjacent bare soft sediments, collected at sites in the Atlantic of Nova Scotia from 2009 to 2013. Cite this data as: Wong M.C. Data of Benthic invertebrates in seagrass and bare soft sediments in Atlantic Nova Scotia Published May 2020. Coastal Ecosystems Science Division, Fisheries and Oceans Canada, Dartmouth, N.S. https://open.canada.ca/data/en/dataset/05d5f46a-7f19-11ea-8a4e-1860247f53e3 Publications: Wong, M. C., & Dowd, M. (2021). Functional trait complementarity and dominance both determine benthic secondary production in temperate seagrass beds. Ecosphere. 12(11), e03794. https://doi.org/10.1002/ecs2.3794 Wong, M. C. (2018). Secondary Production of Macrobenthic Communities in Seagrass (Zostera marina, Eelgrass) Beds and Bare Soft Sediments Across Differing Environmental Conditions in Atlantic Canada. Estuaries and Coasts, 41, 536–548. https://doi.org/10.1007/s12237-017-0286-2
-

The Coastal Biodiversity Trawl Survey for the Passamaquoddy Bay was conducted annually between July to October from 2009 to 2019. This survey was intended to monitor long-term change in local species presence, habitat utilization, and health. The sampling activities support coastal research in fisheries, aquaculture, marine protected areas, and ecosystem change. Data collected prior to 2013 are generally not recommended for comparative analysis due to changes in vessel, sampling effort, and protocols. For additional information please see: - Cooper, J.A. and Blanchard, M.J. 2016. Coastal Biodiversity Trawl of the Passamaquoddy Bay Area: 2009 to 2014. Can. Tech. Rep. Fish. Aquat. Sci. 3176: xi+52 p.
-

The Marine Biodiversity Observation Network Pole to Pole (MBON P2P) effort seeks to develop a framework for the collection, use and sharing of marine biodiversity data in a coordinated, standardized manner leveraging on existing infrastructure managed by the Global Ocean Observing System (GOOS; IOC-UNESCO), the GEO Biodiversity Observation Network (GEO BON), and the Ocean Biogeographic Information System (OBIS). The MBON Pole to Pole aims to become a key resource for decision-making and management of living resource across countries in the Americas for reporting requirements under the Intergovernmental Science-Policy Platform on Biodiversity and Ecosystem Services (IPBES), Aichi Targets of the Convention of Biological Diversity (CBD), and the UN 2030 Agenda for Sustainable Development Goals (SDGs). This collection corresponds to the species registered on rocky shores of the Musquash Harbour, Passamaquoddy Bay and Mispec Bay, New Brunswick, Canada, using the MBON P2P sampling protocol for rocky shores, with funding from the Government of Canada's Coastal Environmental Baseline Program. Citation: Reinhart B, Cooper A, Nason R, Jonah L (2025). MBON POLE TO POLE: ROCKY SHORE BIODIVERSITY OF MUSQUASH HARBOUR, PASSAMAQUODDY BAY AND MISPEC BAY. Version 1.7. Caribbean OBIS Node. Samplingevent dataset. https://ipt.iobis.org/mbon/resource?r=rockyshoresbayoffundynb&v=1.7
-
Estimates of population trends and annual indices of relative abundance for years 1970 through 2024, derived from the North American Breeding Bird Survey. Population trends are estimates of the rate of change in the population size over a period of time expressed as an annual percent change (e.g., -1.5%/year between 1970-2024). Annual indices of relative abundance are estimates of the abundance of the species in each year, relative to all other years with data. The indices are expressed as an average expected count during a BBS survey in a given year and region. The series of annual indices for a given region describe the estimated population trajectory through time. There are estimates here for >500 species of birds, and for all regions of Canada and the United States where there are sufficient data to estimate trends for each species. The estimates are available for the full survey area, Canada, United States, Canadian provinces and territories, US states, North American Bird Conservation Regions (BCRs), BCRs within each country (e.g., the Canadian portion of BCR 13), and for the geographic strata (spatial intersections of BCRs with the province/territory/state jurisdictions, such as BCR-13 in Ontario, Canada) that are used in the statistical analyses. The estimates were produced using a spatially explicit, hierarchical Bayesian statistical model (references in the read me file) that shares information among neighbouring regions to improve local estimates of trends and relative abundance. Note on the Bird Conservation Region numbers and codes. Recently, the largest Bird Conservation Regions in northern Canada (3, 6, 7, and 8) were subdivided and these new BCRs were used to define the spatial strata in these analyses. The new BCRs formed by the subdivision of the large northern BCRs were given interim alpha-numeric codes when the boundaries were first defined, which were the codes used in these analyses. These interim alphanumeric codes were subsequently changed to numeric codes, which will be used in future analyses, and will be found on published maps. The alphanumeric codes correspond to the new numeric codes as follows: (3C = 68, 3N = 69, 3S = 70, 6N = 71, 6S = 72, 7W = 73, 7H = 74, 7E = 75, 8W = 76, 8E = 77). The English and French names of the BCRs remain the same as those used in the current analyses and can also be used to locate BCRs on the maps. The BBS is jointly coordinated by Environment and Climate Change Canada, Canadian Wildlife Service and the United States Geological Survey, Eastern Ecological Science Center. Any use of these BBS results should acknowledge the thousands of skilled volunteers in Canada and the United States who have participated in the BBS over the years and those who have served as national, provincial, territorial, or state coordinators.
-
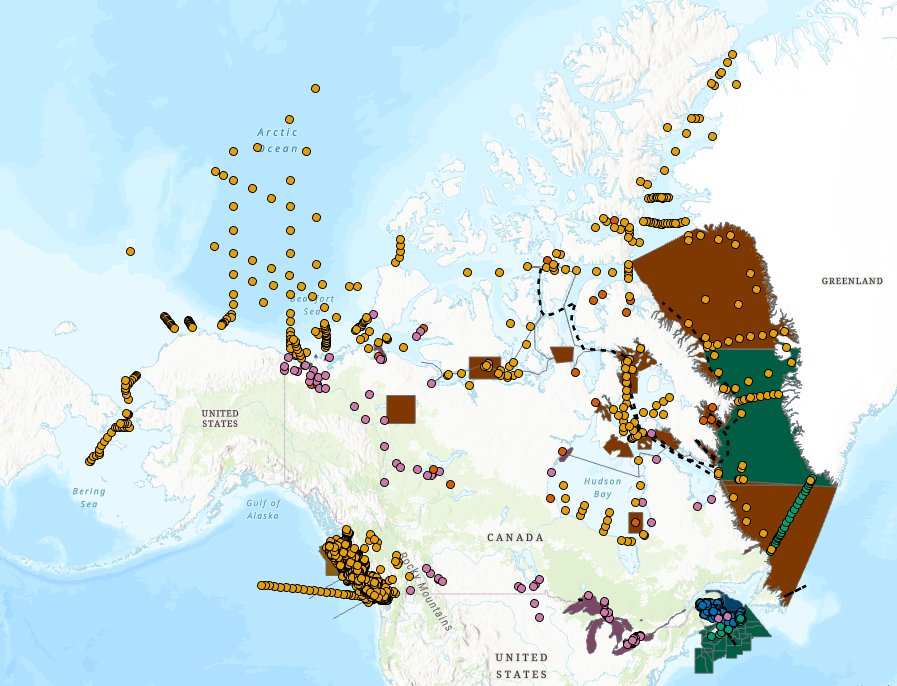
The Fieldnotes dataset provides information about science field work to be conducted each year by Fisheries and Oceans Canada (DFO) and collaborators. Field work takes place in the Pacific, Arctic and Atlantic Oceans, as well as the freshwater bodies of participating DFO Regions: Pacific, Arctic, Ontario and Prairie, Maritimes, and Gulf.