 Arctic SDI catalogue
Geomorphology
Type of resources
Available actions
Topics
Keywords
Contact for the resource
Provided by
Years
Formats
Representation types
Update frequencies
status
Service types
Scale
-

The marks left in the seabed by the commercial anchoring process can be seen as linear features in high-resolution multibeam bathymetry data. These features have been digitized to polylines for individual marks and polygons for anchor scour zones for British Columbia's (BC) commercial anchorages. They are made available via the Federal Geospatial Platform (FGP) for use in a Geographical Information System (GIS). This feature dataset is complete for published BC commercial anchorages and the multibeam bathymetry data available in 2021. It does not represent features produced since the collection of each multibeam bathymetry survey nor any features infilled since. The data are intended to be used for scientific research to better understand the cumulative impacts to the seabed from commercial anchoring at a 1:5000 scale or greater.
-

Fisheries and Oceans Canada (DFO) Maritime Science Branch has collected grain size data from sediment and water column samples using bottle samples, sediment cores, and sediment grabs as part of numerous research projects not only in the Atlantic provinces, but also worldwide. The data collected by DFO focuses on the fine grained (<1mm) particles as these are both a source of food and means of contaminant transport. Grain size data are used to study the fate and distribution of complimentary chemistries like heavy metals, pesticides, hydrocarbons, aquaculture waste as well as a variety of physical processes such as the resuspension and transport of sediment.
-
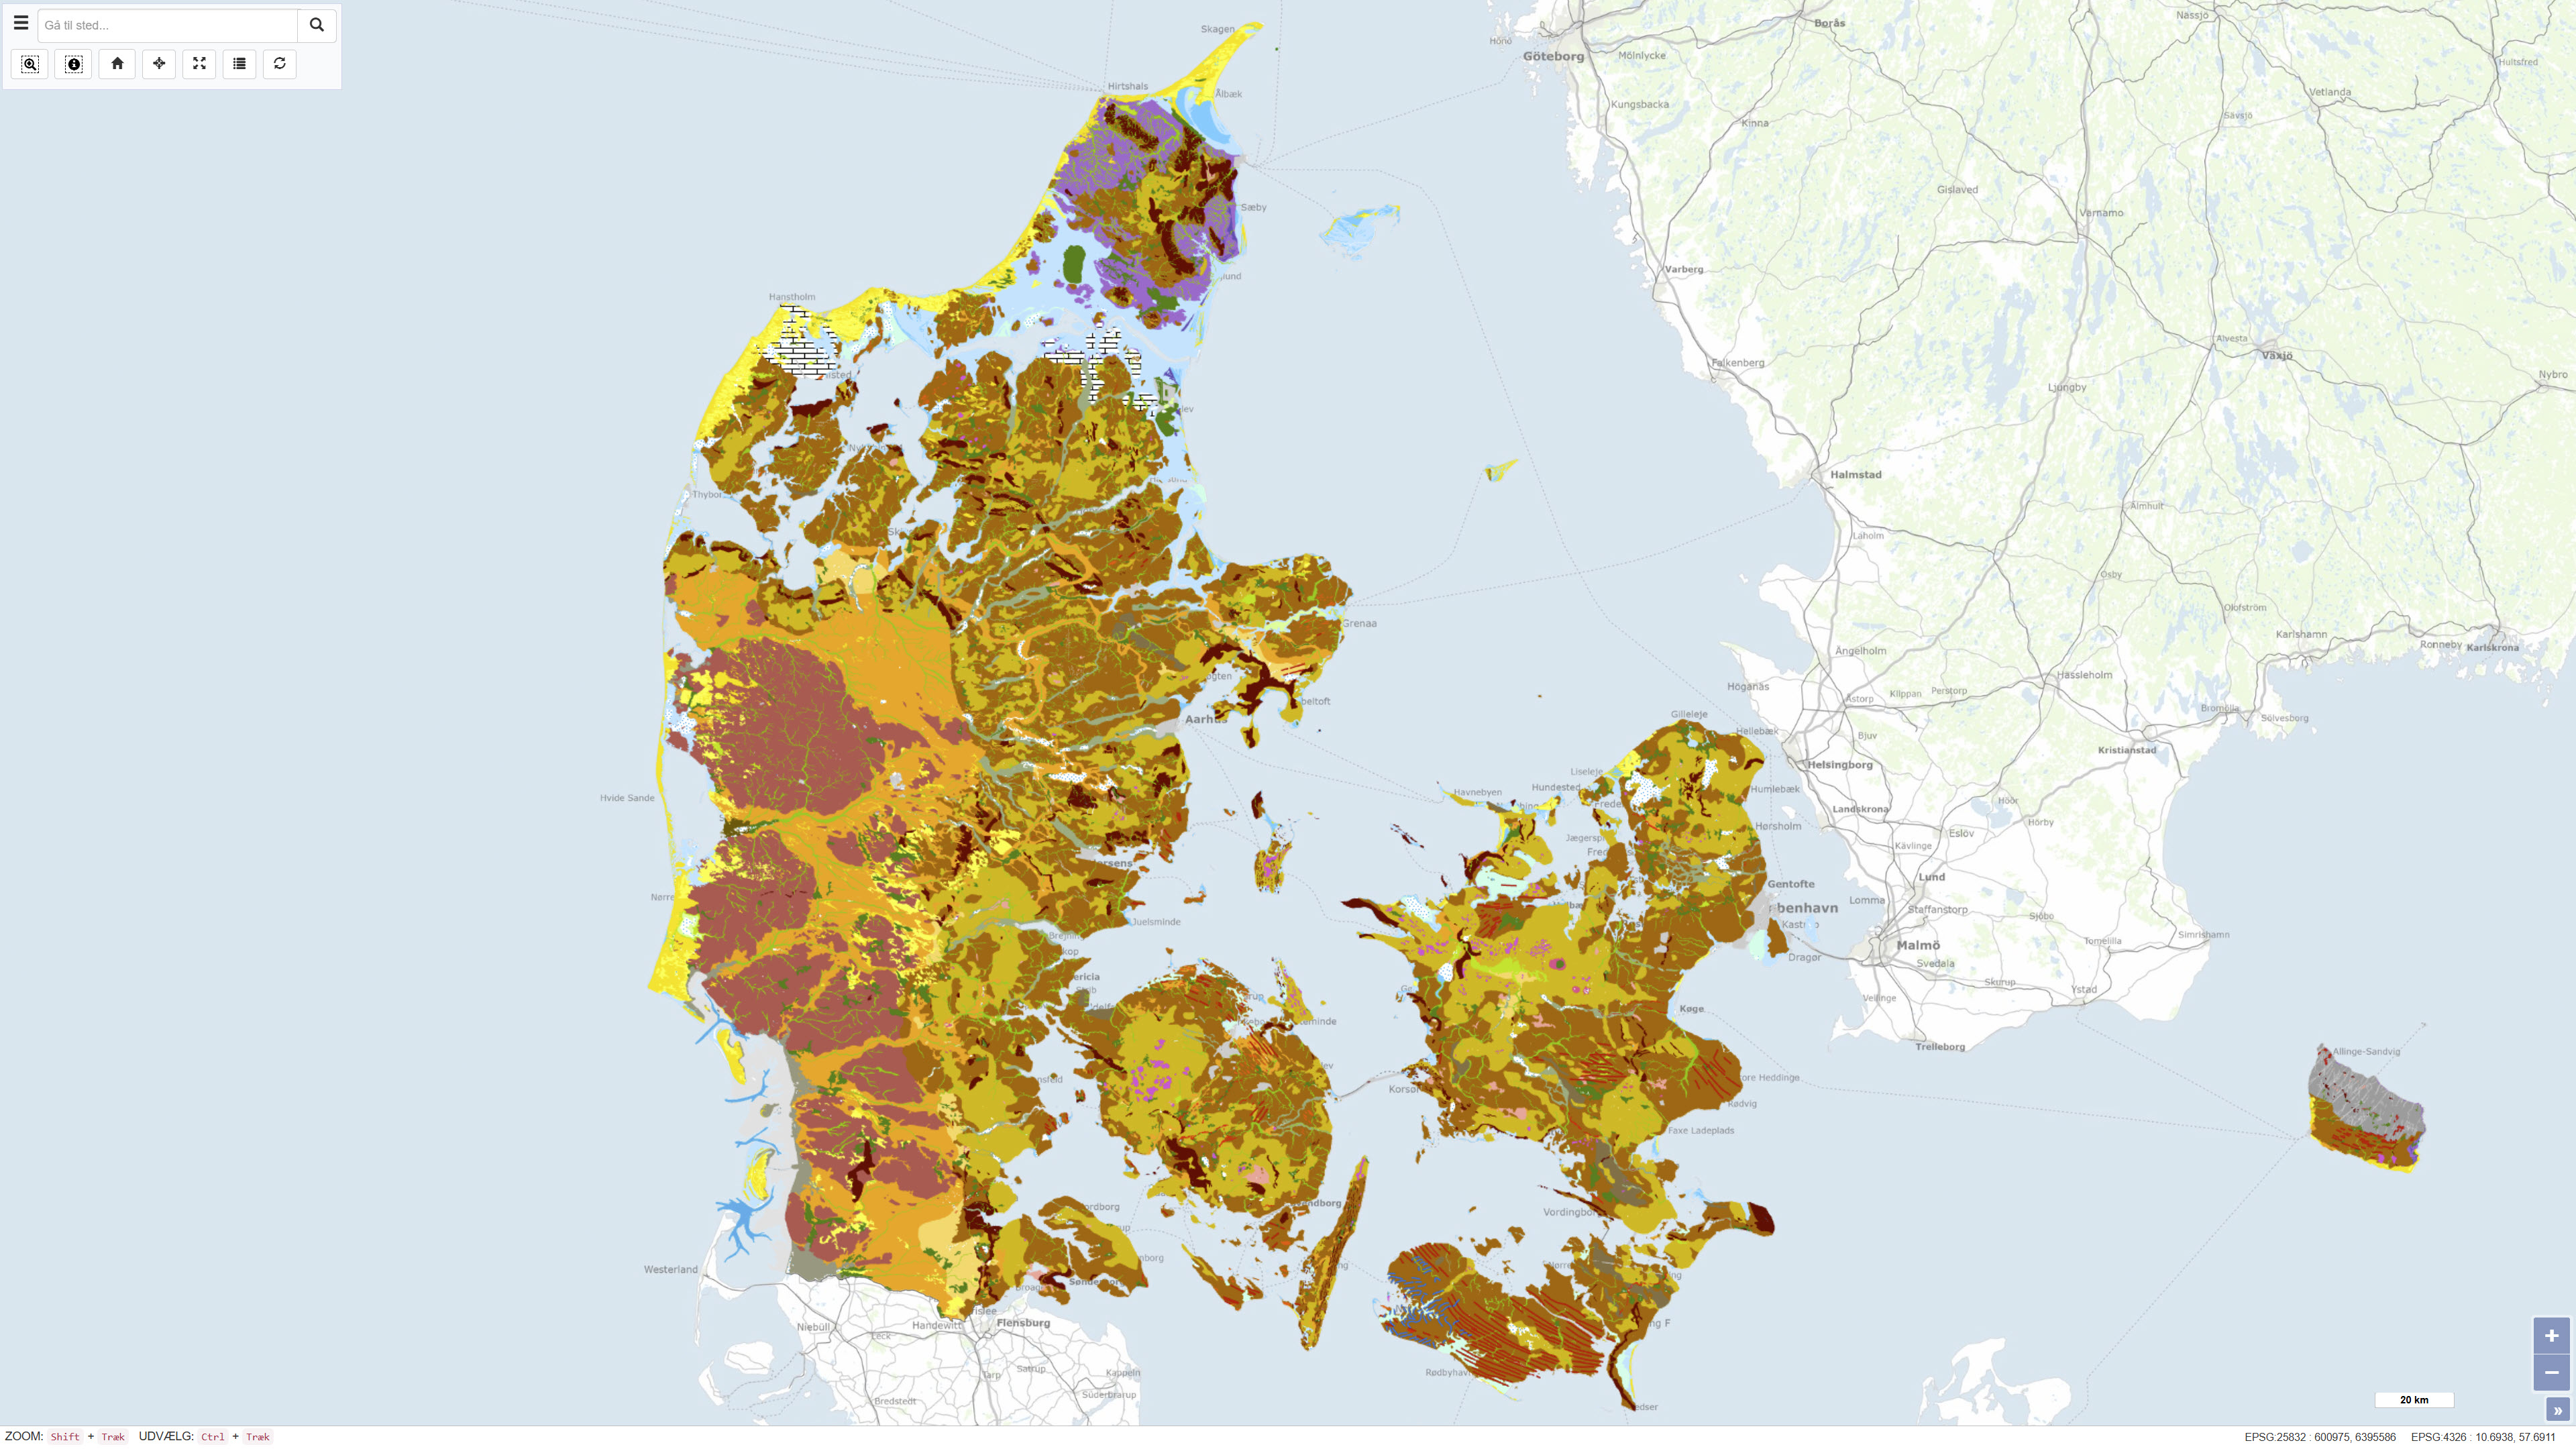
The Geomorphological Map of Denmark, version 3 (2022), depicts landscape types across Denmark at a scale of 1:200.000. The landscape types are defined based on shared geomorphological characteristics that can be related to the processes responsible for their formation. Most landscape types were formed during Quaternary glaciations and by meltwater from the glaciers, while the map also includes post-glacial landscapes such as marine and coastal environments, river valleys, lakes and wetlands, as well as aeolian landforms. The map further reflects landscape features influenced by pre-Quaternary bedrock, including exposed crystalline basement on Bornholm and chalk formations in northern Jutland, as well as surface features related to subsurface structural movements. Anthropogenic landscapes resulting from land reclamation, drainage, excavation, and infilling are also represented. The map is based on systematic geomorphological mapping and interpretation of landforms derived from geological data, terrain analysis and existing cartographic material.
-
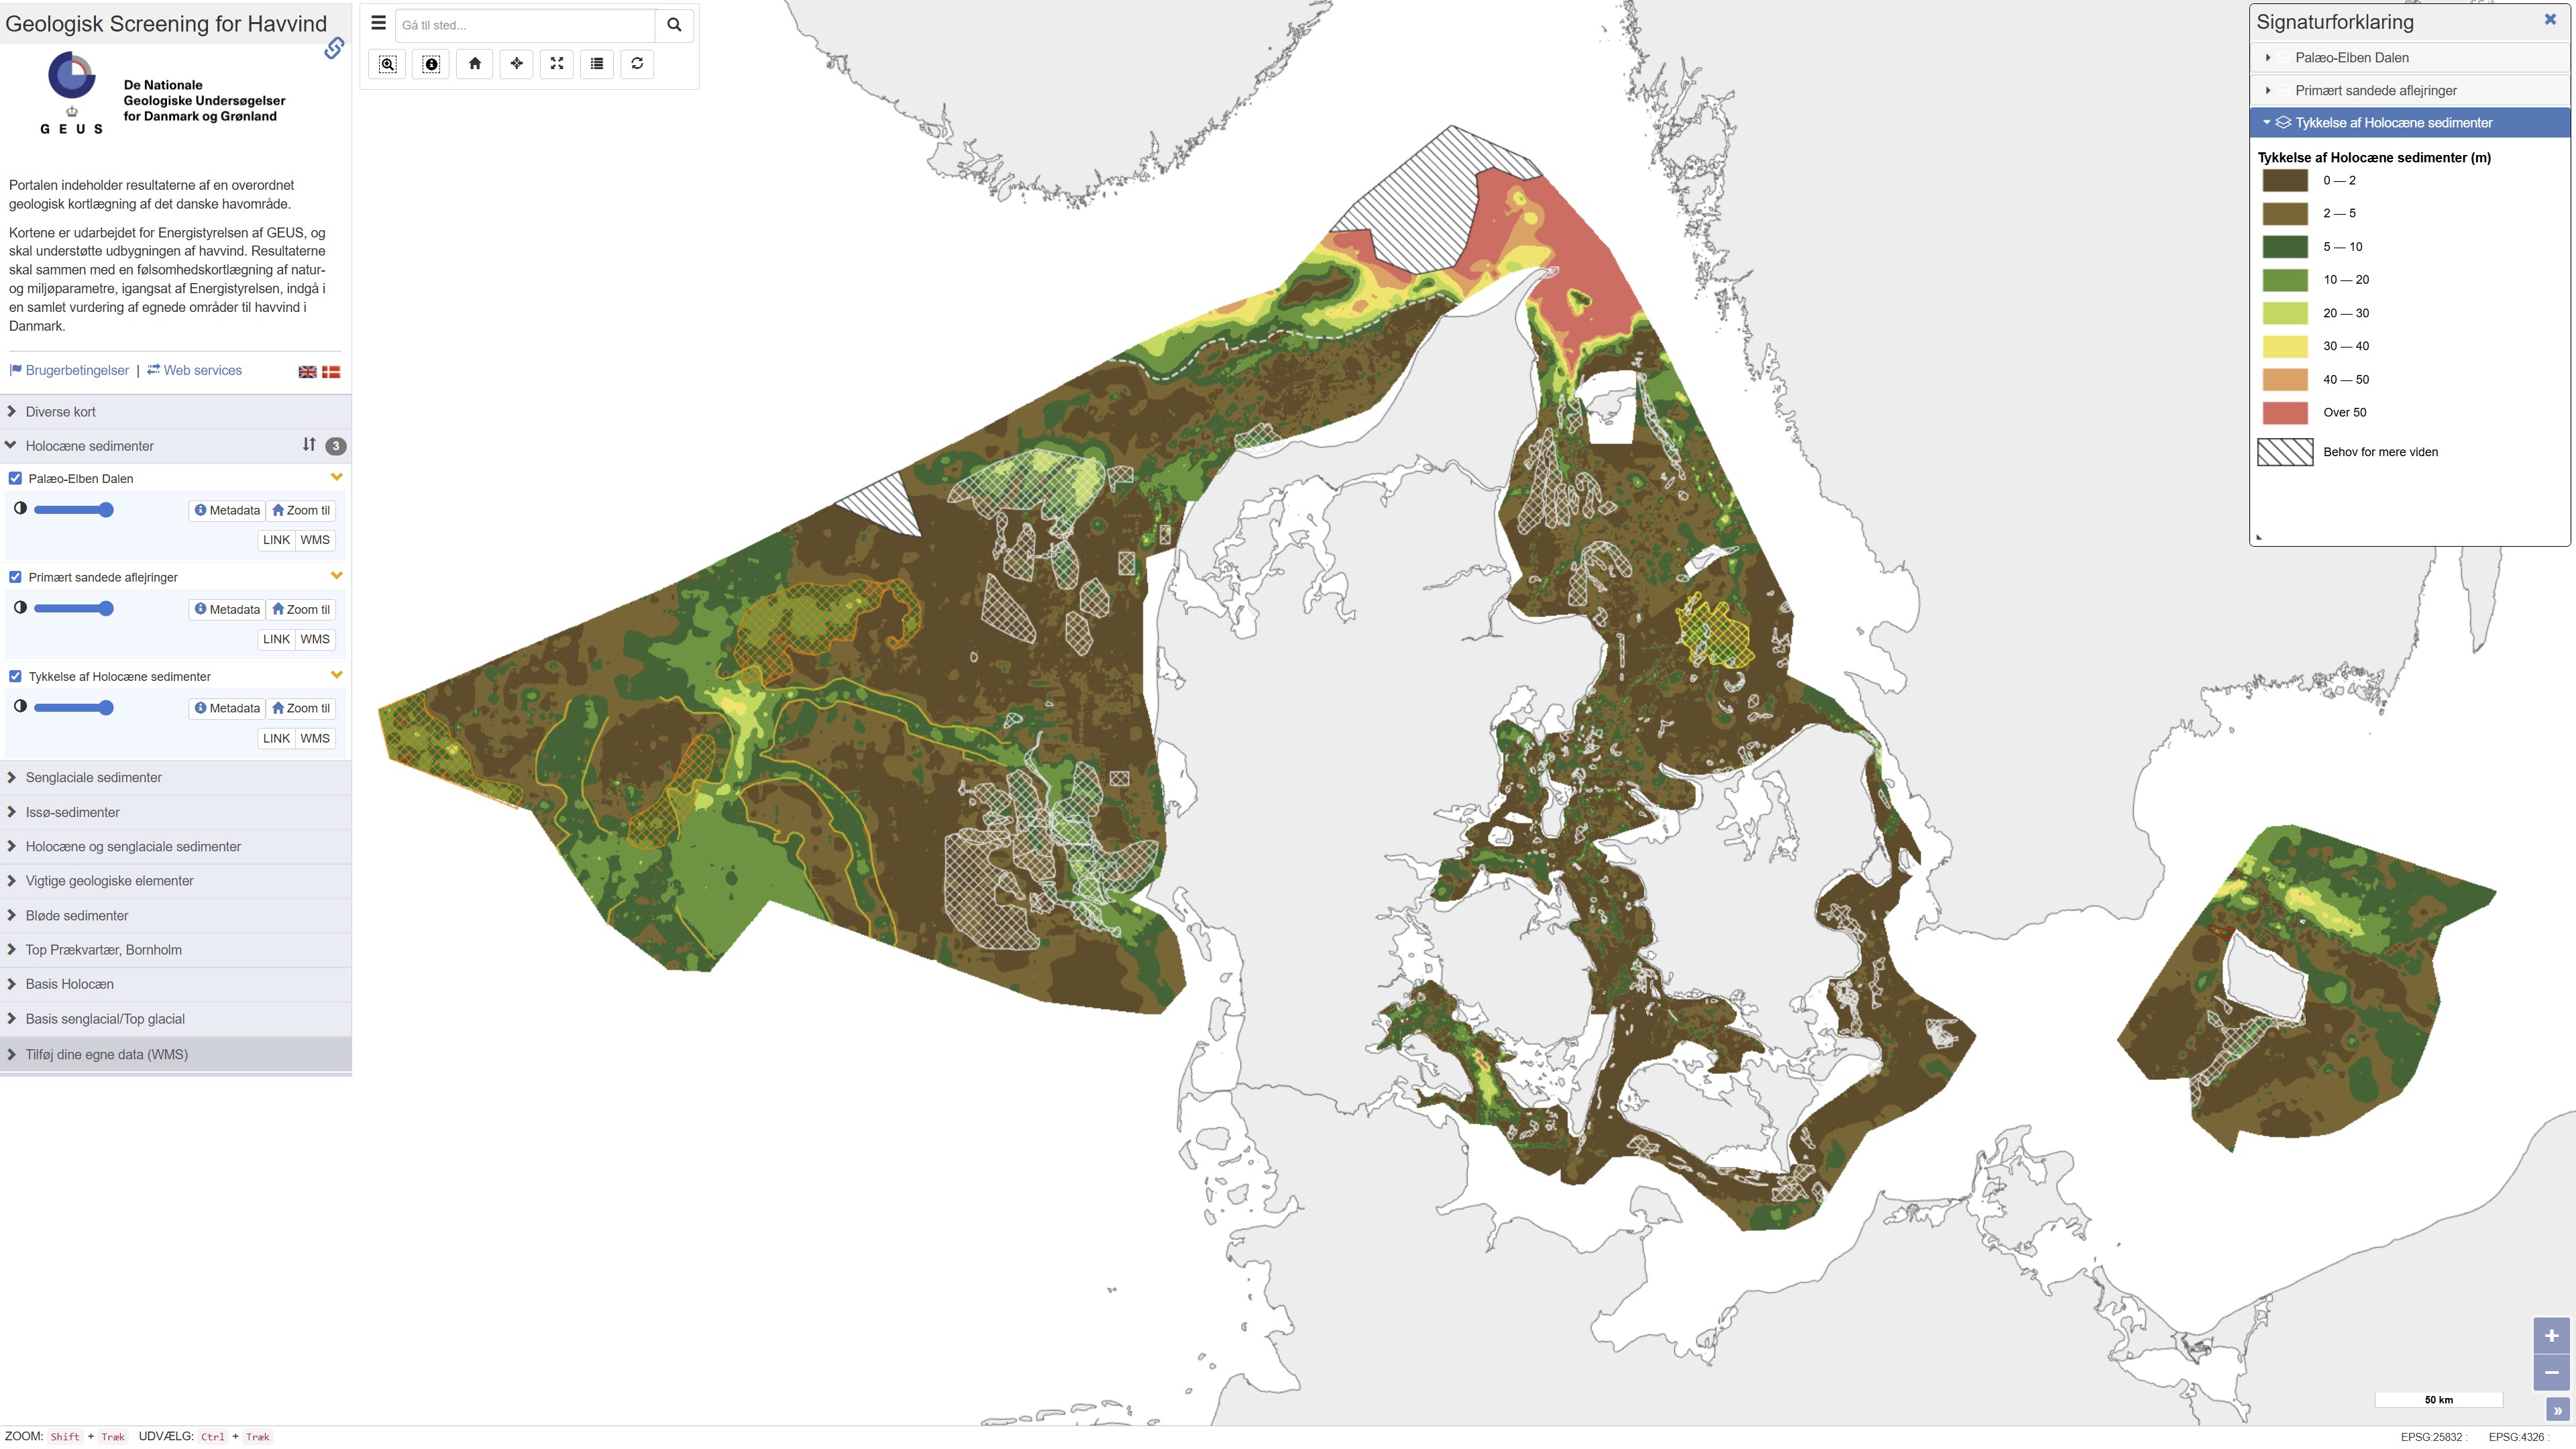
This repository contains maps of the thickness of late glacial and Holocene deposits in the Danish sea area, prepared as a basis for planning offshore wind. These are unconsolidated sediments that have not been overrun by the ice sheets of the ice ages, and therefore may have low geotechnical strength parameters. This is a large-scale and very general mapping, and no detailed interpretation of the distribution of sand and clay/mud/silt, respectively, has been made. In relation to the foundations of offshore wind turbines, sandy deposits will typically not pose a challenge, while soft deposits of clay, mud and silt in large thicknesses are assumed to pose foundation challenges. In addition to separate maps of the thickness of late glacial and Holocene deposits, a map of the total thickness of these two units has also been prepared, which thus constitutes a map of the total thickness of potentially soft sediments. Finally, the thickness of potentially soft sediments is used to divide the Danish sea area into categories in relation to the probability of larger thicknesses of soft sediments that could give rise to foundation challenges. Other maps are the thickness of potentially soft glacial lake sediments in the North Sea, the depth to the Pre-Quaternary surface in the waters around Bornholm, as well as the depth to the base of the Holocene deposits and the depth to the base of the late glacial deposits/top of the glacial deposits in the Danish sea area. As a supplement to the maps, a number of themes show where the late glacial and Holocene deposits are primarily expected to consist of sandy sediments. In addition, a number of themes show the Danish exclusive economic zone (EEZ), the location of conceptual geological models that can be seen in the overall report, all interpreted seismic lines, areas with near-surface gas in the sediments, interpreted distribution of the Palaeo-Elbe Valley in the North Sea, distribution of the Weichsel ice and ice-affected sediments in the North Sea, buried valleys (Prins & Andresen 2019; van der Vegt et al. 2012; Ottesen et al. 2020; Kirkham et al. 2024; Sandersen & Jørgensen 2016), structural elements (Al Hseinat & Hübscher 2017; Jensen et al. 2002), ice margin lines (Lange 1984; Kjær et al. 2003; Pedersen 2005; Phillips et al. 2018, 2022; Kirkham et al. 2024; Szuman et al. 2024; Pedersen & Boldreel 2017). The data basis for the work has primarily been new and existing near-surface seismic data and vibrocore drilling. The mapping was carried out for the Danish Energy Agency by GEUS, and is intended to support the development of offshore wind. The results, together with a sensitivity mapping of natural and environmental parameters, initiated by the Danish Energy Agency, are to be included in an overall assessment of suitable areas for offshore wind in Denmark.
-

Deposit is the layer of loose material that covers rock. It may have been established during the retreat of the glacier at the end of the last glaciation or by other processes associated with erosion and sedimentation. The nature of the loose deposit is evaluated based on the shape of the land, its position on the slope, the texture of the soil, or other indicators. Surface deposit maps make it possible to distinguish the main categories of surface deposits, to know their nature, thickness and distribution on Quebec territory. The map of **surface deposits in the North** is a component of an extensive inventory carried out to meet knowledge acquisition needs as part of the economic, social and environmental development project “Plan Nord”. This inventory was carried out between 2010 and 2013. The mapping of surface deposits was carried out using a new approach based on remote sensing techniques. The interpretation was carried out by geomorphologists using RapidEye anaglyph (3D) satellite images with high spatial resolution (5 m). Ground and air control points allowed the validation of the interpreted information. Mapping is available throughout the country north of the 53rd parallel, which represents an area of approximately 680,000 km2. The minimum mapping area is 100 ha. **This third party metadata element was translated using an automated translation tool (Amazon Translate).**
-
Topographic mapping of northern indigenous villages is available for 23 villages. It was produced by photogrammetric method, from aerial photographs taken between 2009 and 2011. The accuracy of this mapping is of the order of ±40 centimeters in planimetry. In hypsometry, it is ±50 centimeters for dimensional points and ±1 meter for level curves. This precision may vary locally. The main components are: * Hydrography (body of water, watercourse, etc.); * Communication routes and road and airport infrastructures (road, bridge, airport, etc.); * Buildings and various structures (building, wharf, surface reservoir, etc.); * Vegetation; * Geomorphology; * Level curves at an equidistance of 2 meters; * The points listed. The following villages are available: * Akulivik; * Aupaluk; * Chisasibi; * Eastmain; * Inukjuak; * Ivujivik; * Kangiqsualujjuaq; * Kangiqsujuaq; * Kangirsuk; * Kawawachikamach; * Kuujjuaq; * Kuujjuarapik-Whapmagoostui; * Mistisini; * Nemaska; * Ouje-Bougoumou; * Puvirnituq; * Quaqtaq; * Hello; * Tasiujaq; * Umiujaq; * Waskaganish; * Waswanipi; * Wemindji.**This third party metadata element was translated using an automated translation tool (Amazon Translate).**
-
As part of measure 2.6 of the 2013-2020 Action Plan on Climate Change, and in the wake of the project “[Characterization of the banks of the fluvial part of the St. Lawrence and analysis of the evolution of hydro-climatic factors influencing erosion and flooding hazards] (https://www.donneesquebec.ca/recherche/dataset/caracterisation-des-berges-et-analyse-de-l-evolution-des-facteurs-hydro-climatiques)” ()”, the MELCCFP mandated the team of the **Laboratoire de Géomorphology Terre-Mer du Département de Géomorphology de l'Université Laval ** in order to conduct a study on the mobility issues of banks in the fluvial section of the St. Lawrence. The selection of the six issues, spread over ten sites of interest, was based on the previous shoreline characterization project, which made it possible to locate significant problems related to shoreline mobility. The six issues addressed correspond to: 1. The archipelagos of the fluvial St. Lawrence and the seaway (sites of Île Marie, Île de Grace and Île des Barques) 2. Land use planning and delta formation in Lake Saint-Pierre (Yamachiche Point site) 3. The degradation of the sloping walls between Sainte-Marthe-du-Cap and Champlain (Pointe-au-Vent and Champlain sites) 4. The rapid dynamics of high soft cliffs (Cap Lévrard site) 5. The effects of docks on sedimentary transit in the fluvial estuary (Portneuf and Pointe-Platon sites) 6. The management of urban beaches in Quebec (site of Plage-Jacques-Cartier, Anse-Tibbits and Beauport Bay beach) This new study has thus made it possible to provide scientific knowledge adapted to the specificities of this densely populated sector of the river, in order to (1) better understand the hydrogeomorphological trajectory of this large fluvial system, and (2) to guide management practices towards better respect for its mobility space and the integrity of its ecosystems. The development of a multi-scale monitoring approach, combining geomorphological and geohistorical components, has proven to be very effective in documenting the implications of the highly artificial nature of the fluvial St. Lawrence and in better defining the influence of natural processes. The project was made possible thanks to the creation of a vast geospatial database, collected and processed by the research team. In a process of sharing and disseminating, the team makes available all the deliverables and geospatial data* produced during this study, in particular: A comprehensive report detailing the context of the study, the methodology, the results in the form of six extensively illustrated Mobility-Trajectory sheets, as well as a summary accompanied by a discussion on the impacts of land use planning along the fluvial St. Lawrence. Self-supported version of the six Mobility-Trajectory portrait sheets. Geospatial data associated with the historical mapping of coastline features (CTs) and their migration rates, as well as products derived from drone imagery, such as numerical surface models (MNS) and orthomosaics. *Higher spatial and temporal resolution data are available upon request. **This third party metadata element was translated using an automated translation tool (Amazon Translate).**
-

The land features of the CanVec series contains landscape features of Canada such as islands, shoreline delineation, wooded areas, saturated soil features, landform features (esker, sand, etc.). The CanVec multiscale series is available as prepackaged downloadable files and by user-defined extent via a Geospatial data extraction tool. Related Products (Open Maps Links): [Topographic Data of Canada - CanVec Series](https://open.canada.ca/data/en/dataset/8ba2aa2a-7bb9-4448-b4d7-f164409fe056)
-

Description of the submarine morphology and characteristics of the sediments (lithology, grain size, mineralogy, and chemistry) of the Saguenay fjord, the lower Estuary and Gulf of St. Lawrence. The layer contains a synthesis of geological and geochemical data collected and interpreted over 10 years and is accompanied by detailed bathymetric and surface sediment maps. Most of this study deals with the geomorphology, surface sediments (lithology, mineralogy, and chemistry), and present depositional conditions, but several studies have also been made of the bedrock geology and the stratigraphy of the unconsolidated sediments. Purpose These studies are regional and of a reconnaissance nature in the sense that they have been designed to obtain acoustical and sampling data on the morphology and basic properties of the sediments from the whole Gulf. This approach was used to provide a broad appraisal of the sedimentary environment of the Gulf and its late-glacial and postglacial history. Additional Information Unknown date of numeric version. Acoustical and sampling data were obtained in the River and Gulf of St. Lawrence on board of different boats over the years. Sounding lines and sample stations were selected initially on the basis of submarine morphology and later in combination with a preliminary sedimentological map as the sea floor data accumulated. More specifically, acoustical data on the topography and nature of the sea floor was obtained from echosounding and continuous seismic profiling. Sounding records were studied, interpreted, and reduced manually in most cases to a scale suitable for plotting and presentation. The information on the continuous seismic records was first interpreted visually and the reduced to constant scale with the aid of a pantograph with independently vertical and horizontal scales. Also, about 1500 sediments samples have been collected from various parts of the Gulf to obtain a regional coverage of the sedimentary environment in the area. The sediment sample were sorted and split after their water content had been determined. Mineralogical analyses were carried out after separation into a heavy and light fraction. The light minerals were identified by a combined method of staining and the use of immersion liquids. For more details on consulted documents and their limit, see the following report: Loring, D. H., and D. J. G. Nota. 1973. Morphology and sediments of the Gulf of St. Lawrence. Bull. Fish. Res. Bd. Can. 182. 147 p. + 7 charts.
-

Seamounts have been identified as Ecologically or Biologically Significant Areas (EBSAs) due to their unique oceanography and ecology; they frequently serve as sites for fisheries and as habitat for a number of species of conservation concern. A mix of isolated seamounts and seamount complexes are distributed throughout Canada’s Pacific offshore waters, although only a subset of these are named. We used several pre-existing spatial databases and predictive models to map all named seamounts within Canada’s Exclusive Economic Zone (EEZ), all named seamounts fished by Canada in international waters, and any predicted (modelled) unnamed seamounts in the EEZ. These data are intended to inform marine planning initiatives in BC by providing collaborative, peer-reviewed scientific data at scales relevant to a BC coast-wide analysis.