 Arctic SDI catalogue
Northern Hemisphere
Type of resources
Available actions
Topics
Keywords
Contact for the resource
Provided by
Years
Formats
Representation types
Update frequencies
status
Service types
Scale
-
This map server from the National Snow and Ice Data Center (NSIDC) provides cryospheric data and information pertinent to the Northern Hemisphere. Map images and source data are provided through Open Geospatial Consortium, Inc. (OGC) protocols (WMS, WFS, and WCS). For other related OGC data sets from NSIDC, see also the Atlas of the Cryosphere at: http://nsidc.org/data/atlas/. If you have questions, comments or suggestions, please contact NSIDC User Services at +1.303.492.6199 or nsidc@nsidc.org.
-
The National Snow and Ice Data Center (NSIDC) Atlas of the Cryosphere is a map server that provides data and information pertinent to the frozen regions of Earth, including monthly climatologies of sea ice extent and concentration, snow cover extent, and snow water equivalent, in addition to glacier outlines, permafrost extent and classification, ice sheet elevation and accumulation, and more. In order to support polar projections, the Atlas is divided into two separate map servers: one for the Northern Hemisphere and one for the Southern Hemisphere. In addition to providing map images and source data through Open Geospatial Consortium, Inc. (OGC) protocols (WMS, WFS, and WCS), a dynamic web interface for exploring these data is also available at http://nsidc.org/data/atlas. If you have questions, comments or suggestions, please contact NSIDC User Services at +1.303.492.6199 or nsidc@nsidc.org. The development of this map server application was supported by NASA's Earth Observing System (EOS) Program under contract NAS5-03099 and was developed using MapServer, an Open Source development environment for building spatially-enabled internet applications. To cite the Atlas of the Cryosphere: Maurer, J. 2007. Atlas of the Cryosphere. Boulder, Colorado USA: National Snow and Ice Data Center. Digital media. Available at http://nsidc.org/data/atlas/.
-

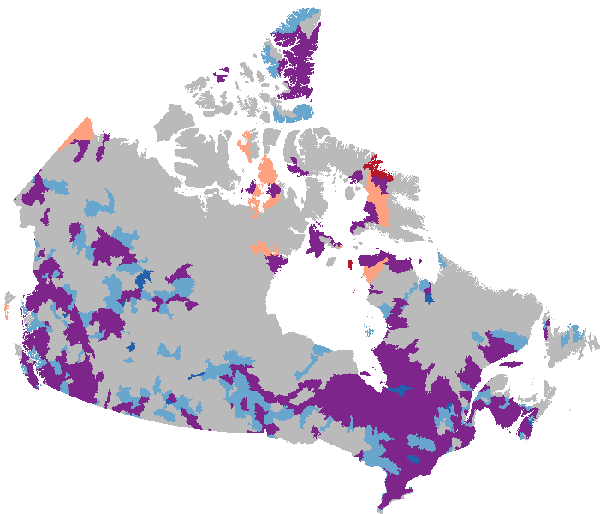
Collection of Land Cover products for Canada as produced by Natural Resources Canada using Landsat satellite imagery. This collection of cartographic products offers classified Land Cover of Canada at a 30 metre scale, updated on a 5 year basis. - [Landcover of Canada 2010](https://open.canada.ca/data/en/dataset/c688b87f-e85f-4842-b0e1-a8f79ebf1133) - [Landcover of Canada 2015](https://open.canada.ca/data/en/dataset/4e615eae-b90c-420b-adee-2ca35896caf6) - [Landcover of Canada 2020](https://open.canada.ca/data/en/dataset/ee1580ab-a23d-4f86-a09b-79763677eb47)
-

Land cover information is essential for a wide range of environmental applications, including climate impact assessment and adaptation, emergency response, and wildlife habitat monitoring. In Canada, a 2008 user survey identified that the most practical format for land cover data is a nationwide map with a 30 m spatial resolution, updated every five years. To meet this need, the Canada Centre for Remote Sensing (CCRS) has been producing 30 m resolution land cover maps since 2010, with updates released in 2015 and 2020. These datasets also serve as Canada’s contribution to the 30 m Land Cover Map of North America, developed collaboratively by government agencies in Mexico, the United States, and Canada through the North American Land Change Monitoring System (NALCMS). The classification system used in these maps is designed for consistency across North America. It follows a two-level hierarchy based on the Food and Agriculture Organization (FAO) Land Cover Classification System (LCCS), consisting of 12 classes at Level I and 19 classes at Level II. Of the 19 Level II classes, 15 are applicable to Canada and are included in the national land cover dataset. Tropical vegetation classes (specifically classes 3, 4, 7, and 9) are either absent or occur only minimally in Canada and are therefore excluded from the national dataset. Canada’s land cover maps are generated using observations from the Operational Land Imager (OLI) Landsat sensor. An accuracy assessment based on 832 randomly distributed samples indicates that the latest dataset achieves 86.9% overall accuracy, with no marked spatial inconsistencies. - [Land Cover of Canada - Cartographic Product Collection](https://open.canada.ca/data/en/dataset/11990a35-912e-4002-b197-d57dd88836d7) - [NALCMS — The North American Land Change Monitoring System](https://www.cec.org/publications/nalcms/)
-
Land cover information is necessary for a large range of environmental applications related to climate impacts and adaption, emergency response, wildlife habitat, etc. In Canada, a 2008 user survey indicated that the most practical land cover data is provided in a nationwide 30 m spatial resolution format, with an update frequency of five years. In response to this need, the Canada Centre for Remote Sensing (CCRS) has generated a 30 m land cover map of Canada for the base year 2010, as the first of a planned series of maps to be updated every five years, or more frequently. This land cover dataset is also the Canadian contribution to the 30 m spatial resolution 2010 Land Cover Map of North America, which is produced by Mexican, American and Canadian government institutions under a collaboration called the North American Land Change Monitoring System (NALCMS). This land cover dataset for Canada is produced using observation from Thematic Mapper (TM) and Enhanced Thematic Mapper (ETM+) Landsat sensors. An accuracy assessment based on 2811 randomly distributed samples shows that land cover data produced with this new approach has achieved 76.60% accuracy with no marked spatial disparities. - [Land Cover of Canada - Cartographic Product Collection](https://open.canada.ca/data/en/dataset/11990a35-912e-4002-b197-d57dd88836d7)
-
Land cover information is necessary for a large range of environmental applications related to climate impacts and adaption, emergency response, wildlife habitat, etc. In Canada, a 2008 user survey indicated that the most practical land cover data is provided in a nationwide 30 m spatial resolution format, with an update frequency of five years. In response to this need, the Canada Centre for Remote Sensing (CCRS) has generated a 30 m land cover map of Canada for the base year 2010, as well as this 2015 land cover map. This land cover dataset is also the Canadian contribution to the 30 m spatial resolution 2015 Land Cover Map of North America, which is produced by Mexican, American and Canadian government institutions under a collaboration called the North American Land Change Monitoring System (NALCMS). This land cover dataset for Canada is produced using observation from Operational Land Imager (OLI) Landsat sensor. An accuracy assessment based on 806 randomly distributed samples shows that land cover data produced with this new approach has achieved 79.90% accuracy with no marked spatial disparities. - [Land Cover of Canada - Cartographic Product Collection](https://open.canada.ca/data/en/dataset/11990a35-912e-4002-b197-d57dd88836d7)
-
The National Snow and Ice Data Center (NSIDC) Atlas of the Cryosphere is a map server that provides data and information pertinent to the frozen regions of Earth, including monthly climatologies of sea ice extent and concentration, snow cover extent, and snow water equivalent, in addition to glacier outlines, permafrost extent and classification, ice sheet elevation and accumulation, and more. In order to support polar projections, the Atlas is divided into two separate map servers: one for the Northern Hemisphere and one for the Southern Hemisphere. In addition to providing map images and source data through Open Geospatial Consortium, Inc. (OGC) protocols (WMS, WFS, and WCS), a dynamic web interface for exploring these data is also available at http://nsidc.org/data/atlas. If you have questions, comments or suggestions, please contact NSIDC User Services at +1.303.492.6199 or nsidc@nsidc.org. The development of this map server application was supported by NASA's Earth Observing System (EOS) Program under contract NAS5-03099 and was developed using MapServer, an Open Source development environment for building spatially-enabled internet applications. To cite the Atlas of the Cryosphere: Maurer, J. 2007. Atlas of the Cryosphere. Boulder, Colorado USA: National Snow and Ice Data Center. Digital media. Available at http://nsidc.org/data/atlas/.
-
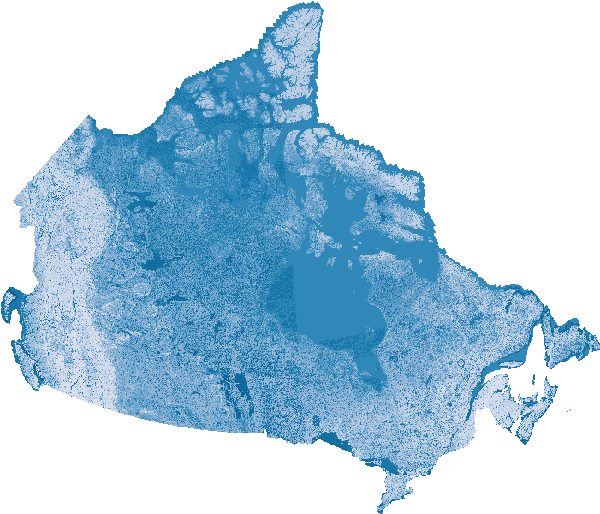
This collection of flood susceptibility products captures temporal patterns of historic flood events from 2000 to 2023, derived from flood susceptibility maps. The layers are designed to support decision-making by providing easily interpretable information for planning, screening, and other management purposes. This collection contains several datasets which explore the suite of rasters from 2000 to 2023: - Extreme wet and extreme dry years and the associated average flood susceptibility, processed by NHN WU, as found by Generalized Extreme Value (GEV) analysis - Flood susceptibility envelope, which is derived from the above wet and dry years - Trend slope, for each pixel the value for each year is extracted and the linear trend is computed, greater than 1000 is increasing flood susceptibility and below 1000 is decreasing flood susceptibility. - Trend Class, as identified by wet and dry scores, applied to NHN WU - Current flood susceptibility, which represents the estimated average value of present-day flood susceptibility - Current interquartile range, which provides and indication of the temporal variability of a given pixel under the current regime. This dataset forms part of a broader collection of flood susceptibility datasets, offering related information and analyses. The collection includes an overview page with associated publications, historic susceptibility values, temporal trends, and future projections. - **[Collection - Flood Susceptibility Mapping](https://open.canada.ca/data/en/dataset/1074f781-85d3-4c86-86cb-fd1c339197dc)** - **[Historic - Flood Susceptibility Mapping](https://open.canada.ca/data/en/dataset/ea1384df-bf4a-4743-97bb-870dc43f8d77)** - **[Future - Flood Susceptibility Mapping](https://open.canada.ca/data/en/dataset/c00f95a3-7bab-4d28-b9cc-b30f06b5afd2)**
-
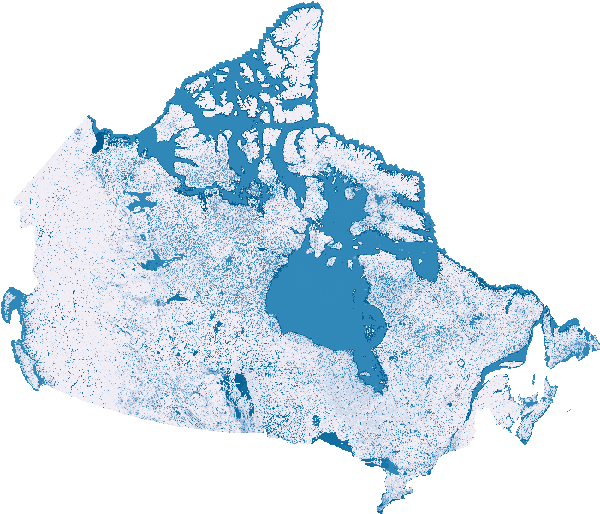
This series of projected future flood susceptibility maps were generated using an XGBoost machine learning model trained on major floods from 2005 to 2023. The trained model was applied to future climate scenarios for 2050, 2070, and 2100, under two SSP scenarios: 245 and 585. The model uses temperature and precipitation time series to estimate potential future flood susceptibility. These maps represent model projections and should be interpreted as indicators of potential flood susceptibility, not precise forecasts. This dataset forms part of a broader collection of flood susceptibility datasets, offering related information and analyses. The collection includes an overview page with associated publications, historic susceptibility values, temporal trends, and future projections. - [Collection – Flood Susceptibility Mapping]( https://open.canada.ca/data/en/dataset/1074f781-85d3-4c86-86cb-fd1c339197dc) - [Historic - Flood Susceptibility Mapping]( https://open.canada.ca/data/en/dataset/ea1384df-bf4a-4743-97bb-870dc43f8d77) - [Trends and Extremes – Flood Susceptibility Mapping]( https://open.canada.ca/data/en/dataset/3202e0a0-0afb-4120-b102-b0c41f0fb9eb)
-
This series of historic flood susceptibility maps comes from an XGBboost machine learning model trained on major floods from 2005 to 2023. The trained model is then run for each year from 2000 to 2023, including unique temporal characteristics of temperature, precipitation, land use land cover and Normalized Difference Vegetation Index (NDVI), to predict the flood susceptibility of any given year. This dataset forms part of a broader collection of flood susceptibility datasets, offering related information and analyses. The collection includes an overview page with associated publications, historic susceptibility values, temporal trends, and future projections. - [Collection – Flood Susceptibility Mapping]( https://open.canada.ca/data/en/dataset/1074f781-85d3-4c86-86cb-fd1c339197dc) - [Trends and Extremes – Flood Susceptibility Mapping]( https://open.canada.ca/data/en/dataset/3202e0a0-0afb-4120-b102-b0c41f0fb9eb) - [Future - Flood Susceptibility Mapping]( https://open.canada.ca/data/en/dataset/c00f95a3-7bab-4d28-b9cc-b30f06b5afd2)