 Arctic SDI catalogue
tree
Type of resources
Available actions
Topics
Keywords
Contact for the resource
Provided by
Years
Formats
Representation types
Update frequencies
status
Resolution
-

Cartography of the vegetation cover of Quebec City. The canopy represents the projection on the ground of the tops (crown) of trees (including leaves, branches, and trunks), which is visible from the sky. The data comes from an automated classification of two satellite images covering Quebec City by the pair of World-View-3 and Pléiades satellites acquired in July 2020 (spatial resolution of 31 cm) and from the 2017 Lidar survey of Quebec City.**This third party metadata element was translated using an automated translation tool (Amazon Translate).**
-

The administration of coal projects in the Yukon is governed under the Territorial Lands (Yukon) Act (TLYA) and the Coal Regulations enabled under the TLYA. The land use permits necessary for coal exploration and development are issued by the Energy Mines and Resources Lands Branch under the TLYA. The remaining coal licenses and coal leases are issued and administered by the Mineral Resources Branch Mining Lands offices. Distributed from [GeoYukon](https://yukon.ca/geoyukon) by the [Government of Yukon](https://yukon.ca/maps) . Discover more digital map data and interactive maps from Yukon's digital map data collection. For more information: [geomatics.help@yukon.ca](mailto:geomatics.help@yukon.ca)
-
Yukon Bedrock Geology Map This update of the Yukon bedrock geology map builds upon the previous compilation by Gordey and Makepeace (1999, 2001). It includes new, detailed bedrock geology maps and regional compilations that have been published by the Yukon Geological Survey and the Geological Survey of Canada between 1999 and 2015, as well as some recent thesis works. A few of these maps were partially integrated into the digital dataset by Gordey and Makepeace (2003), but only as overlay to the 1999 compilation. A number of errors and omissions from the 1999 compilation of Gordey and Makepeace were also noted and corrected during compilation of this version of the map. The Yukon bedrock geology GIS dataset is regularly updated and can be downloaded from the Yukon Geological Survey ' s website: [https://yukon.ca/en/science-and-natural-resources/geology](https://yukon.ca/en/science-and-natural-resources/geology) . Users are advised to consult the website regularly to ensure they are working with the latest version of the geodatabase or shape files. This update of the GIS dataset includes an expanded attribute structure (compared to the 1999 dataset) that facilitates searching of the geodatabase. This dataset requires the gscGeology font in order to properly label the bedrock polygons. This font file is packaged with the dataset when downloaded from [https://yukon.ca/maps](https://yukon.ca/maps) or [https://yukon.ca/en/science-and-natural-resources/geology](https://yukon.ca/en/science-and-natural-resources/geology) . The Yukon Geological Survey aims to provide users with the best available geoscience data for Yukon. Any revisions or additional geological information known to the user would be welcomed by the Yukon Geological Survey. Distributed from [GeoYukon](https://yukon.ca/geoyukon) by the [Government of Yukon](https://yukon.ca/maps) . Discover more digital map data and interactive maps from Yukon's digital map data collection. For more information: [geomatics.help@yukon.ca ](mailto:geomatics.help@yukon.ca)
-
This feature delineates forest and vegetation stands in the Yukon at a scale of 1: 40 ,000. It is a management level forest inventory (as opposed to a n operational level) - meaning that analysis and mapping are most effective close to the 1:40,000 scale and not larger . This inventory has been completed in various stages : delineation from hardcopy black and white photographs took place from 1987 to 2002; while recent data collection has proceeded through a digital (aka 'softcopy') methodology of scanned photographs and digital elevation models. Distributed from [GeoYukon](https://yukon.ca/geoyukon) by the [Government of Yukon](https://yukon.ca/maps) . Discover more digital map data and interactive maps from Yukon's digital map data collection. For more information: [geomatics.help@yukon.ca](mailto:geomatics.help@yukon.ca)
-
These are the boundaries of disturbance area that underwent forest management activities and are monitored to determine if reforestation obligations were achieved. Openings were derived from forest cover surveys, GPS field data collections, and satellite imagery. This database is the most current information available, but will be updated as new information is added. HARVEST_START - This is the date that harvesting started in the opening. REGEN_MET - This is the date that regeneration was determined to be present in the opening. FG_MET - This is the date that a free growing status was determined to be present in the opening. RELIEVED_OF_OBLIGATION - This is the date that the opening was determined to be returning to a forested area, was relieved of any further Silviculture obligations to reforest, and returned to the forest inventory. Distributed from [GeoYukon](https://yukon.ca/geoyukon) by the [Government of Yukon](https://yukon.ca/maps) . Discover more digital map data and interactive maps from Yukon's digital map data collection. For more information: [geomatics.help@yukon. ca](mailto:geomatics.help@yukon.ca)
-
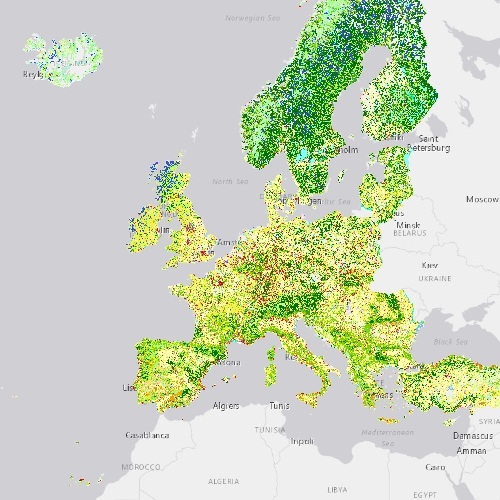
Riparian zones represent transitional areas occurring between land and freshwater ecosystems, characterised by distinctive hydrology, soil and biotic conditions and strongly influenced by the stream water. They provide a wide range of riparian functions (e.g. chemical filtration, flood control, bank stabilization, aquatic life and riparian wildlife support, etc.) and ecosystem services. The Riparian Zones products support the objectives of several European legal acts and policy initiatives, such as the EU Biodiversity Strategy to 2020, the Habitats and Birds Directives and the Water Framework Directive. This metadata refers to the Riparian Zones 2012 Land Cover/Land Use (LC/LU), which LC/LU classification is tailored to the needs of biodiversity monitoring in a variable buffer zone of selected rivers (Strahler levels 2-9 derived from EU-Hydro) for the reference year 2012. LC/LU is extracted from Very High Resolution (VHR) satellite data and other available data in a buffer zone of selected rivers for supporting biodiversity monitoring and mapping and assessment of ecosystems and their services. The class definitions follow the pre-defined nomenclature on the basis of Mapping and Assessment of Ecosystems and their Services (MAES) typology of ecosystems (Level 1 to Level 4) and CORINE Land Cover. The classification provides 55 distinct thematic classes with a Minimum Mapping Unit (MMU) of 0.5 ha and a Minimum Mapping Width (MMW) of 10 m. The nomenclature has been revised in 2020 with the aim to harmonize the products of the local components (mainly Riparian Zones and NATURA 2000 products) while maintaining user requirements for both products. A revised version of the Riparian Zones 2012 has been subsequently released in December 2021, together with the reference year 2018. The production of the Riparian Zones products was coordinated by the European Environment Agency in the frame of the EU Copernicus programme.
-
These are the specific silviculture activities that took place within an opening in order to meet silviculture obligations after a disturbance. These activities may have been conducted over the entire opening or just a portion of the opening, and multiple activities may overlap. This database is the most current information available, but will be updated as new information is added. ACTIVITY_CATEGORY - This is the broad category of activity, such as disturbance, site preparation, planting, or survey. ACTIVITY_NAME - This is the specific activity that occurred in the opening. ACTIVITY_AREA - This is the measured within the opening that the activity occurred on. ACTIVITY_STATUS - This is the status of the activity which is either planned, started, or completed. ACTIVITY_COMPLETED_DATE - This is the date that the activity was finished. Distributed from [GeoYukon](https://yukon.ca/geoyukon) by the [Government of Yukon](https://yukon.ca/maps) . Discover more digital map data and interactive maps from Yukon's digital map data collection. For more information: [geomatics.help@yukon. ca](mailto:geomatics.help@yukon.ca)
-
Regional stream sediment geochemical data compilation November 2020 Release notes The regional stream sediment geochemical data compilation comprises data for more than 30 000 samples across Yukon. This compilation updates the work of Héon (2003). This new compilation includes results from the reanalysis of more than 24 000 samples; inductively coupled plasma mass spectrometry (ICPMS) analysis provides upgraded detection limits and a broader range of elements relative to previous analytical data. In addition to analytical data, efforts have been made to improve sample location accuracy. The data in this release are organized by analytical method with the geodatabase having six feature classes: 1. RGS_SITE_WATER - site specific physiography and water quality data. These data are unchanged from the original releases. 2. RGS_HEON - the same data as released in Héon (2003) with minor updates to sample location. 3. RGS_AAS - all samples analyzed by atomic absorption spectrometry. Most of these data are superseded by INAA and ICPMS data. 4. RGS_INAA - all samples analyzed by instrumental neutron activation analysis (INAA) and fire assay-neutron activation (FA-NA) analysis. 5. RGS_ICPMS - all samples analyzed by inductively coupled plasma mass spectrometry (ICPMS). 6. RGS_All - includes all AAS, INAA and ICPMS data. Collection of stream sediment samples in Yukon began in 1976 and ended in 2006. Three analytical methods have been used to analyze the minus 0.177 mm fraction (-80 mesh) of these samples: AAS, INNA (and FA-NA) and ICPMS. A simple description of each method is given below. For atomic absorption spectrometry (AAS) a 1 g aliquot is 'partially digested' using Lefort aqua regia or concentrated hot nitric acid. The digestion product is analyzed using an atomic absorption spectrometer. Oxide and silicate minerals are partially digested while some sulphide minerals are erratically volatilized. This means that AAS cannot be used to obtain accurate REE, Ta, Nb, As, Sb, Sn, Hg, Cr, or Au determinations. For instrumental neutron activation analysis ( INAA), aliquots of sieved sediment (the minus 0.177 mm fraction) or milled rock ranging from 5 to 40 g are encapsulated and irradiated in a nuclear reactor before counting the primary gamma radiation induced by the neutron irradiation with a high resolution germanium gamma ray detector. Fire assay-neutron activation (FA-NA) analysis is similar but includes a pre-concentration fire assay step prior to irradiation and analysis. Results for both INAA and FA-NA are similar to those for samples analyses by fusion or other total digestion techniques. Neutron activation detection limits are typically higher than those by acid digestion - ICPMS. Commodity and pathfinder elements such as Au, As, Sb and W have reasonable detection limits by INAA and the data generated are relatively precise. For ICPMS analysis, aliquots of sieved sediment ( the minus 0.177 mm fraction) ranging from 0.5 to 1 g are prepared using a partial digestion technique, typically aqua regia, followed by analysis of dissolution product by ICPMS. Sulphide minerals are completely oxidized and dissolved whereas most oxide and silicate minerals are only partially digested. This means that results produced by partial digestion methods are acceptable for elements such as Ag, As, Mo, Ni, Pb, Sb, Tl, and Zn but values for elements such as Al, Ba, Cr, Fe, P, Sn, Ti, Y, and Zr are likely to not reflect the actual element concentration in a sample. The sample size used for routine RGS sample analysis is too small be representative of Au in the original sample and thus Au by aqua regia digestion - ICPMS has poor precision. Further upgrades to this database are not anticipated. All samples that could be found in the GSC-Ottawa warehouse have been reanalyzed using ICPMS. Any errors or omissions in this database should be reported to the Yukon Geological Survey. Your feedback contributes to improving the accuracy of the geoscience databases for Yukon. Contact: [YGSMinerals@yukon.ca](mailto:YGSMinerals@yukon.ca) ; [geology@yukon.ca](mailto:geology@yukon.ca) Distributed from [GeoYukon](https://yukon.ca/geoyukon) by the [Government of Yukon](https://yukon.ca/maps) . Discover more digital map data and interactive maps from Yukon's digital map data collection. For more information: [geomatics.help@yukon.ca](mailto:geomatics.help@yukon.ca)
-
This feature delineates forest health disturbances which includes Abiotic and Biotic forest health agents in the Yukon at a scale of 1:100,000. It is a management level forest health overview survey (as opposed to an operational level) - meaning that analysis and mapping are most effective close to the 1:100,000 scale and not larger. This Forest Health Overview surveys has been completed in various stages: 1 ) Starting with mapping the disturbance type, and severity from the Air using Fix wing aircraft on to hardcopy 1:100,000 scale maps ; 2 ) Transfering the Data to a clean Mylar for scanning and digitizing ; and, 3 ) Scanning and digitizing and populate data into GIS spatial database . Distributed from [GeoYukon](https://yukon.ca/geoyukon) by the [Government of Yukon](https://yukon.ca/maps) . Discover more digital map data and interactive maps from Yukon's digital map data collection. For more information: [geomatics.help@yukon.ca](mailto:geomatics.help@yukon.ca)
-
This feature delineates forest and vegetation stands in the Yukon at a scale of 1:5,000. It is an operational level forest inventory (as opposed to a management level). This inventory has been completed in various stages, between 2013 and 2014, and delineation via softcopy from stereo images acquired in the years 2007 and 2012. The aerial images used for the Haines Junction region (Champagne and Aishihik Traditional Territory) had a ground sample distance (GSD) of 40 cm and were collected in both color and infrared. The aerial imagery in the southcentral Yukon were 1:40,000 black and white hard copy images, scanned at 60 microns or approximately 1m GSD. Distributed from [GeoYukon](https://yukon.ca/geoyukon) by the [Government of Yukon](https://yukon.ca/maps) . Discover more digital map data and interactive maps from Yukon's digital map data collection. For more information: [geomatics.help@yukon.ca](mailto:geomatics.help@yukon.ca)