 Arctic SDI catalogue
Government of Canada; Fisheries and Oceans Canada; Ecosystems and Ocean Science/Pacific Science/Ocean Science Division
Type of resources
Topics
Keywords
Contact for the resource
Provided by
Formats
Representation types
Update frequencies
status
-

Fisheries and Oceans Canada has conducted a cumulative human impact mapping analysis for Pacific Canada to support ongoing Marine Spatial Planning. Cumulative impact mapping (CIM) combines spatial information on human activities, habitats, and a matrix of vulnerability weights into an intuitive relative ‘cumulative impact score’ that shows where cumulative human impacts are greatest and least. To map cumulative impacts, a recently developed ecosystem vulnerability assessment for Pacific Canadian waters (Murray et al. 2022) was combined with spatial information on thirty-eight (38) different habitat types and forty-five (45) human activities following the methodology from Halpern et al.(2008) and Murray et al. (2015). The cumulative impact map is provided in a 1x1 km grid used for oceans management by Fisheries and Oceans Canada. For further information, please contact the data provider.
-
Description: Seasonal mean temperature from the British Columbia continental margin model (BCCM) were averaged over the 1993 to 2020 period to create seasonal mean climatology of the Canadian Pacific Exclusive Economic Zone. Methods: Temperatures at up to forty-six linearly interpolated vertical levels from surface to 2400 m and at the sea bottom are included. Spring months were defined as April to June, summer months were defined as July to September, fall months were defined as October to December, and winter months were defined as January to March. The data available here contain raster layers of seasonal temperature climatology for the Canadian Pacific Exclusive Economic Zone at 3 km spatial resolution and 47 vertical levels. Uncertainties: Model results have been extensively evaluated against observations (e.g. altimetry, CTD and nutrient profiles, observed geostrophic currents), which showed the model can reproduce with reasonable accuracy the main oceanographic features of the region including salient features of the seasonal cycle and the vertical and cross-shore gradient of water properties. However, the model resolution is too coarse to allow for an adequate representation of inlets, nearshore areas, and the Strait of Georgia.
-

This dataset contains the modelled and observed data used in the publication "Fjord circulation permits persistent subsurface water mass in a long, deep mid-latitude inlet" by Laura Bianucci et al., DFO Ocean Sciences Division, Pacific Region (published in the journal Ocean Science in 2024). An application of the Finite Volume Community Ocean Model (FVCOM v4.1) was run from May 24 to June 27, 2019 in the Discovery Islands region of British Columbia, Canada. Observed temperature and salinity profiles available in this area during this time period are included in the dataset, along with the modelled values at the same times and locations.
-

Description: Seasonal climatologies for Zooplankton biomass in seven size categories were calculated for the period 1990-2019. The data used were a subset of the Fisheries and Oceans Canada, Institute of Ocean Sciences Zooplankton Database. This dataset is incomplete and is regularly updated as analysis takes place. Methods: Data-Interpolating Variational Analysis (DIVA) was used for spatial. Seasonal averages were computed as the mean of yearly seasonal means. Spring months were defined as April to June, summer months were defined as July to September, fall months were defined as October to December, and winter months were defined as January to March. The data available here contain raster layers of seasonal Zooplankton climatology for the Canadian Pacific Exclusive Economic Zone (EEZ), with high spatial resolution of 1/300 degree. Uncertainties: Uncertainties are introduced when observational data are spatially interpolated to varying distances from the observation point. Climatological averages are calculated from these interpolated values. Caution should be used for data in inlets and nearshore as the interpolation does not perform well in these areas, data in some inlets have been masked.
-

Description: Seasonal climatologies for salinity of the Northeast Pacific Ocean were computed to cover the period 2001 to 2020. Historibal observations included all available conductivity-temperature_depth (CTD), bottle and profiling floats in the NODC World Ocean Database, Marine Environmental Data Services (MEDS), Institute of Ocean Sciences Water Properties website and the Canadian Integrated Ocean Observing System (CIOOS Pacific). Methods: Interpolation was carried out in up to fifty-two vertical levels from surface to 5000m. Data-Interpolating Variational Analysis (DIVA) was used for spatial interpolation for all years within each season and estimates projected onto a consistent grid. The average of the grid nodes was calculated to obtain the seasonal climatology. DIVA was used again on the final climatology followed by a median filter and a 5-point smoother. Spring months were defined as April to June, summer months were defined as July to September, fall months were defined as October to December, and winter months were defined as January to March. The data available here contain raster layers of seasonal salinity climatology for the Canadian Pacific Exclusive Economic Zone (EEZ), a subset of seasonal climatology of the Northeast Pacific Ocean, with high spatial resolution of 1/300 degree. Data Sources: NODC, MEDS, IOS and CIOOS Pacific Data. Uncertainties: Uncertainties are introduced when quality controlled observational data are spatially interpolated to varying distances from the observation point. Climatological averages are calculated from these interpolated values.
-

This data set is a generalized characterization of the offshore and inshore environments of Canada’s Pacific Ocean. Compiled from various sources to depict the biogenic habitats, pelagic habitats, and general bottom types such as offshore and inshore by depth strata.
-
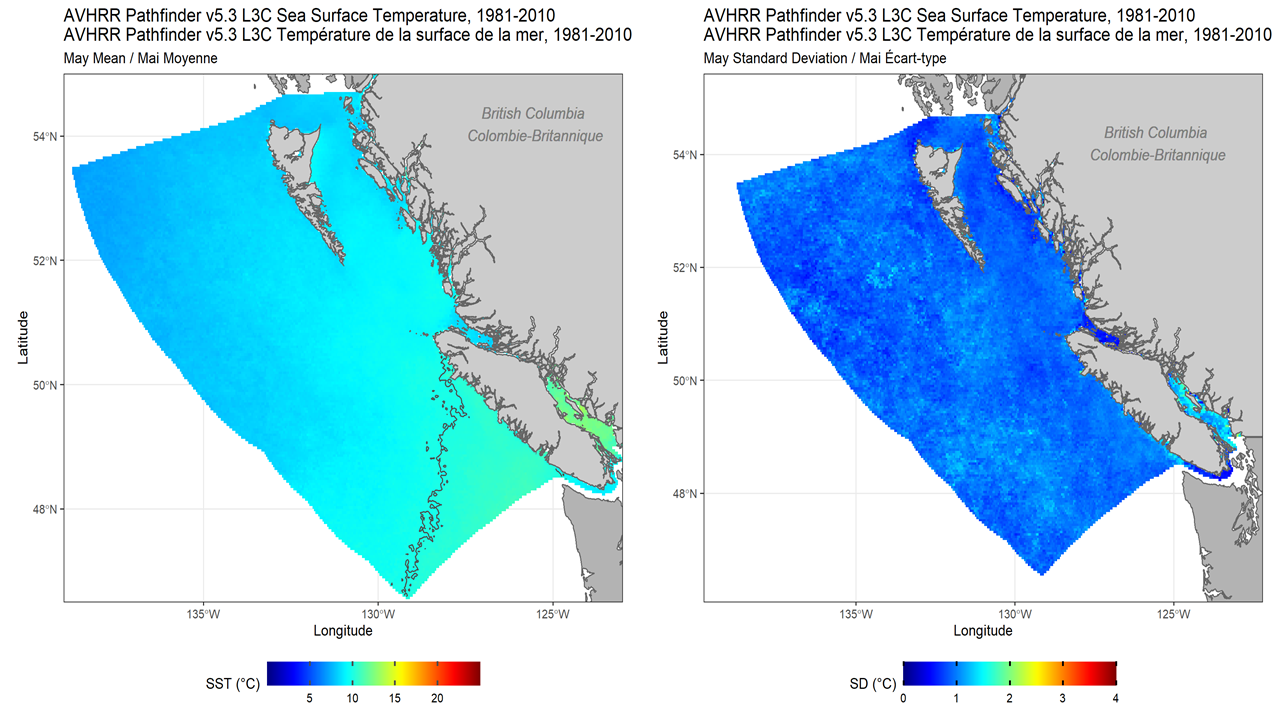
Description: Night-time sea surface temperature (SST) was acquired from the AVHRR Pathfinder project, with data distributed by NOAA, and averaged into monthly climatological composites. The data span late 1981 through 2010 at 4 km pixel resolution. Methods: AVHRR Pathfinder version 5.3 Level 3C night Sea Surface Temperature (SST) was acquired from NOAA at 4 km spatial resolution. The monthly mean value at all pixels was calculated for individual years, then all years were combined to produce final maps of monthly mean and monthly standard deviation of SST, and the number of occurrences of valid data at each pixel over the period of observation. The quality level of all satellite observations was also acquired with this dataset, and used to remove any pixels with a quality level lower than 4. Further, pixels with fewer than two occurrences over the period 1981-2010 were removed from these maps, and set to a NaN value in the tif files. All resulting rasters were cropped to the Canadian Exclusive Economic Zone and assigned to the NAD83 geographic coordinate reference system (EPSG:4269), and have a final pixel resolution of approximately 0.0417 degrees. The monthly mean, monthly standard deviation, and number of occurrences for all pixels are provided. Uncertainties: Satellite values have been evaluated against global datasets, and datasets of samples in the Pacific region (see references). However, uncertainties are introduced when averaging together images over time as each pixel has a differing number of observations. Short-lived or spatially limited events may be missed.
-
Description: This dataset consists of monthly mean simulation results from Canada's three Oceans: the Atlantic, Pacific and Arctic from 2015 to 2017. Abstract from the report: A numerical ocean model with biogeochemistry has been developed for a domain that spans Canada's three oceans: the Atlantic, Pacific and Arctic. The domain extends to 26°N in the Atlantic and 44°N in the Pacific, and spans the full width of each basin as well as the whole of the Arctic Ocean. The resolution is moderate to high (≈0.25°, 75 levels). A series of simulations was conducted to assess the best choices for biogeochemical model parameters across the diverse regions, using a variety of validation data sets including satellite ocean colour (surface chlorophyll and particulate organic carbon, integrated primary production), surface underway pCO2, and depth profiles of oxygen and nitrate concentration from ships and Argo floats. In addition to parameter values, processes examined include interactive sediments, fluvial nutrients, light attenuation by fluvial coloured dissolved organic matter (CDOM), and iron limitation. The results indicate that the optimal parameter set is one that limits phytoplankton losses to grazing and other processes so as to ensure strong biological drawdown of dissolved inorganic carbon and nutrients in spring and summer; among the parameter sets tested both insufficient and excessive drawdown were observed. Sensitivity to other processes such as interactive sediments, fluvial nutrients or CDOM attenuation was weak in most regions. In some regions, attenuation by CDOM or sequestration of nutrients in the sediment can substantially reduce primary production and zooplankton biomass, and fluvial nutrients can cause localized reduction of pCO2 by as much as 60 μatm. Iron limitation has an effect on the model solution in regions generally considered iron-replete; building a model that successfully spans iron-limited and non-iron-limited domains will require complete and accurate specification of iron sources and sinks.
-

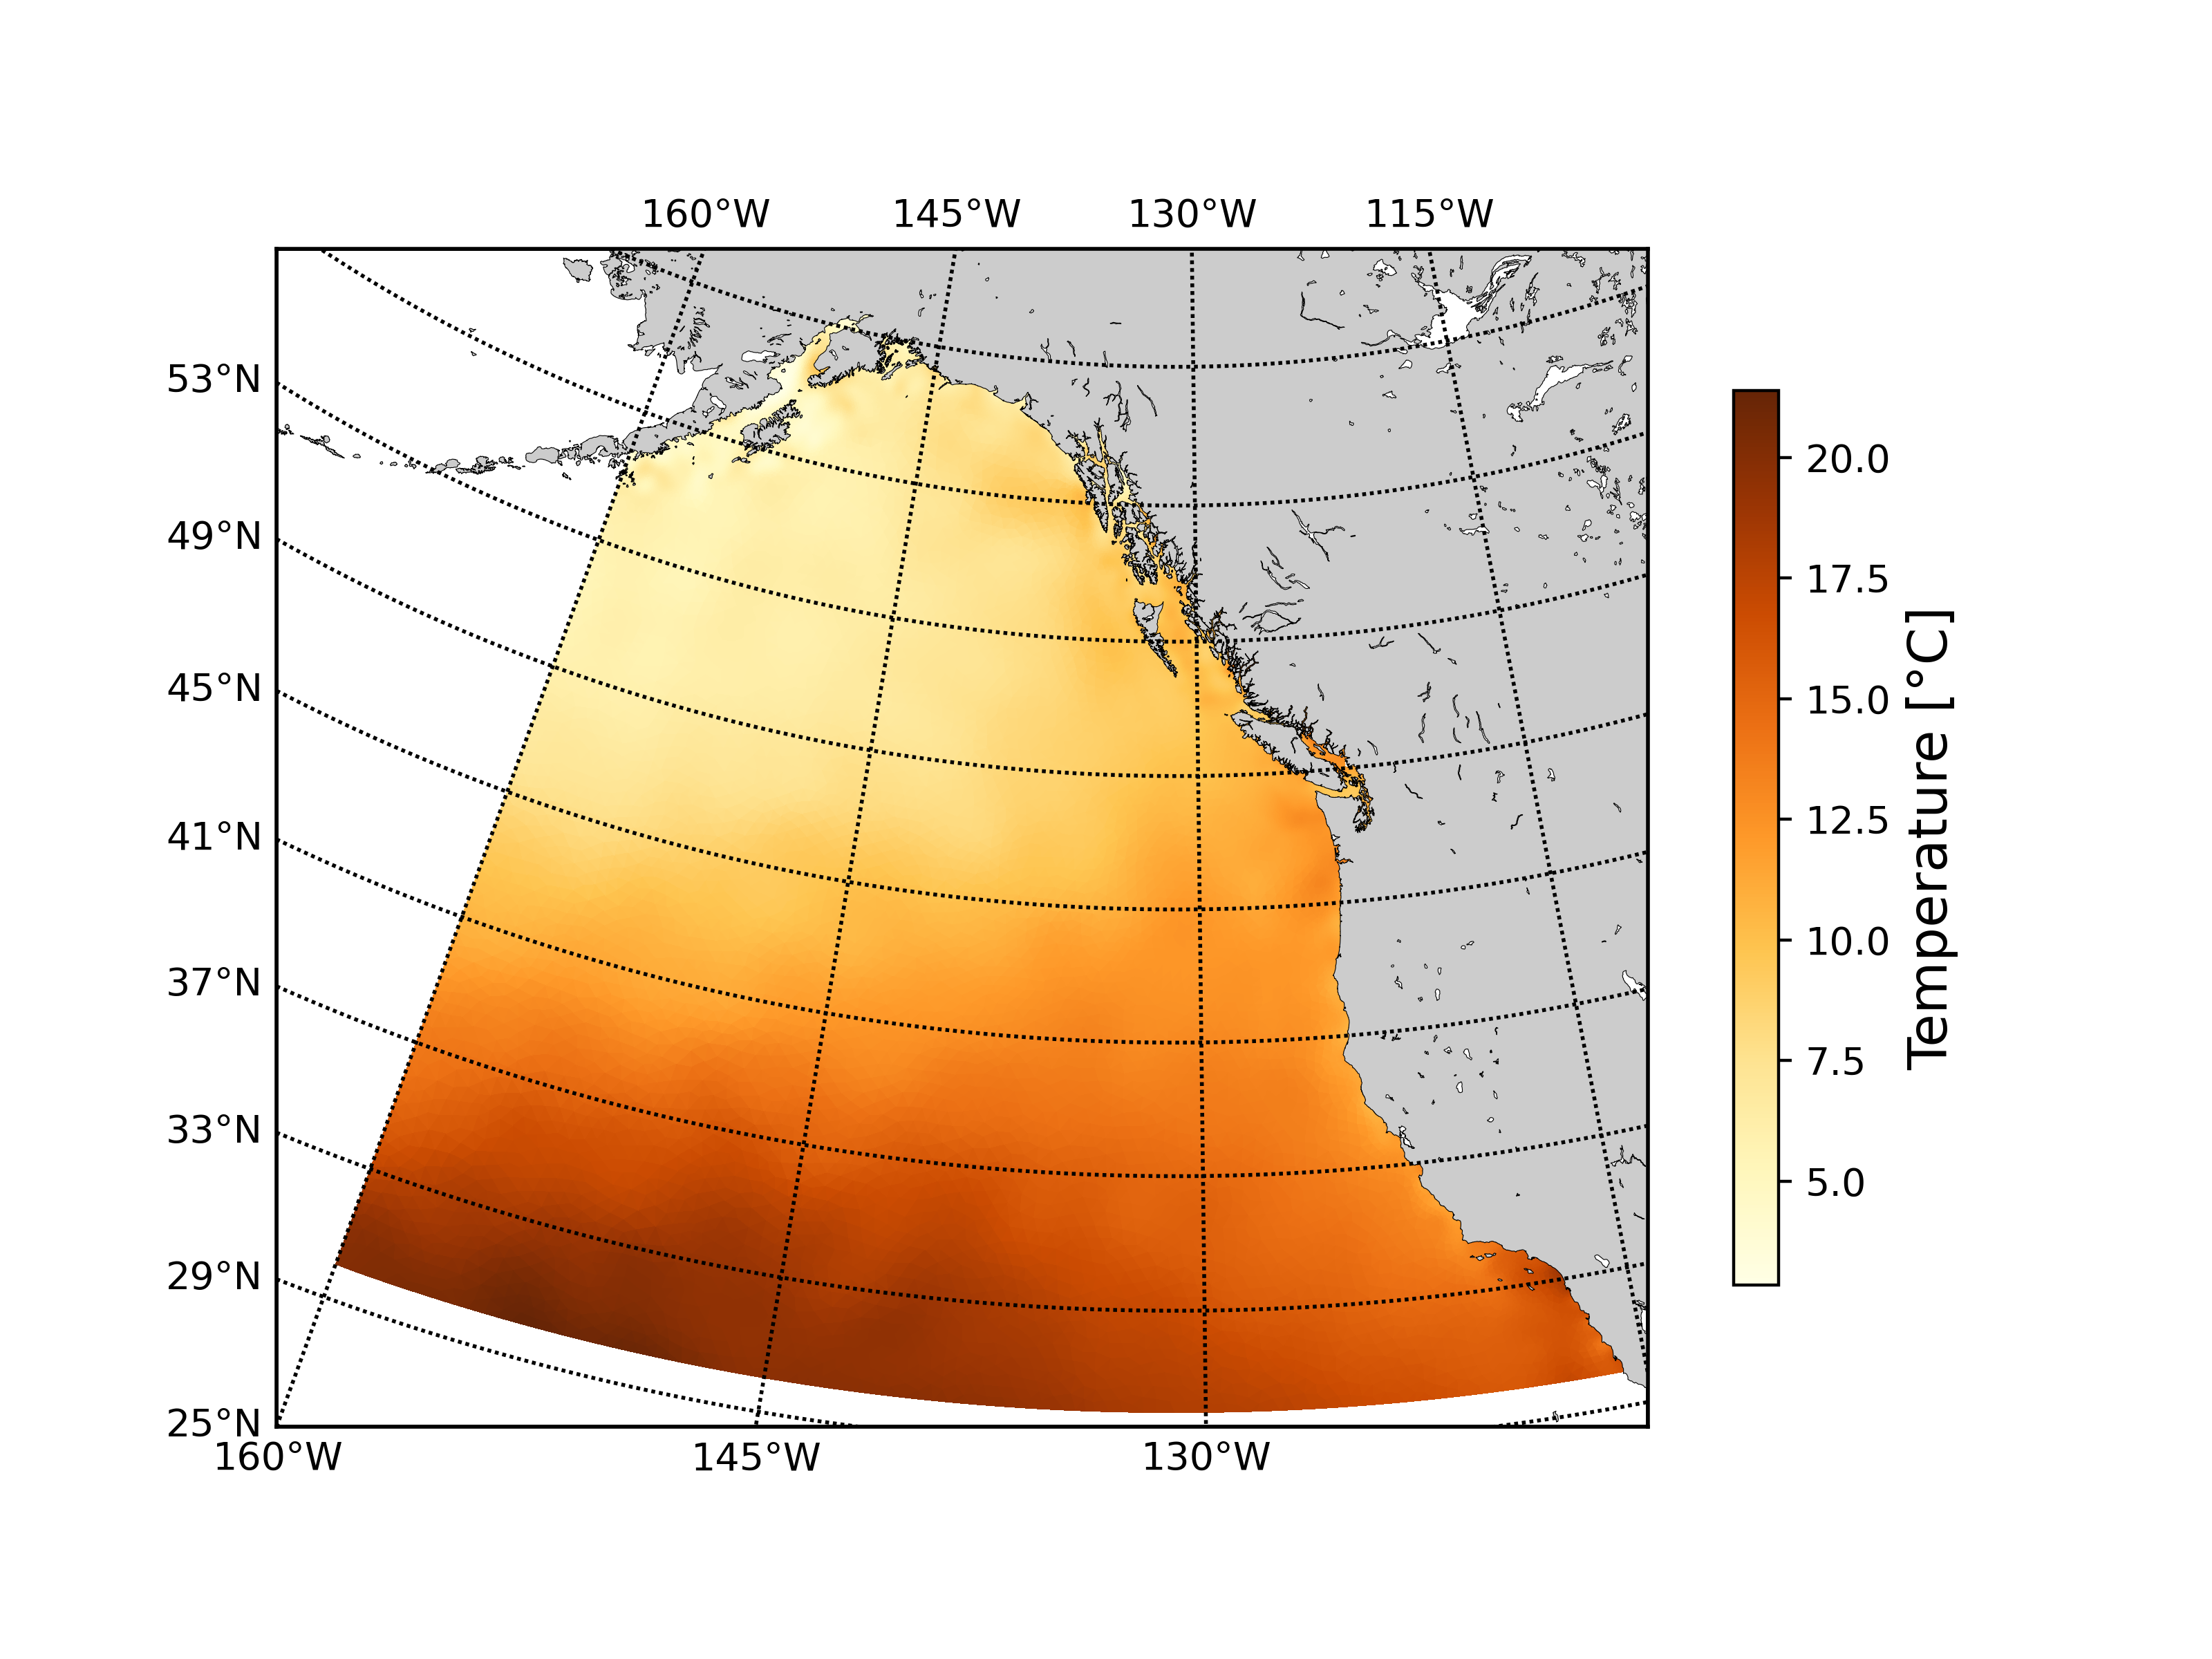
Description: Seasonal mean temperature from the British Columbia continental margin model (BCCM) were averaged over the 1981 to 2010 period to create seasonal mean climatology of the Canadian Pacific Exclusive Economic Zone. Methods: Temperatures at up to forty-six linearly interpolated vertical levels from surface to 2400 m and at the sea bottom are included. Spring months were defined as April to June, summer months were defined as July to September, fall months were defined as October to December, and winter months were defined as January to March. The data available here contain raster layers of seasonal temperature climatology for the Canadian Pacific Exclusive Economic Zone at 3 km spatial resolution and 47 vertical levels. Uncertainties: Model results have been extensively evaluated against observations (e.g. altimetry, CTD and nutrient profiles, observed geostrophic currents), which showed the model can reproduce with reasonable accuracy the main oceanographic features of the region including salient features of the seasonal cycle and the vertical and cross-shore gradient of water properties. However, the model resolution is too coarse to allow for an adequate representation of inlets, nearshore areas, and the Strait of Georgia.
-

Description: Night-time sea surface temperature (SST) was retrieved from the MODIS instrument on the Aqua satellite, with data distributed by the NASA Ocean Biology Processing Group, and averaged into monthly climatological composites. The data span the years 2003-2020; records were created at 1 km pixel resolution to be consistent with other satellite products. Methods: MODIS-Aqua night long-wave Sea Surface Temperature (SST) images were acquired from the NASA Ocean Biology Processing Group at processing Level-2 (version 2018), 1-km resolution, spanning the period 2003-01-01 to 2020-12-31. Image pixels were aligned and mapped to a regular grid using the SeaDAS program, retaining all pixels with a quality level of ‘1’ or lower, which is recommended for scientific analysis. The monthly mean value at all pixels was calculated for individual years, and used to produce maps of the monthly climatological mean and standard deviation of SST. Additionally, the number of occurrences of valid data at each pixel over the period of observation were calculated. Pixels with fewer than two occurrences over the entire period of observation were removed from these maps, and set to a NaN value in the tif files. A few small gaps between pixels (near the edges of individual images) were filled using the median value of surrounding pixels, provided there were greater than 4 values. Finally, all rasters were cropped to the Canadian Exclusive Economic Zone and assigned to the NAD83 geographic coordinate reference system (EPSG:4269), and have a final pixel resolution of approximately 0.01 degrees. The monthly mean, monthly standard deviation, and number of occurrences for all pixels are provided. Data Sources: NASA Ocean Biology Processing Group. (2017). MODIS-Aqua Level 2 Ocean Color Data Version R2018.0. NASA Ocean Biology Distributed Active Archive Center. https://doi.org/10.5067/AQUA/MODIS/L2/OC/2018 Uncertainties: Satellite values have been evaluated against global datasets, and datasets of samples in the Pacific region (see references). However, uncertainties are introduced when averaging together images over time as each pixel has a differing number of observations. Short-lived or spatially limited events may be missed.