 Arctic SDI catalogue
XLSX
Type of resources
Available actions
Topics
Keywords
Contact for the resource
Provided by
Formats
Representation types
Update frequencies
status
Scale
-

Zero Emission Vehicle Infrastructure Program (ZEVIP) and Electric Vehicle and Alternative Fuel Infrastructure Deployment Initiative (EVAFIDI) qualitative, quantitative, and geographic data set derived from the program database. This data defines the project number, the number of chargers, the name of the promoter, the type of connector, the address, the city, the province, the postal code, the geographical coordinates, the status, the opening date, and the type of contribution agreement for each project funded by the program. The Canada Infrastructure Bank’s (CIB) Charging and Hydrogen Refuelling Infrastructure Initiative (CHRI) aims to reduce transportation sector greenhouse gas emissions by accelerating the private sector’s rollout of large-scale ZEV chargers and hydrogen refuelling stations, helping to spur the market for private investment. Through this initiative, the CIB has dedicated a minimum of $500 million to support the federal government’s goals as part of Canada’s 2030 Emissions Reduction Plan. Technology funding current to April 1 2025.
-

The Canadian Nuclear Safety Commission (CNSC) is publishing a database with environmental monitoring results collected as part of the Eastern Athabasca Regional Monitoring Program. The samples are collected near communities located in northern Saskatchewan.
-
Understanding how bird populations are spatially structured throughout their annual cycles is critical to identifying when and where these populations are most limited. Canadian breeding populations of Horned Grebe (Podiceps auritus cornutus; hereafter grebe) appear to have substantially declined since 1970, and uncertainty in annual movements of this species limits our understanding of factors affecting their population dynamics. To address this knowledge gap and identify grebes’ migration routes and non-breeding areas, we fit light-level geolocators and sampled feathers for stable isotopes (carbon δ13C, nitrogen δ15N, hydrogen δ2H) in Prairie and Boreal portions of the grebe breeding range between 2020 and 2023. Geolocator data (n = 18 birds) indicated that grebes undertook southeastern fall migratory movements and occupied marine and freshwater non-breeding locations across a large geographic area including southeastern Canada, the Midwest and southern United States, the Atlantic Coast, and the Gulf of Mexico. Geolocator and feather stable isotope data confirmed weak migratory connectivity and separated birds into four distinct non-breeding ground clusters. Our results suggest threats that grebes experience on non-breeding areas may have diffuse effects on breeding populations and further provide novel information on the migration ecology and spatial linkages of two breeding populations of grebes in North America. Taken together, these findings will help to inform development and implementation of management strategies for this species of conservation concern.
-
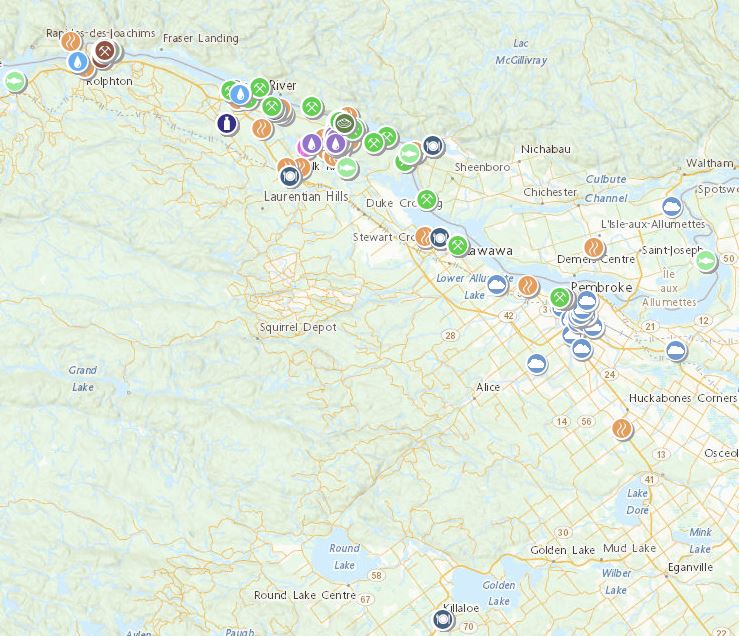
The Canadian Nuclear Safety Commission (CNSC) and Environment and Climate Change Canada (ECCC) are publishing databases with effluent and environmental monitoring results from nuclear facilities located along the Ottawa River watershed as part of the Regional Information and Monitoring Network (RIMNet) for the Ottawa River Watershed Basin initiative. The facilities included are Chalk River Laboratories, Nordion Canada Inc., SRB Technologies Canada Inc., and Nuclear Power Demonstration Waste Facility. The initiative was developed to address questions and concerns expressed by members of the public and Indigenous Nations and communities about the availability of publicly accessible environmental monitoring data in the Ottawa River Watershed Basin. More information about the initiative is available here: https://www.cnsc-ccsn.gc.ca/eng/resources/environmental-protection/rimnet/ This dataset contains effluent and environmental monitoring results from Chalk River Laboratories, Nordion Canada Inc., SRB Technologies Canada Inc., and Nuclear Power Demonstration Waste Facility. All of the effluent and emissions releases to the environment in this dataset are below the CNSC licensed release limits. All of the environmental monitoring results in this dataset are below environmental quality guidelines. More information about CNSC staff’s assessment of these facilities are found in CNSC staff’s regulatory oversight reports: https://www.cnsc-ccsn.gc.ca/eng/resources/publications/reports/regulatory-oversight-reports/
-
Fleming Survey of Juvenile Atlantic Cod in Coastal Avalon and Northeast Newfoundland (NAFO Div. 3KL)

The Department of Fisheries established a survey of demersal juvenile Atlantic cod (*Gadus morhua*) in the nearshore (<10 m deep) in 1959. This survey aimed to characterize the distribution and abundance of juvenile Atlantic cod and was based upon Norway's Flodevigen sampling program which has been conducted continuously since 1919. A 25 m seine was used to sample juvenile Atlantic cod nursery locations on the Avalon Peninsula and Northeast coast of the island of Newfoundland in September and October. The survey continued until 1964 and became known as the Fleming survey, after original initiator Alistair Fleming. The survey was reinstated by Memorial University of Newfoundland from 1992 to 1997. Multiple tows were conducted at a subset of the original 55 Fleming sites located in St. Mary's Bay, Trepassey Bay, the Southern Shore, Conception Bay, Trinity Bay, Bonavista Bay, Gander Bay, New World Island, Fortune Harbour, Badger Bay, Halls Bay and Green Bay. This data set includes several different subsets, some of which span both Fleming Survey periods (1959-1964 and 1992-1997): I. JuvCodCatch60s90s: Catches of juvenile Atlantic cod (1959-1964, 1992-1997) from the first two consecutive tows at each site. This is a summary based on JuvCodLengths90s and FlemingSurveyData60s; II. JuvCodLength90s: Lengths of all individual juvenile Atlantic cod caught for each site (1992-1997); III. SiteEnvData60s90s: Station data for Fleming data 1992-1997; IV. FlemingSurveyData60s: Fleming survey data from 1959-1964 (note there are three record types pertaining to: station data "type 1"; general species catch data including juvenile Atlantic cod grouped by age class ("1+", "Zeroes", and "Total") "type 2; and juvenile Atlantic cod (species 223) listed in length bins "type 3"; and V. FlemingBycatch60s92to96: Bycatch data from 1959-1964 & 1992-1996 from first two tows at each site. This is a summary based partly on the FlemingSurveyData60s set.
-

This dataset includes daily averages of solar irradiance on tilted surfaces for all of Canada based on the period of 1998 - 2020. The solar irradiance data is available in the following layers at a resolution of about 0.1°x0.1° (~10 km grid spacing) for all of Canada (i.e., 41.6 to 83.1°N, and 52.6 to 141.0°W): - Four fixed tilts, relative to the horizontal plane, of 0° (horizontal), 30°, 60°, and 90° (vertical) - Three fixed tilts, relative to the local latitude 0°, +15°, and -15° - A two-axis tracking surface For each tilt angle, the irradiance values are in kWh/m2 (per day) for the selected time period. The data can be viewed as a map service and by downloading the tabular data included. Refer to the supporting documentation and dataset for more information.
-
The Government of Canada leads or supports a variety of initiatives that involve monitoring, assessing or managing cumulative effects. This record contains information about cumulative effects initiatives that are taking place across Canada. 16 federal departments and agencies that are involved in cumulative effects and related work were surveyed and 388 initiatives were collected. Each entry includes: • a description of the initiative • information about its location, partners involved, relevant industries, and overarching or related initiatives • links to further information or related Open Data sources
-

PURPOSE: To provide a permanent repository of key data series necessary to build a range-wide American eel stock assessment. DESCRIPTION: This collection presents data associated with the following report: Cairns, D.K. 2020. Landings, abundance indicators, and biological data for a potential range-wide American eel stock assessment. Canadian Data Report of Fisheries and Aquatic Science. No. 1311: v + 180 pp. Much of the data collection is from the Atlantic Provinces of Canada, particularly the Southern Gulf of St. Lawrence. The collection also includes data from elsewhere in the American eel's range in Canada, and also the United States and the Caribbean Basin. Files in the collection are as follows. Cairns2020_AnnexA_ReportTables.xlsx: This Excel file (file size 756 kb) contains all 37 tables in Cairns (2020) exactly as they appear in the report. Cairns2020_AnnexB_EelLengthsAgesEfishingRecords.xlsx: This Excel file (file size 3.1 mb) contains 20,047 records of American eel lengths and other biological data from the Canadian Atlantic Provinces, 1983-2017. Records include weights of 8,915 eels and ages of 2,212 eels. Records of 3,224 electrofishing sessions in the Miramichi River, New Brunswick, 1952-2019, and records of 2,590 electrofishing sessions in the Restigouche River, New Brunswick, 1972-2019 are included. Cairns2020_AnnexC_EelLengthsAgesDataDefinitions.csv: This .csv file (file size 4 kb) gives data definitions in English and French for the table of eel lengths and other biological data that is contained in Cairns2020_AnnexB_EelLengthsAgesEfishingRecords.xlsx and in Cairns2020_AnnexD_EelLengthsAges.csv. Cairns2020_AnnexD_EelLengthsAges.csv: This file (file size 2.0 mb) presents in .csv format the table of eel lengths and other biological data that is also presented in Cairns2020_AnnexB_EelLengthsAgesEfishingRecords.xlsx. Cairns2020_AnnexE_EelEFishingDataDefinitions.csv: This .csv file (file size 2 kb) gives data definitions in English and French for the table of eel electrofishing data that is contained in Cairns2020_AnnexB_EelLengthsAgesEfishingRecords.xlsx and in Cairns2020_AnnexD_EelLengthsAges.csv. Cairns2020_AnnexF_EelEFishing.csv: This file (file size 314 kb) presents in .csv format the table of eel electrofishing data that is also presented in Cairns2020_AnnexB_EelLengthsAgesEfishingRecords.xlsx. Cairns2020_AnnexG_OtolithImageMetadata.csv: This .csv file (file size 2 kb) provides metadata for the collection of eel otolith images. Files with names starting with EelOtos . . . . : These .tif, .jpg, and .bmp image files are in zipped format with a summed size of 5.3 gb. The files give magnified photos of 1,838 eel otoliths that have been prepared for age reading. Samples are from the Atlantic Provinces of Canada. Individual otolith codes in Cairns2020_AnnexB_EelLengthsAgesEfishingRecords.xlsx and in Cairns2020_AnnexC_EelLengthsAgesDataDefinitions.csv match the codes embedded in otolith image filenames. PARAMETERS COLLECTED: American eel landings, number caught, and effort of commercial and research fishing gear. American eel lengths, ages, sex and other biological data and sampling locations. NOTES ON QUALITY CONTROL: All keypunched records of landings, densities, and other data were verified against original sources. Landings and abundance indices were reviewed in a Department of Fisheries and Oceans scientific workshop and corrected as necessary. Length and age data were examined by length-weight and length age plots and implausible records were discarded. PHYSICAL SAMPLE DETAILS: No physical samples SAMPLING METHODS: Landings are from government fisheries agencies. Abundance indices are from commercial fyke, spear, and trap catch per unit effort, and from research ladder counts and electrofishing records. Mean elver lengths are compiled from published literature Sex ratios are compiled from published literature Locations of biological and genetic sampling are compiled from published literature American eel lengths are total length of live specimens. Ages are from otolith annulus readings Electrofishing records are from backpack electrofishing surveys in wadeable waters USE LIMITATION: To ensure scientific integrity and appropriate use of the data, we would encourage you to contact the data custodian.
-

Since 2005, Fisheries and Oceans Canada has been collecting monitoring data for aquatic invasive species (e.g. https://open.canada.ca/data/en/dataset/8d87f574-0661-40a0-822f-e9eabc35780d, https://open.canada.ca/data/en/dataset/503a957e-7d6b-11e9-aef3-f48c505b2a29, https://open.canada.ca/data/en/dataset/8661edcf-f525-4758-a051-cb3fc8c74423). This monitoring data, as well additional occurrence information from online databases and the scientific literature, have been paired with high resolution environmental data and oceanographic models in species distribution models that predict the present-day and future potential distributions of 12 moderate to high risk invasive species on Canada’s east and west coasts. Future distributions were predicted for 2075, under Representative Concentration Pathway 8.5 from the Intergovernmental Panel on Climate Change’s fifth Assessment Report. Present-day and future richness of these species (i.e., hotspots) has also been estimated by summing their occurrence probabilities. This data set includes the occurrence locations of each species, the present-day and future species distribution modeling results for each species, and the estimated species richness. This research has been published in the scientific literature(Lyons et al. 2020). Lyons DA, Lowen JB, Therriault TW, Brickman D, Guo L, Moore AM, Peña MA, Wang Z, DiBacco C. (In Press) Identifying Marine Invasion Hotspots Using Stacked Species Distribution Models. Biological Invasions Cite this data as: Lyons DA., Lowen JB, Therriault TW., Brickman D., Guo L., Moore AM., Peña MA., Wang Z., DiBacco C. Data of: Species distribution models and occurrence data for marine invasive species hotspot identification. Published: November 2020. Coastal Ecosystems Science Division, Fisheries and Oceans Canada, Dartmouth, N.S. https://open.canada.ca/data/en/dataset/1bbd5131-8b34-4245-b999-3b4c4259d74f
-

In 2012 and 2013, Fisheries and Oceans Canada surveyed the benthos in two areas closed to bottom contact fishing, the Narwhal Overwintering and Coldwater Coral Zone (now the Disko Fan Conservation Area, DFCA), and the Hatton Basin Voluntary Coral Protection Zone (now the Hatton Basin Conservation Area, HBCA). Samples were collected following protocols recommended by the Arctic Council’s Circumpolar Biodiversity Monitoring Plan for the purposes of providing baseline data for future monitoring of benthic invertebrates in this sensitive region, and for facilitating pan-Arctic comparisons of benthic communities. Five biodiversity monitoring stations were established, four in the DFCA and one in the HBCA, each of which was fully sampled according to those protocols with Van Veen grabs or box corers, drop cameras and temperature recorders attached to the gear. This report summarises the grab/core-sampled benthic fauna collected during the 2012 survey of the Conservation Areas and complements another report documenting the epibenthos from the camera transects in the DFCA. Here we report on macrofauna in the 1-cm size fraction, and on foraminiferan meiofauna. The data provided is presented in the following report (see related link) : Jacobs, K., Bouchard Marmen, M., Rincón, B., MacDonald, B., Lirette, C., Gibb, O., Treble, M., and Kenchington, E. 2022. Biodiversity Monitoring Stations for Benthic Macrofauna and Meiofauna in the Disko Fan and Hatton Basin Conservation Areas. Can. Tech. Rep. Fish. Aquat. Sci. 3487: vi + 86 p. Cite this data as: Bouchard Marmen, Marieve; Rincon, Beatriz ; MacDonald, Barry; Lirette, Camille; Gibb, Olivia; Treble, Margaret ; Jacobs, Kevin; Kenchington, Ellen (2022). Biodiversity Monitoring Stations for Benthic Macrofauna and Meiofauna in the Disko Fan and Hatton Basin Conservation Areas. Published January 2023. Ocean Ecosystems Science Division, Fisheries and Oceans Canada, Dartmouth, N.S. https://open.canada.ca/data/en/dataset/b7bcff18-698b-4d40-a7bd-13d39925cbeb