 Arctic SDI catalogue
Artificial intelligence
Type of resources
Available actions
Topics
Keywords
Contact for the resource
Provided by
Formats
Representation types
Update frequencies
status
-

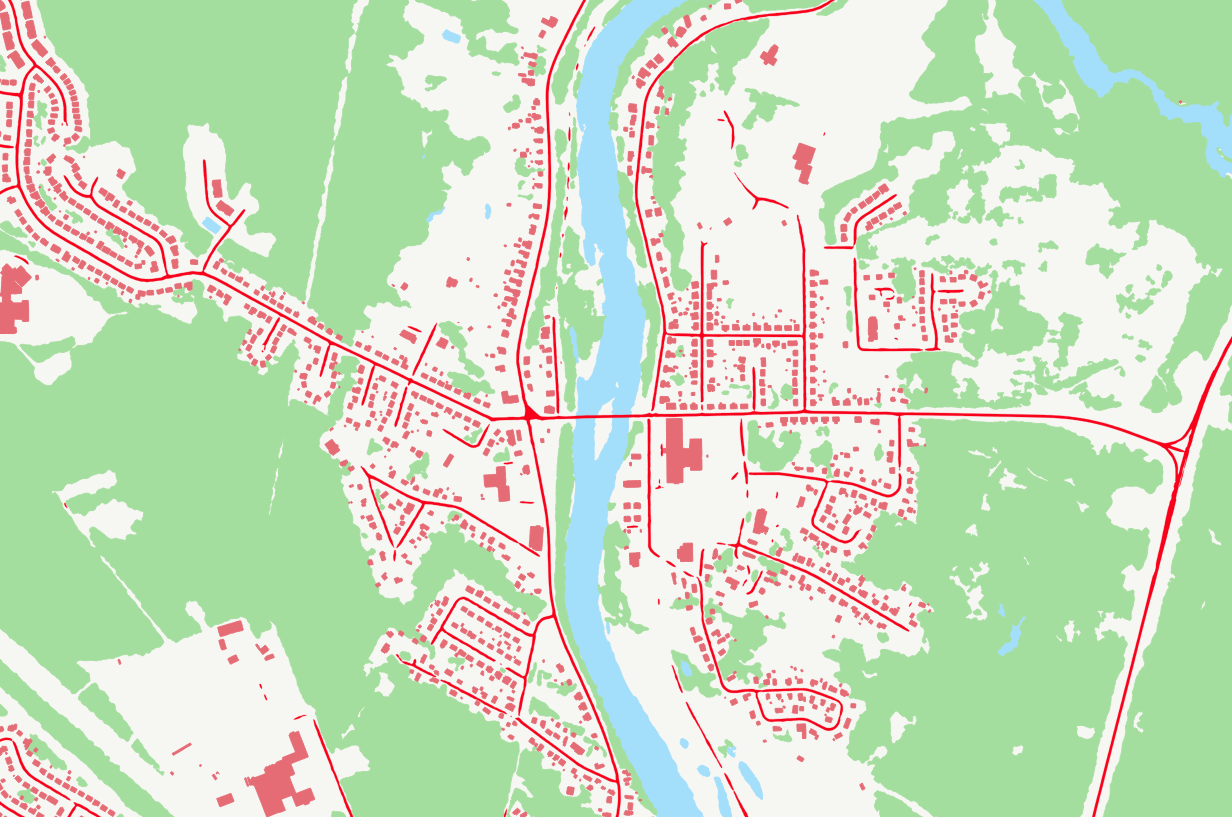
Temporal analysis of changes in Quebec city based on GeoAI features automatically extracted from satellite images acquired in 2006 and 2022. Simple geospatial analysis enables the detection of features present in 2022 that were not already there in 2006. The addition of new buildings is a good indicator of urban development and/or sprawl. GeoAI enables temporal coverage of various areas in Canada, thus providing a useful tool for change detection and trend analysis at high resolution. While the series is still fairly new, and such examples are limited for the time being, NRCan strives to gradually increase its GeoAI data offering for both spatial and temporal coverage. For more information about the GeoAI - GeoBase Series, please visit the following link: https://open.canada.ca/data/en/dataset/74738ff5-5367-5958-9aee-98fffdcd1876
-
GeoAI are buildings, hydrography, forests, and roads automatically extracted using Deep Learning models applied to a source dataset, typically aerial or satellite images. The primary aim of GeoAI is to increase Canada's availability of high-resolution foundational geospatial data for both spatial and temporal coverage. The infrastructure and expertise put in place by NRCan enables a rapid, efficient, and scalable data creation process through the use of leading-edge technology and Artificial Intelligence models. Published datasets for a given source can be revisited at a later date as more accurate models are developed and put into production. For now, only static files are available, but as the series develops, new products and services will be added.
-
The Global Environmental eMuLator (GEML) is a component of the experimental Global Deterministic Prediction System (GDPS) and is an artificial intelligence (AI)-based weather emulator trained on past atmospheric states. More specifically, this GEML model is based on data compatible with the ¼°, 13-level version of the GraphCast model (Lam et al. 2023) from DeepMind. It was trained and refined by ECCC, using ECMWF's ERA5 data (1979-2016) and operational analyses (2016-2021). The weights have been recalculated and are also available to the public. Forecasts are carried out twice daily, each with a 10-day lead time. It generates the reference large-scale temperature and horizontal wind fields, toward which GDPS's GEM forecasts are spectrally nudged. The geographical coverage is global with a horizontal resolution of 28 km. Data is available on 13 pressure levels, and employs a uniform latitude-longitude grid with 0.25-degree grid resolution. Six atmospheric variables defined on the 13 pressure levels, along with 4 surface variables are available every 6 hours.
-

Temporal analysis of changes in Trois-Rivières, Québec, based on GeoAI features automatically extracted from satellite images acquired in 2013 and 2021-22. Simple geospatial analysis intersecting Statistics Canada's Open Database of Buildings, version 3 (ODB v3) with GeoAI multidate building features enables the detection of buildings observed in 2021-22 that were not detected in 2013. The addition of new buildings is a good indicator of urban development and/or sprawl. GeoAI enables temporal coverage of various areas in Canada, thus providing a useful tool for change detection and trend analysis at high resolution. While the series is still fairly new, and such examples are limited for the time being, NRCan strives to gradually increase its GeoAI data offering for both spatial and temporal coverage. For more information about the GeoAI - GeoBase Series, please visit the following link: https://open.canada.ca/data/en/dataset/74738ff5-5367-5958-9aee-98fffdcd1876
-

Temporal analysis of changes in the Iqaluit region, Nunavut, based on GeoAI features automatically extracted from satellite images acquired in 2012 and 2022. Simple geospatial analysis intersecting GeoAI multidate building features enables the detection of buildings observed in 2022 that were not detected in 2012. The addition of new buildings is a good indicator of urban development and/or sprawl. GeoAI enables temporal coverage of various areas in Canada, thus providing a useful tool for change detection and trend analysis at high resolution. While the series is still fairly new, and such examples are limited for the time being, NRCan strives to gradually increase its GeoAI data offering for both spatial and temporal coverage. For more information about the GeoAI - GeoBase Series, please visit the following link: https://open.canada.ca/data/en/dataset/74738ff5-5367-5958-9aee-98fffdcd1876
-

Temporal analysis of changes for Victoria, British Columbia, based on GeoAI features automatically extracted from satellite images acquired in the 2000s, 2010s and 2020s. Simple geospatial analysis intersecting Statistics Canada's Open Database of Buildings, version 3 (ODB v3) with GeoAI multidate building features enables the detection of buildings observed in the 2000s, 2010s and 2020s. The addition of new buildings is a good indicator of urban development and/or sprawl. Using the same approach, GeoAI multidate roads enable the detection of Statistics Canada's National Roads Network (NRN) segments present in the 2000s, 2010s and 2020s. The development of new roads is also indicator of urban development and/or sprawl. Complementarily, an analysis of changes in the forest coverage from the GeoAI datasets is done between the 2000s and the 2020s. This analysis reflects the gains and losses between both dates. GeoAI enables temporal coverage of various areas in Canada, thus providing a useful tool for change detection and trend analysis at high resolution. While the series is still fairly new, and such examples are limited for the time being, NRCan strives to gradually increase its GeoAI data offering for both spatial and temporal coverage. For more information about the GeoAI - GeoBase Series, please visit the following link: https://open.canada.ca/data/en/dataset/74738ff5-5367-5958-9aee-98fffdcd1876
-

Temporal analysis of changes in Winnipeg, Manitoba, based on GeoAI features automatically extracted from satellite images acquired in 2013 and 2023. Simple geospatial analysis enables the detection of features present in 2023 that were not already there in 2013. The addition of new buildings is a good indicator of urban development and/or sprawl. Complementarily, an analysis of changes in the forest coverage from the GeoAI datasets is done. This analysis reflects the gains and losses between both dates. GeoAI enables temporal coverage of various areas in Canada, thus providing a useful tool for change detection and trend analysis at high resolution. While the series is still fairly new, and such examples are limited for the time being, NRCan strives to gradually increase its GeoAI data offering for both spatial and temporal coverage. For more information about the GeoAI - GeoBase Series, please visit the following link: https://open.canada.ca/data/en/dataset/74738ff5-5367-5958-9aee-98fffdcd1876
-

Temporal analysis of changes in Calgary, Alberta, based on GeoAI features automatically extracted from satellite images acquired in 2011 and 2021. Simple geospatial analysis intersecting Statistics Canada's Open Database of Buildings, version 3 (ODB v3) with GeoAI multidate building features enables the detection of buildings observed in 2021 that were not detected in 2011. The addition of new buildings is a good indicator of urban development and/or sprawl. Using the same approach, GeoAI multidate roads enable the detection of Statistics Canada's National Roads Network (NRN) segments present in 2021 and/or in 2011. The development of new roads is also indicator of urban development and/or sprawl. Complementarily, an analysis of changes in the forest coverage from the GeoAI datasets is done. This analysis reflects the gains and losses between both dates.. GeoAI enables temporal coverage of various areas in Canada, thus providing a useful tool for change detection and trend analysis at high resolution. While the series is still fairly new, and such examples are limited for the time being, NRCan strives to gradually increase its GeoAI data offering for both spatial and temporal coverage. For more information about the GeoAI - GeoBase Series, please visit the following link: https://open.canada.ca/data/en/dataset/74738ff5-5367-5958-9aee-98fffdcd1876
-

This geographic reference system shows the mapping of land occupancy in Quebec. Land use is defined as physical and biological land cover. It includes artificial surfaces, agricultural areas, forests, forests, semi-natural areas, wetlands, and water bodies. This map covers the territory of southern Quebec and will be extended to northern regions in a later version. The data is generated by a semi-automated classification of high-resolution satellite images, which makes it possible to more accurately identify types of land use. Mapping is available in a unified matrix format. A metadata index as well as a [user guide] (https://diffusion.mern.gouv.qc.ca/diffusion/RGQ/Imagerie/COTQ/Documentation/guide-utilisation.pdf) presenting the data structure and land use classes are available to users.**This third party metadata element was translated using an automated translation tool (Amazon Translate).**
-
The data presented on this page concern the 2013-2014 mapping of temperature differences, the classification maps of these temperature differences (i.e. urban heat and freshness islands) and the map of the urban heat island intensity index. These different maps are detailed below: - The map of __Temperature differences in °C__ represents the temperature difference in the city compared to a nearby forest. It was produced at the scale of the Quebec ecumene (2016 census, 167,764 km2). This mapping, provided on a grid with a spatial resolution of 15 m, was carried out with a predictive machine learning model built on Landsat-8 satellite data provided by the *United States Geological Survey (USGS) * as well as from other geospatial variables such as hydrography and topography. - The mapping of surface temperature difference classes, i.e. __Urban Heat and Cool Islands (ICFU) __ was carried out for * [population centers of the 2021 census] (https://www150.statcan.gc.ca/n1/pub/92-195-x/2021001/geo/pop/pop-fra.htm) * (CTRPOP) with at least 1,000 inhabitants and a density of at least 400 inhabitants per km2 to which is added a buffer zone of 2 km. It thus covers all major urban centers, i.e. 14,072 km2. The method for categorizing ICFUs is the ranking of predicted temperature differences for each population center into 9 levels. Classes 8 and 9 are considered __Urban Heat Islands__ and classes 1, 2 and 3 as __Urban Fresh Islands__. The interval values for each class and population center are shown in the production metadata file. Since surface temperatures were analyzed at the Quebec ecumene scale, but the classification intervals were calculated for each population center individually, the temperature differences grouped into the different classes vary from region to region. Thus, there are differences observed in the predicted temperature differences between North and South Quebec and according to urban realities. For example, a temperature difference of 2°C may be present in class 1 (cooler) in a population center located in southern Quebec, but may be present in class 9 (very hot) in a population center in northern Quebec. It is therefore important to interpret the identification of heat islands in relation to the relative temperature difference data produced at the Quebec ecumene scale. - The __Urban Heat Island Intensity Index (SUHII) map __ represents the Surface Urban Heat Island Intensity Index (SUHII). This index is calculated for each * [dissemination island] (https://www150.statcan.gc.ca/n1/pub/92-195-x/2021001/geo/db-id/db-id-fra.htm) * (ID) of Statistics Canada included in the * [2021 census population centers] (https://www150.statcan.gc.ca/n1/pub/92-195-x/2021001/geo/pop/pop-fra.htm) * (CTRPOP) * () * (CTRPOP). It highlights areas with higher heat island intensity, by calculating a weighted average from temperature difference classes, giving more weight to the hottest classes. This weight is proportional to the class number (e.g. a class 9 surface is 9 times more important in the index than the same area with a class 1). These maps as well as those of * [2020-2022] (https://www.donneesquebec.ca/recherche/dataset/ilots-de-chaleur-fraicheur-urbains-et-ecarts-de-temperature-relatifs-2020-2022) * are used for the * [Analysis of change between the mapping of heat/freshness islands 2013-2014 and 2020-2022] (https://www.donneesquebec.ca/recherche/dataset/analyse-de-changement-ilots-chaleur-fraicheur-et-indice-intensite-ilots-chaleur-urbains) *. For more details on the creation of the various maps as well as their advantages, limitations and potential uses, consult the * [Technote] (https://www.donneesquebec.ca/recherche/dataset/ilots-de-chaleur-fraicheur-urbains-et-ecarts-de-temperature-relatifs-2013-2014/resource/0696b7d8-b02f-4fcf-9876-1a3cec0587cd) * (simplified version) and/or the * [methodological report] (https://www.donneesquebec.ca/recherche/dataset/ilots-de-chaleur-fraicheur-urbains-et-ecarts-de-temperature-relatifs-2013-2014/resource/a33969ba-143a-4524-88c3-8ec7485676b1) * (version complete). The production of this data was coordinated by the National Institute of Public Health of Quebec (INSPQ) and carried out by the forest remote sensing laboratory of the Center for Forestry Education and Research (CERFO), funded under the * [2013-2020 Climate Change Action Plan] (https://www.environnement.gouv.qc.ca/changementsclimatiques/plan-action.asp) * of the Quebec government entitled Le Québec en action vert 2020. **This third party metadata element was translated using an automated translation tool (Amazon Translate).**