 Arctic SDI catalogue
Satellite imagery
Type of resources
Available actions
Topics
Keywords
Contact for the resource
Provided by
Formats
Representation types
Update frequencies
status
-

__The link: *Access the data directory* is available in the section*Dataset Description Sheets; Additional Information*__. **Change in forest cover detected by satellite imagery** is a provincial polygonal vector database produced using automated analysis of Sentinel-2 satellite imagery. This analysis aims to detect changes in forest cover throughout southern Quebec. The database includes disturbances of anthropogenic or natural origin, identified from images acquired during the summer period and analyzed at a resolution of 10 m × 10 m. It only contains detectable disturbances for which **no official information** was available at the time of the analysis. To determine if a disturbance is already known, the analysis compares the detected changes to the following official databases: + Harvesting and other silvicultural interventions + Forest fires + Epidemic, wind and ice storm + Forest infrastructures Polygons remain in the product as long as no official source confirms the nature or origin of the disturbance. As soon as official information becomes available, the element is removed from the diaper during the next release of the product. The analysis of the detected change is carried out once a year, during the months of October and November, using Sentinel-2 satellite imagery captured between June and September.**This third party metadata element was translated using an automated translation tool (Amazon Translate).**
-
These three satellite mosaics cover the entire territory of Quebec and include images taken in 2018, 2019 and 2020. The spectral bands are blue (band 2), near infrared (band 8), and short wave infrared (band 11). The Copernicus Sentinel-2 mission includes a constellation of two satellites in orbit that are in tandem and 180° apart from each other. The orbital configuration allows coverage with a revisit rate varying from two to ten days depending on the latitude. The Sentinel-2 constellation captures multispectral satellite images at a resolution of 10 m for the next generation of operational products, such as land use maps, land change detection maps, and geophysical variables. [Product Technical Specifications] (https://diffusion.mern.gouv.qc.ca/diffusion/RGQ/Matriciel/Satellite/Regional/Mosaiques_Sentinel-2/Document/Sentinel-2_User_Handbook.pdf) **This third party metadata element was translated using an automated translation tool (Amazon Translate).**
-

The Regional Deterministic Precipitation Analysis (RDPA) produces a best estimate of precipitation amounts that occurred over a period of 6 hours. The estimate integrates data from in situ precipitation gauge measurements, weather radar, satellite imagery and numerical weather prediction models. Geographic coverage is North America (Canada, United States and Mexico). Data is available at a horizontal resolution of 10 km. The 6 hour analysis is produced 4 times a day and is valid at 00, 06, 12 and 18 UTC. A preliminary analysis is available approximately 1 hour after the end of the accumulation period and a final one is generated 7 hours later in order to assimilate more gauge data.
-

The Regional Deterministic Precipitation Analysis (RDPA) produces a best estimate of precipitation amounts that occurred over a period of 24 hours. The estimate integrates data from in situ precipitation gauge measurements, weather radar, satellite imagery and numerical weather prediction models. Geographic coverage is North America (Canada, United States and Mexico). Data is available at a horizontal resolution of 10 km. The 24 hour analysis is produced twice a day and is valid at 06 and 12 UTC. A preliminary analysis is available approximately 1 hour after the end of the accumulation period and a final one is generated 7 hours later in order to assimilate more gauge data.
-

The Regional Deterministic Precipitation Analysis (RDPA) produces a best estimate of the amount of precipitation that occurred over recent past periods of 6 or 24 hours. The estimate integrates data from in situ precipitation gauge measurements, weather radar, satellite imagery and numerical weather prediction models. Geographic coverage is North America (Canada, United States and Mexico). Data is available at horizontal resolution of 10 km. Data is only available for the surface level. Analysis data is made available four times a day for 6h intervals and twice a day for the 24h interval. A preliminary estimate is available approximately 1h after the end of the accumulation period, and revised 7h after in order to assimilate gauge data arriving later.
-
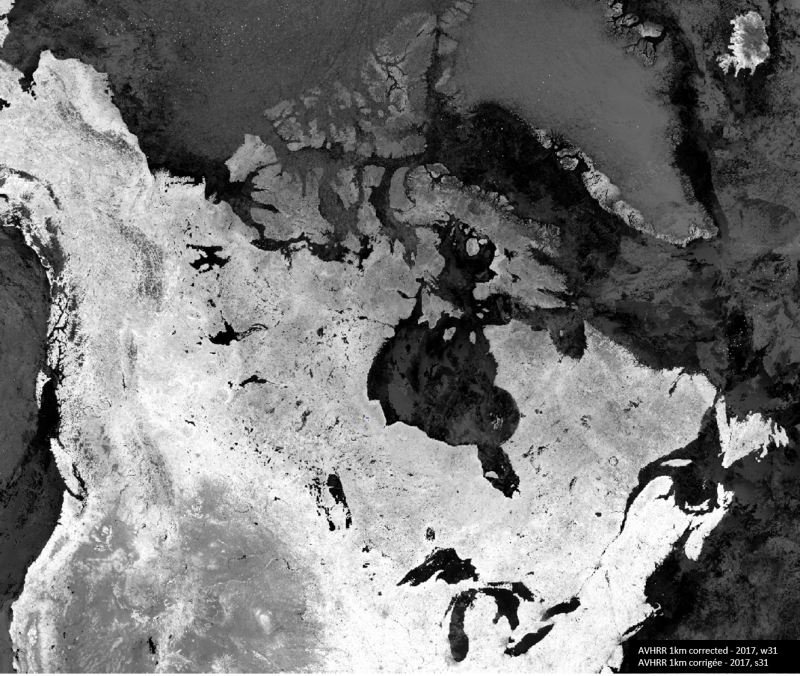
The cloud-corrected representation of the NDVI using historical AVHRR and VIIRS satellite images at 1 kilometre resolution provides reliable, objective and timely information on the state of vegetation throughout Canada and the northern United States. The methodology applied to the images has remained the same as for the program formerly known as the Crop Condition Assessment Program (CCAP). Since 1987, the National Oceanic and Atmospheric Administration (NOAA) series of satellites carrying the Advanced Very High-Resolution Radiometer (AVHRR) records images of the entire Earth's surface twice a day at 1kilometre resolution. This sensor captures two spectral bands (red and infrared) that have proven to be extremely useful for vegetation monitoring to produce the Normalized Difference Vegetation Index (NDVI). NDVI image composites on crop condition were produced by GeoManitoba until the end of the 2020 growing season. In 2021, Statistics Canada started producing the weekly composites using an application developed by Dr. Rasim Latifovic from National Resources Canada. Since 2022, due to the aging AVHRR sensor affecting the quality of the weekly composites, the team has transitioned to the NOAA-20 - Visible Infrared Imaging Radiometer Suite (VIIRS) satellite. VIIRS is a new-generation satellite with spectral characteristics comparable to those of its predecessor. To keep the NDVI values stable and continuous throughout the time series, the VIIRS composite values are normalized to obtain comparable NDVI values. Additional computations were performed by Statistics Canada for Julian weeks 15 to 41 to remove residual clouds from the NDVI composites and statistical extractions by geographic regions using three different types of agricultural masks. This dataset gives access to AVHRR images from 1987 to mid-2022 and VIIRS images from mid-2022 to present in GeoTIFF format and covers the agricultural land during the growing season of the field crops in Canada (Julian weeks 15 to 41). It also provides access to a database that contains the statistical NDVI by geographic regions (Townships, Census Consolidated Subdivisions (CCS), Census Divisions (CD) and Census Agricultural Regions (CAR)) and agricultural masks (Agriculture (AGR), Crop (CROP) and Pasture (PAS)).
-
The cloud-corrected NDVI data extracted from historical MODIS satellite images at 250 metre resolution provides reliable, objective, and timely information on the state of vegetation throughout Canada and the northern United States. The methodology applied to the images has remained the same as for the program formerly known as the Crop Condition Assessment Program (CCAP). Since the 2000 growing season, Statistics Canada has been processing and compiling MODerate-resolution Imaging Spectoradiometer (MODIS) data (250 metre resolution). The Multi-Spectral Instrument (MSI) captures two spectral bands (red and infrared) that have proven to be extremely useful to produce the Normalized Difference Vegetation Index (NDVI) utilized for vegetation monitoring. The original NDVI image composites were produced by Agriculture and Agri-Food Canada (link to original data in the resources section). Additional computations were completed by Statistics Canada to remove the effects of residual clouds and to calculate and extract the NDVI by geographic region. This dataset provides access to the MODIS images from 2000 to present in GeoTIFF format and covers the crop area during the growing season (Julian weeks 15 to 37; mid-April to mid-September). It also provides access to a database that contains the statistical NDVI by geographic regions (Townships, Census Consolidated Subdivisions (CCS), Census Divisions (CD) and Census Agricultural Regions (CAR)) and agricultural masks (Agriculture (AGR), Crop (CROP) and Pasture (PAS)).
-
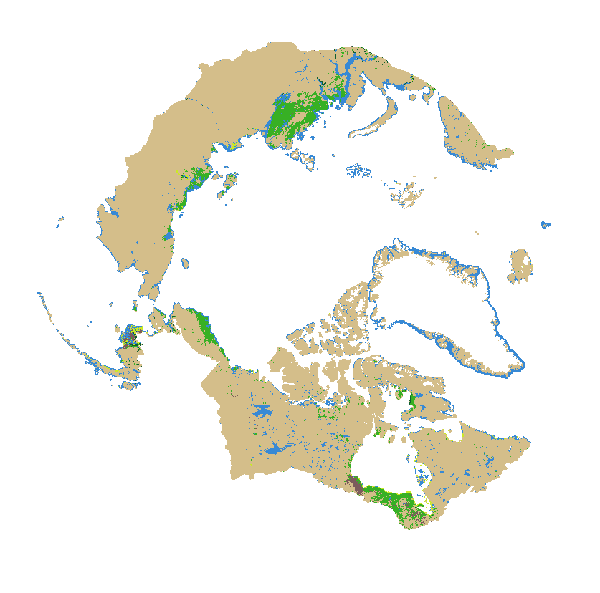
This dataset presents the first comprehensive, high-resolution (10-meter) wetland inventory map covering the entire 32.2 million square kilometers of the Pan-Arctic region, of which 14 million square kilometers (43%) is terrestrial and 18.4 million square kilometers (57%) is marine. Generated through advanced Earth Observation and machine learning techniques, the map was produced using multi-year (2020–2022), multi-source satellite imagery—including Sentinel‑1, Sentinel‑2, and ALOS PALSAR‑2—as well as various environmental features such as elevation. Over 1,000 wetland polygons were analyzed using an object-based random forest classification workflow on the Google Earth Engine cloud platform, achieving an average overall classification accuracy of 89%. The mapping extent was defined according to the Arctic Council’s Conservation of Arctic Flora and Fauna (CAFF) boundary, resulting in the identification of 2,947,618 km² of wetlands, representing 20% of the land area within the Pan-Arctic region. This dataset establishes a consistent and authoritative baseline for pan-Arctic wetlands, leveraging the latest advances in Earth Observation, machine learning, and cloud computing. The Canadian Wetland Classification System was used and includes the major wetland classes: bog, fen, marsh, swamp, and water. The overall wetlands coverage by country within the CAFF boundary was: Canada (27%), United States of America (i.e., Alaska 39%), Finland (31%), Iceland (8%), Norway (17%), Sweden (26%), Kingdom of Denmark (i.e., Greenland 1%), and the Russian Federation (21%). Development of this product was undertaken by Natural Resource Canada's Canada Centre for Mapping and Earth Observation and the Canadian Geospatial Data Infrastructure Division in collaboration with the Arctic Council’s CAFF biodiversity group, CAFF Wetland Experts Group, national organisations mandated to monitor wetlands, and Arctic National Mapping Agencies, and Canadian company C-CORE, integrating ground truth data collected from Alaska, Finland, Sweden, and the Kingdom of Denmark through partner agencies and digital image interpretation. More than 60,000 images (2020-2022), primarily covering summer periods, were processed to ensure robust results. This dataset provides essential baseline information for Earth Observation monitoring of climate change impacts and supports critical environmental surveillance for Arctic and remote northern communities.
-
The annual Landsat mosaics offer a unique portrait of the whole of Quebec. They make it possible to analyze environmental and territorial changes over more than 40 years, in particular the evolution of natural environments, urban sprawl, agricultural and forestry activities, the transformations of protected areas as well as the modifications of water networks, such as reservoirs and dams. ## #Principales characteristics of mosaics### * 30m resolution * GeoTIFF format * Images acquired between July and August * Time series covering 1984 to the present * Production based on the selection of the best optical quality pixel * Designed to provide a consistent representation from year to year These mosaics are produced in collaboration with the Laurentian Forestry Center of the Canadian Forest Service (CFS). The SCF produces the mosaics and the Directorate-General for Geospatial Information of the Ministry of Natural Resources and Forests prepares them for dissemination. The main components are as follows: ### #Images GeoTIFF by spectral bands#### * Unenhanced mosaics available by spectral bands in 16-bit GeoTIFF format (ex.: SR_L5789_HARM_BP_2013_B1_gapfill_mrnf_masked.tif). Each mosaic includes bands 1 (Blue), 2 (green), 2 (green), 3 (red), 3 (red), 4 (near infrared), 5 (medium infrared) and 7 (medium infrared); * Matrix showing the year of the images where the highest quality pixels were extracted (ex.: SR_L5789_HARM_BP_2013_year_gapfill_mrnf_masked.tif); * Matrix showing the Julian days of the highest quality pixels extracted. Julian days start on January 1, 1970, hence the JJ70 label (e.g.: SR_L5789_HARM_BP_2013_JJ70_gapfill_mrnf_masked.tif). They make it possible to find the exact date when the pixels were captured in each mosaic; * Matrix showing which Landsat satellite corresponds to each higher-quality pixel extracted (ex.: SR_L5789_HARM_BP_2013_sensor_gapfill_mrnf_masked.tif). ### #Images enhanced mosaics#### GeoTIFF mosaics bringing together the six spectral bands enhanced by Contrast Limited Adaptive Histogram Equalization (CLAHE) for each year (e.g.: Mosaique_Landsat_2013_CLAHE.tif). Notes to the user: 1. Some artifacts may be present where no Landsat images acquired during the same year were free of clouds, airveils, or shadows. 2. Mosaics from 1984 to 1989 include certain areas where there is no data due to limited acquisition capacity. The number of Landsat satellites in orbit at that time was not sufficient to ensure complete imaging coverage during the months of July and August. 3. Use of images: This is not a requirement, but the following source citation may be used in publications or presentation materials to recognize the United States Geological Survey. Landsat Collection 2 Surface Reflectance (SR) courtesy of the U.S. Geological Survey. **This third party metadata element was translated using an automated translation tool (Amazon Translate).**
-
The data presented on this page concern the 2013-2014 mapping of temperature differences, the classification maps of these temperature differences (i.e. urban heat and freshness islands) and the map of the urban heat island intensity index. These different maps are detailed below: - The map of __Temperature differences in °C__ represents the temperature difference in the city compared to a nearby forest. It was produced at the scale of the Quebec ecumene (2016 census, 167,764 km2). This mapping, provided on a grid with a spatial resolution of 15 m, was carried out with a predictive machine learning model built on Landsat-8 satellite data provided by the *United States Geological Survey (USGS) * as well as from other geospatial variables such as hydrography and topography. - The mapping of surface temperature difference classes, i.e. __Urban Heat and Cool Islands (ICFU) __ was carried out for * [population centers of the 2021 census] (https://www150.statcan.gc.ca/n1/pub/92-195-x/2021001/geo/pop/pop-fra.htm) * (CTRPOP) with at least 1,000 inhabitants and a density of at least 400 inhabitants per km2 to which is added a buffer zone of 2 km. It thus covers all major urban centers, i.e. 14,072 km2. The method for categorizing ICFUs is the ranking of predicted temperature differences for each population center into 9 levels. Classes 8 and 9 are considered __Urban Heat Islands__ and classes 1, 2 and 3 as __Urban Fresh Islands__. The interval values for each class and population center are shown in the production metadata file. Since surface temperatures were analyzed at the Quebec ecumene scale, but the classification intervals were calculated for each population center individually, the temperature differences grouped into the different classes vary from region to region. Thus, there are differences observed in the predicted temperature differences between North and South Quebec and according to urban realities. For example, a temperature difference of 2°C may be present in class 1 (cooler) in a population center located in southern Quebec, but may be present in class 9 (very hot) in a population center in northern Quebec. It is therefore important to interpret the identification of heat islands in relation to the relative temperature difference data produced at the Quebec ecumene scale. - The __Urban Heat Island Intensity Index (SUHII) map __ represents the Surface Urban Heat Island Intensity Index (SUHII). This index is calculated for each * [dissemination island] (https://www150.statcan.gc.ca/n1/pub/92-195-x/2021001/geo/db-id/db-id-fra.htm) * (ID) of Statistics Canada included in the * [2021 census population centers] (https://www150.statcan.gc.ca/n1/pub/92-195-x/2021001/geo/pop/pop-fra.htm) * (CTRPOP) * () * (CTRPOP). It highlights areas with higher heat island intensity, by calculating a weighted average from temperature difference classes, giving more weight to the hottest classes. This weight is proportional to the class number (e.g. a class 9 surface is 9 times more important in the index than the same area with a class 1). These maps as well as those of * [2020-2022] (https://www.donneesquebec.ca/recherche/dataset/ilots-de-chaleur-fraicheur-urbains-et-ecarts-de-temperature-relatifs-2020-2022) * are used for the * [Analysis of change between the mapping of heat/freshness islands 2013-2014 and 2020-2022] (https://www.donneesquebec.ca/recherche/dataset/analyse-de-changement-ilots-chaleur-fraicheur-et-indice-intensite-ilots-chaleur-urbains) *. For more details on the creation of the various maps as well as their advantages, limitations and potential uses, consult the * [Technote] (https://www.donneesquebec.ca/recherche/dataset/ilots-de-chaleur-fraicheur-urbains-et-ecarts-de-temperature-relatifs-2013-2014/resource/0696b7d8-b02f-4fcf-9876-1a3cec0587cd) * (simplified version) and/or the * [methodological report] (https://www.donneesquebec.ca/recherche/dataset/ilots-de-chaleur-fraicheur-urbains-et-ecarts-de-temperature-relatifs-2013-2014/resource/a33969ba-143a-4524-88c3-8ec7485676b1) * (version complete). The production of this data was coordinated by the National Institute of Public Health of Quebec (INSPQ) and carried out by the forest remote sensing laboratory of the Center for Forestry Education and Research (CERFO), funded under the * [2013-2020 Climate Change Action Plan] (https://www.environnement.gouv.qc.ca/changementsclimatiques/plan-action.asp) * of the Quebec government entitled Le Québec en action vert 2020. **This third party metadata element was translated using an automated translation tool (Amazon Translate).**