 Arctic SDI catalogue
Station
Type of resources
Available actions
Topics
Keywords
Contact for the resource
Provided by
Formats
Representation types
Update frequencies
status
-
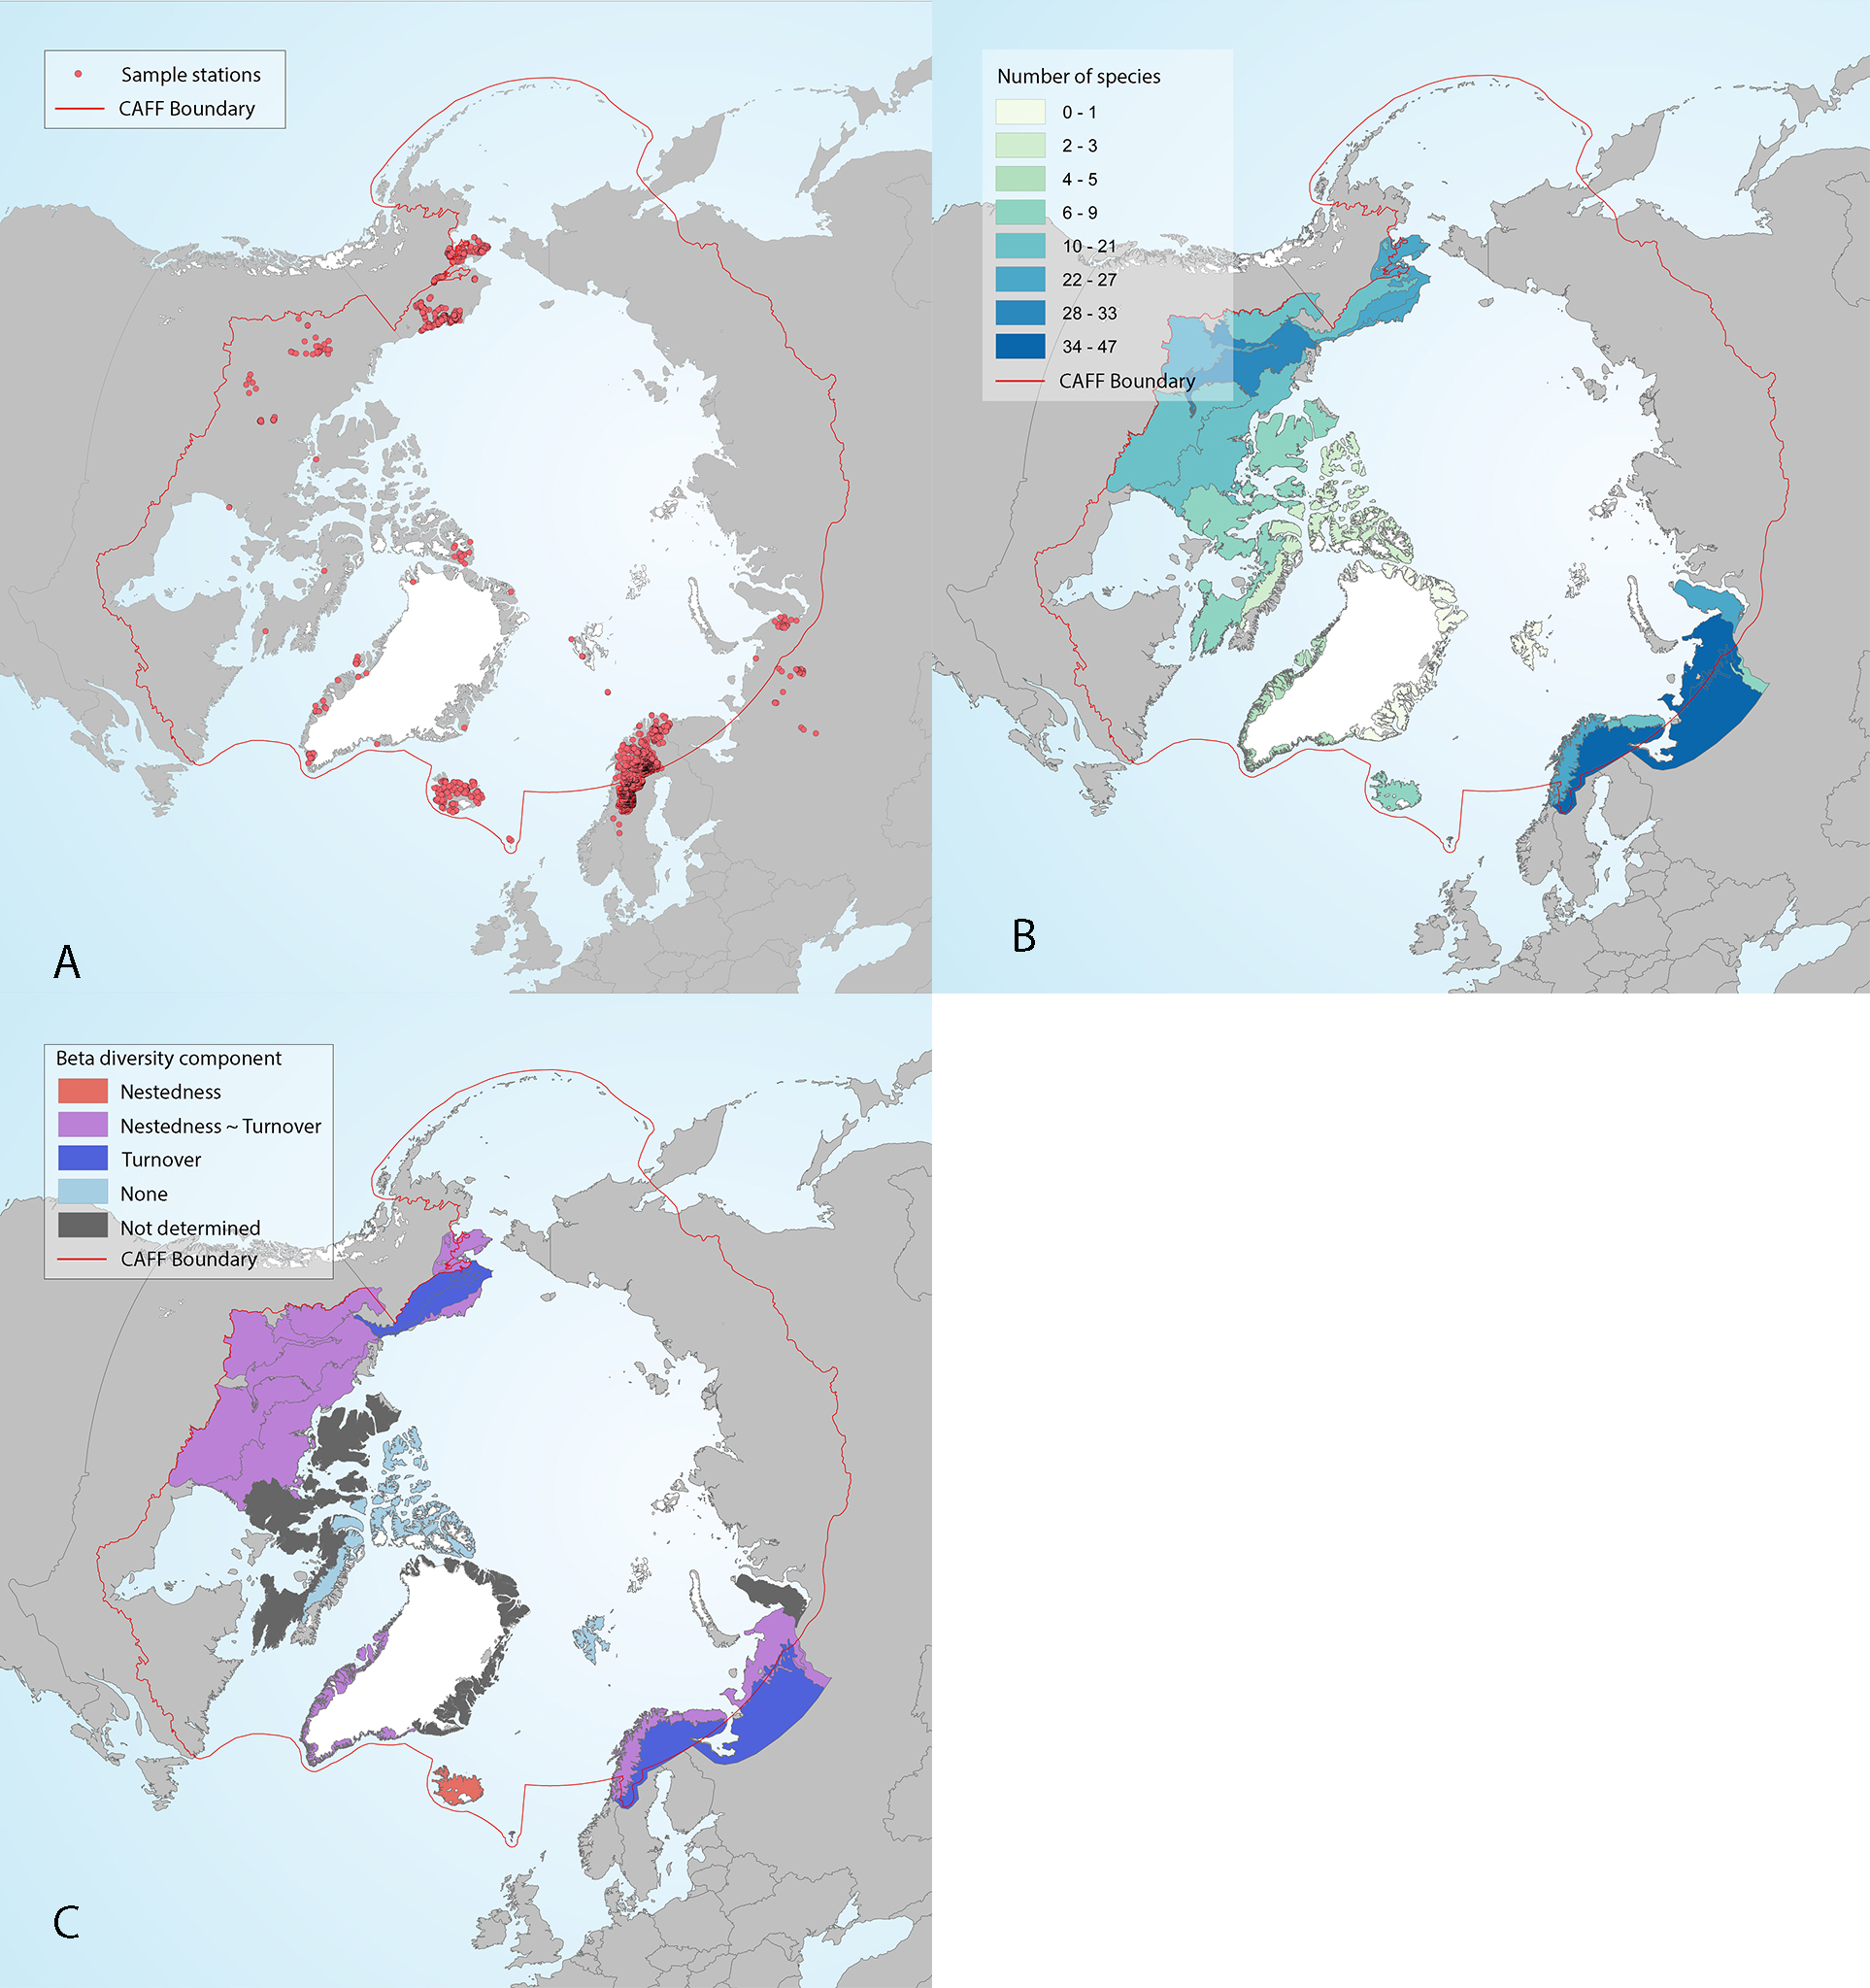
Figure 4 -36 Freshwater fish sampling stations (A), ecoregion alpha diversity in each of the sampled ecoregions, as quantified by estimates of species richness from reference texts (Muus and Dahlstrøm 1971, Scott and Crossman 1973, Mecklenburg et al. 2002) and expert knowledge (academic and government scientists and traditional knowledge) (B), and ecoregion beta diversity (C) characterized according to components of beta diversity as either nestedness, turnover, no diversity (none, beta = 0), or similar nestedness and turnover (nestedness ~ turnover) in the circumpolar Arctic. Ecoregions are shown only where sampling stations occur. Fish sampling stations included in this study assessed complete fish assemblages at each location. State of the Arctic Freshwater Biodiversity Report - Chapter 4 - Page 74 - Figure 4-36
-

Data on the depth of freezing and thawing in road pavements managed by the Ministry of Transport and Sustainable Mobility (MTMD). Since the 2008-2009 winter period, these data have been calculated using temperature measurements recorded by weather stations located on the Quebec road network. In particular, these stations are equipped with a 3.0 m long probe to measure the hourly average temperature at various levels in the roadway. Average freezing and thawing depth values are then calculated on a daily basis. It should be assumed that the data is specific to the location and date of measurement only. Any interpretation of the continuity of measurements in space and time is left to the discretion of the user. It is also important to note that the start and end dates of load restriction periods take into account a combination of factors including the location of the stations on the road network and the spatial representativeness of the measurements.**This third party metadata element was translated using an automated translation tool (Amazon Translate).**
-
Created in the late 1980s, the Network for the Study and Monitoring of Forest Ecosystems (RESEF) is a network for the long-term monitoring of natural forests, including more than forty stations spread across Quebec. It aims to characterize the main components of these forest ecosystems, to monitor their evolution and to study their functional interactions. Each station consists of a sample plot of 0.5 hectares in deciduous stands and 0.25 hectares in coniferous stands. In order to carry out a detailed monitoring of the characteristics of the vegetation, these plots are subdivided into plots of 100 m2 (10 m × 10 m). Each tree with a diameter at chest height (DHP, measured 1.3 m from the ground) greater than or equal to 11 mm present in the plot is numbered and georeferenced, then its DHP and its height are measured. The dimensions of the crown are noted for trees whose DHP is greater than or equal to 91 mm, and the regeneration is inventoried. Each plot is surrounded by a 100 m protection zone, in which the physicochemical properties of soils and foliage are measured. Analysis of growth rings complete the follow-up. Since 1986, data has been collected at regular intervals of 5 or 10 years according to standardized protocols. **This third party metadata element was translated using an automated translation tool (Amazon Translate).**
-

Mapping of the odor constrained areas of wastewater treatment plants in the urban planning code (CDU) on the territory of Laval.**This third party metadata element was translated using an automated translation tool (Amazon Translate).**
-
Station Quality Index (IQS) maps provide a 25-year IQS value for white spruce, black spruce, and jack pine plantations at the scale of the forest polygon of the ecoforest map updated in 2022. These IQS values were estimated with non-parametric models called decision-making tree forests, which were parameterized from spatially explicit variables, derived from climate data, ecological classification, edaphic characteristics and attributes relating to the station. IQS values were estimated based on the current climate period for managed forest land and do not include climate projections. Data can be downloaded as a file in GeoPackage (GPKG) or CSV format. To know the details of the modeling approach used, you are invited to consult the SSRF-30 technical opinion by Barrette et al. (2023).**This third party metadata element was translated using an automated translation tool (Amazon Translate).**
-

A station is a site on a river or lake where water quantity (water level and flow) are collected and recorded.