 Arctic SDI catalogue
abundance
Type of resources
Available actions
Topics
Keywords
Contact for the resource
Provided by
Years
Formats
Representation types
Update frequencies
status
Service types
Scale
-

Fishing event (e.g., day, time, location, catch effort), and associated biological data from the Standardized Inlet Survey component of the annual Sablefish Research and Assessment Survey on the British Columbia coast. Introduction DFO and the Canadian Sablefish Association undertake a collaborative fishery-independent annual research survey under a joint agreement. The survey employs longline trap gear to obtain catch rate data, gather biological samples, capture oceanographic measurements, and collect tag release and recapture data. Data summaries are provided here for standardized sets conducted at fixed stations within mainland inlets. The design of the sablefish survey has developed over time by incorporating and discontinuing components, including individual experimental studies (not available on OpenData). This Standardized Inlet Survey component differs in methodology from the other two survey components: (1) Offshore stratified random survey (2003 – present; available on OpenData using link below), and (2) Standardized trap survey – offshore indexing and offshore tagging (1990 – 2010; not yet available on OpenData). For the Standardized Inlet Survey, sets are allocated to five specific polygons in each of the following four inlet areas: Portland Inlet, Gil Island, Finlayson Channel, and Dean/Burke Channel. All four inlets were surveyed consistently between 2003 and 2019. No inlets were surveyed in 2020, and a single inlet was surveyed each year since 2021. Survey procedures are standardized and documented in Canadian Technical Reports of Fisheries and Aquatic sciences. Data tables provided for the Standardized Inlet Survey include (i) Effort, (ii) Catch, and (iii) Biological Information. Inlet Effort This table contains information about annual survey trips and fishing events (sets). Trip-level information includes the year the survey took place, a unique trip identifier, the vessel that conducted the survey and the trip start and end dates (the dates the vessel was away from the dock conducting the survey). Set-level information includes the inlet name, date, time, location and depth that fishing took place, soak time, and number of traps deployed. All successful fishing events are included, where successful sets are those that met survey design specifications. Inlet Catch This table contains the catch information from successful fishing events. Catch is identified to species or to the lowest taxonomic level possible. Catch is recorded as fish counts and / or weight. The unique trip identifier and set number are included so that catches can be related to the fishing event information (including capture location) for each set. Inlet Biological Information This table contains the biological data for sampled catches. Data may include any or all of length, weight, sex, maturity and age. Most of the sampled catch is Sablefish; however, some biological information has been collected for other species. Age structures are collected and are archived until required for analyses; therefore, all existing structures have not been aged. Tissue samples (usually a fin clip) may be collected for genetic (DNA) analysis for specific species. Tissue samples may be archived until required for analysis; for more information please see the data contacts. The unique trip identifier and set number are included so that samples can be related to the fishing event and catch information.
-
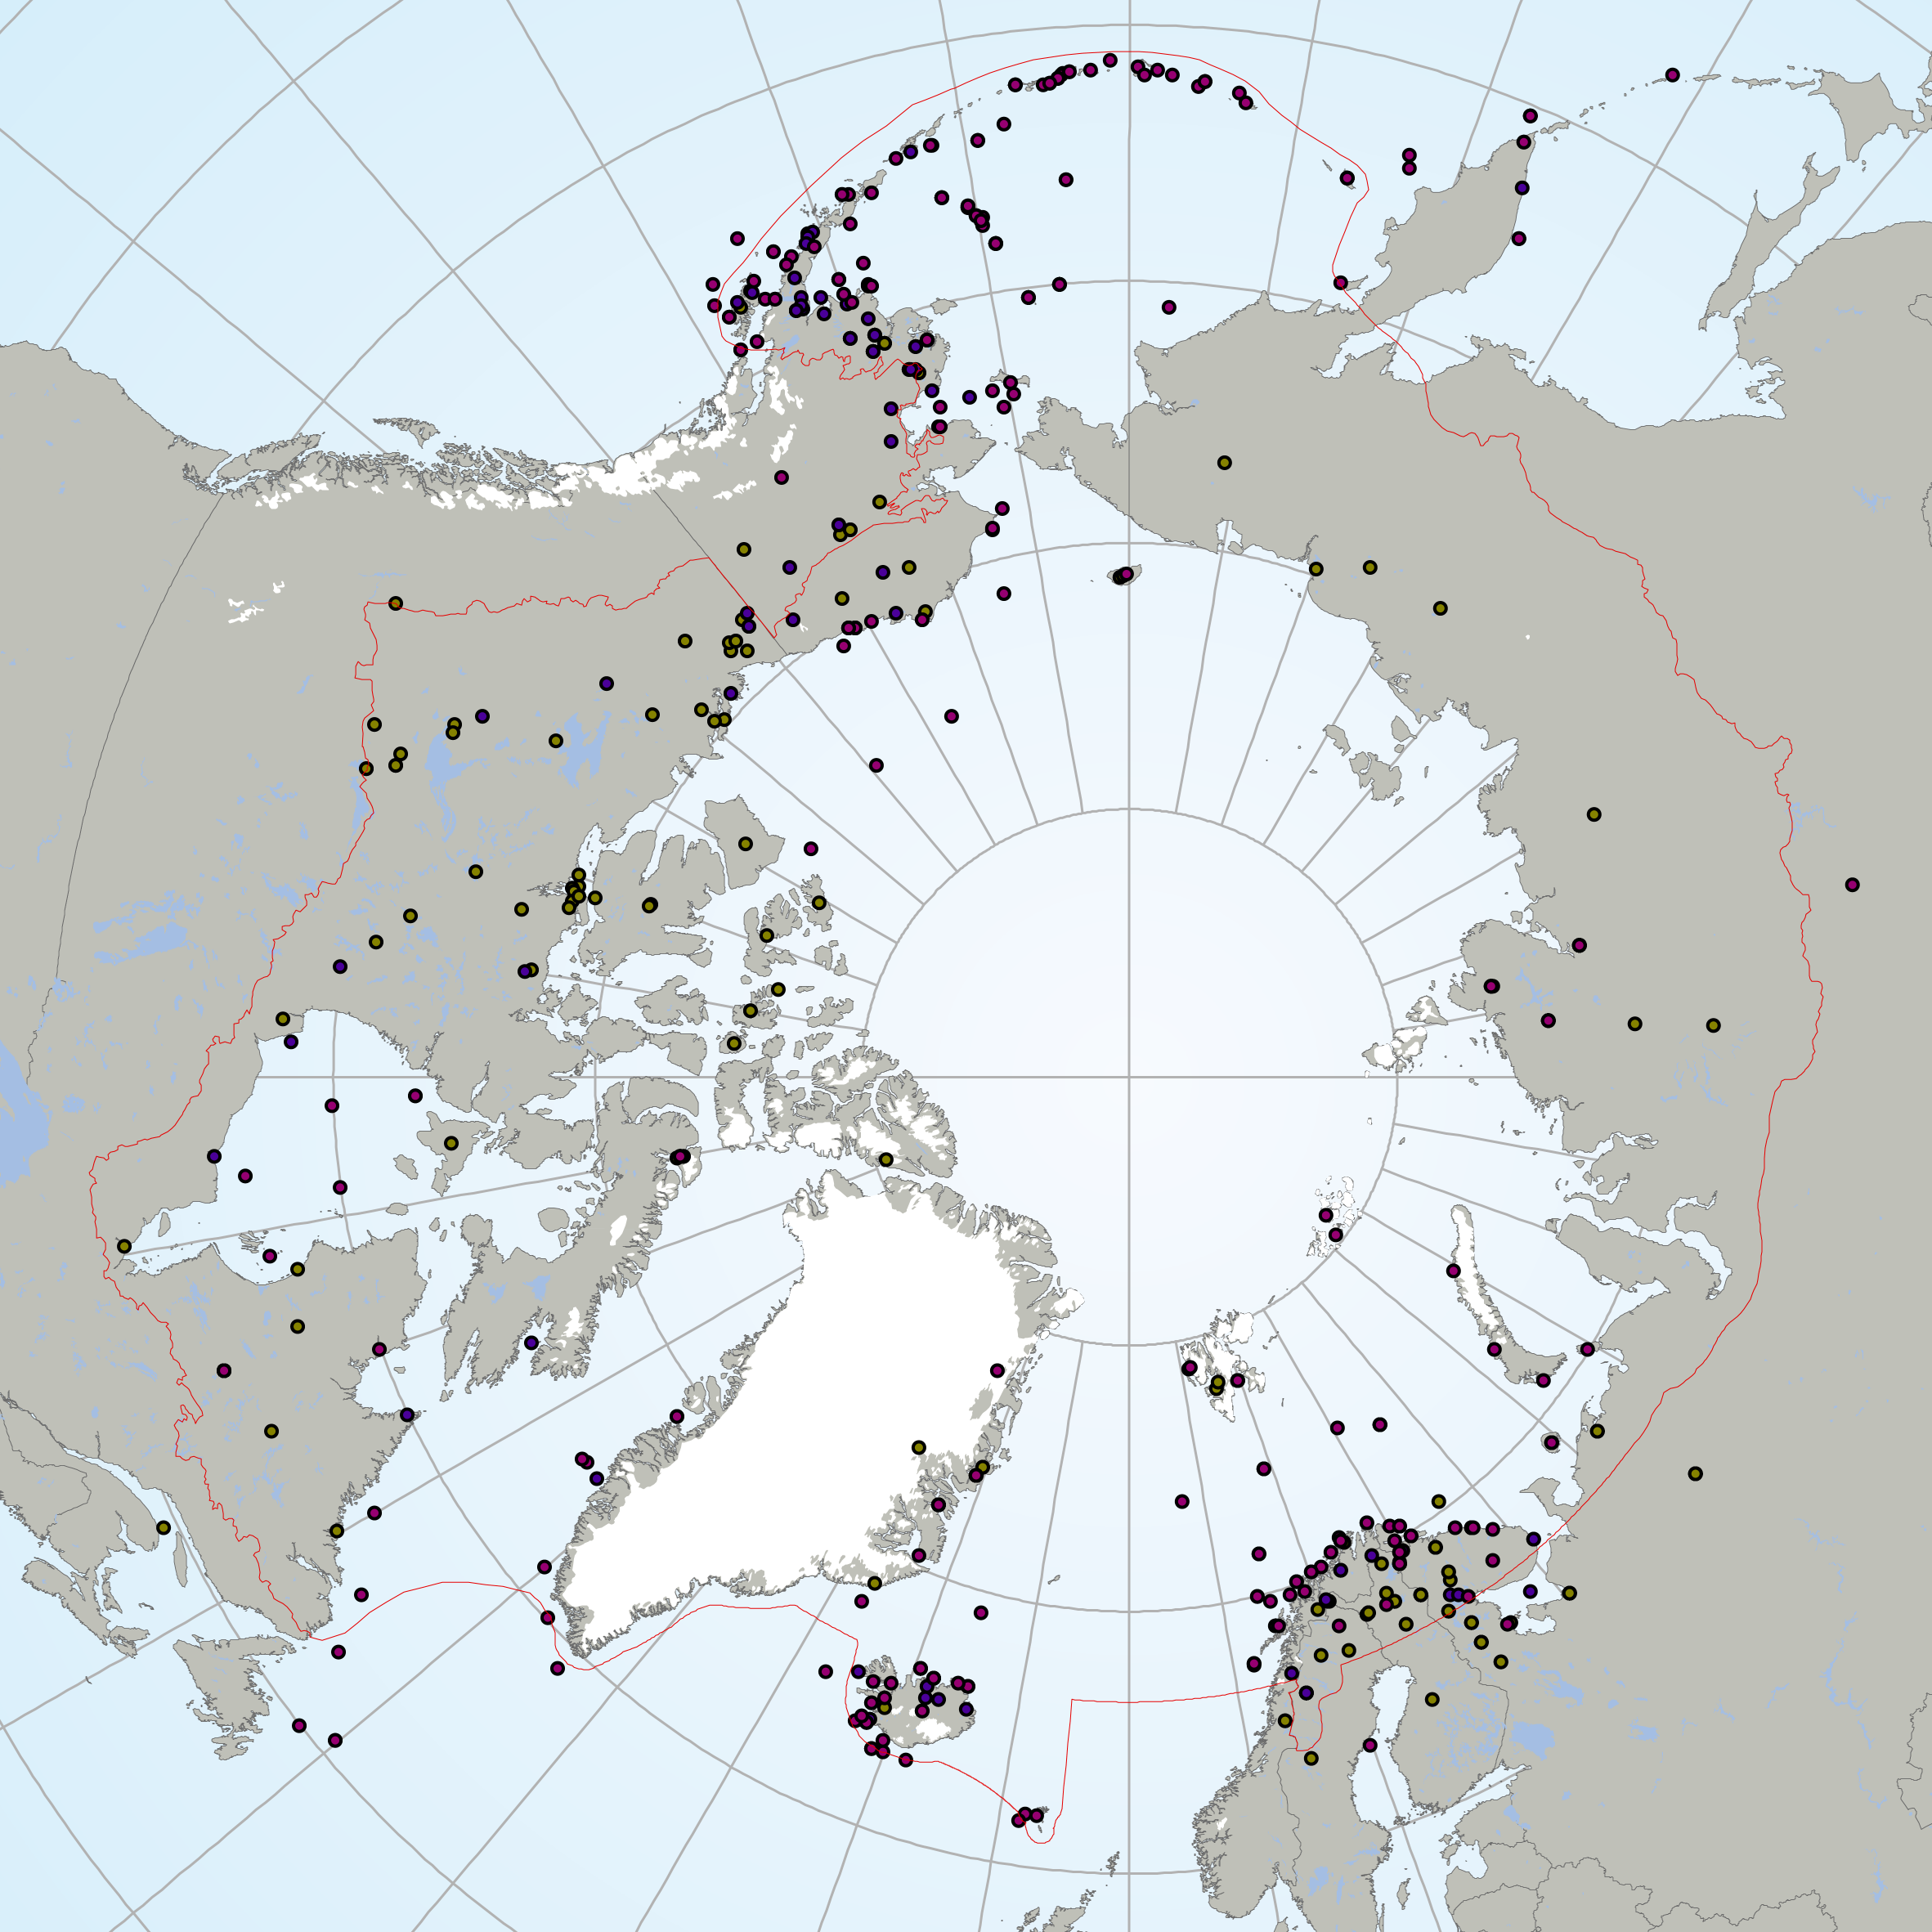
The Circumpolar Biodiversity Monitoring Program, a cornerstone programme of the Conservation of Arctic Flora and Fauna (CAFF), Arctic Council working Group is an international network of scientists, government agencies, Indigenous organizations and conservation groups working together to harmonize and integrate efforts to monitor the Arctic's living resources.CBMP experts are developing four coordinated and integrated Arctic Biodiversity Monitoring Plans to help guide circumpolar monitoring efforts. Results will be channeled into effective conservation, mitigation and adaptation policies supporting the Arctic. These plans represent the Arctic's major ecosystems(Marine, Freshwater, Coastal, Terrestrial). It is important that monitoring programs develop the most effective reporting strategies if they are to inform decision making. To facilitate effective and consistent reporting, the CBMP has chosen a suite of indices and indicators that provide a comprehensive picture of the state of Arctic biodiversity – from species to habitats to ecosystem processes to ecological services. These indices and indicators are developed in a hierarchical manner, allowing users to drill down into the data from the higher-order indices to more detailed indicators. These are being developed through an expert consultation process. The Arctic Species Trend Index (ASTI) is part of this suite of indicators and indices developed by CAFFs CBMP. It tracks trends in over 300 Arctic vertebrate species and comprises the Arctic component of the Living Planet Index. It is important to identify how wildlife and ecosystems are changing in order to develop effective conservation and adaptation strategies in the Arctic, an environment undergoing dramatic changes. The ASTI describes overall trends across species, taxonomy, ecosystems, regions and other categories.
-
Bird Studies Canada WMS/WFS Server for bird distribution and abundance data, and related information. Bird Studies Canada gratefully acknowledges the support of Environment Canada - Canadian Information System for the Environment in developing this service.
-
Bird Studies Canada WMS/WFS Server for bird distribution and abundance data, and related information. Bird Studies Canada gratefully acknowledges the support of Environment Canada - Canadian Information System for the Environment in developing this service.
-

The United States population of California Sea Lions (Zalophus californianus) range from southeast Alaska to the Pacific coast of central Mexico. While this population does not breed in Canada, some sub-adult and adult males migrate northwards to British Columbia (BC) during the non-breeding season with an arrival in August–October and a departure in April–May. The population in coastal BC was assessed in 1985 and again in 2023 from dedicated over-winter aerial surveys. The most recent assessment used counts from 2020–2021surveys that were restricted to southern BC as few animals have been documented further north. Additional observations of California Sea Lions were collected while surveying sites for Steller Sea Lions. These opportunistic counts increased from approximately 1,000 animals in the mid-2000s to several thousand individuals in more recent years. Historically occupied sea lion rookeries and haul-out sites were surveyed with nearby areas monitored for potential shifts in distribution. This dataset contains counts that have been collected from sightings of individuals from 1971 through 2021and replaces a previous dataset limited to the 2016/2017 survey season.
-

Many cetacean species were depleted in Canadian Pacific waters by commercial whaling, which ended in 1967. Although some populations have since shown evidence of recovery, there is limited information about the current abundance and geographic distribution of many species, particularly in difficult-to-survey offshore regions. This lack of baseline data hampers conservation status assessments, including estimating population-level impacts of anthropogenic activities. From July to early September 2018, we conducted ship-based surveys of cetaceans throughout the coastal and offshore waters of British Columbia. Density surface modelling (DSM) was used to produce spatially-explicit abundance estimates and distribution maps for four commonly-encountered cetacean species: the humpback whale (Megaptera novaeangliae), fin whale (Balaenoptera physalus), Dall’s porpoise (Phocoenoides dalli) and harbour porpoise (Phocoena phocoena). We estimated abundances of 7,030 (95% CI = 5,733-8,620) humpback whales, 2,893 (95% CI = 2,171-3,855) fin whales, 23,692 (95% CI = 19,121-29,356) Dall’s porpoises and 5,207 (95% CI = 2,769-9,793) harbour porpoises throughout Canadian Pacific waters. Our results complement design-based abundance estimates calculated from the same survey data, and can be compared with past habitat modelling studies and historical whaling catch data to estimate the extent of recovery of previously harvested populations. The return of these predators to habitats from which they were previously extirpated will have important ecosystem-level implications. The DSM results can contribute to calculations of Potential Biological Removal estimates to inform fisheries bycatch, as well as providing spatial data that can be used to assess the risk of entanglements, ship strikes, acoustic disturbance, and other anthropogenic threats. This dataset contains model-predicted densities of four commonly-encountered cetacean species (humpback whale, fin whale, Dall's porpoise and harbour porpoise) that were estimated using ship-based, visual survey data collected during the Pacific Region International Survey of Marine Megafauna (PRISMM) in July-August of 2018. Abundance of each species (where relevant) is provided for three gridded strata (25 km2 cell size) in the Pacific Region: one for the offshore, extending to Canada’s exclusive economic zone (EEZ), and two for coastal areas (the North Coast and the Salish Sea).
-
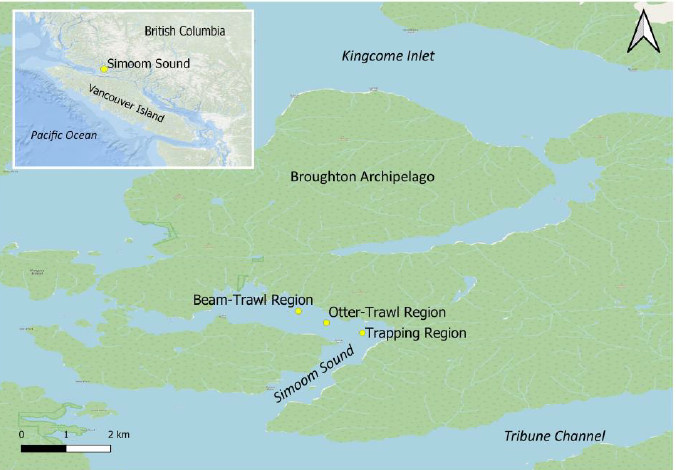
These data sets provide information pertaining to abundant taxa including bottom-dwelling shrimp and fish along trawling and trapping transects in Simoom Sound at November, 2000, and February, 2001. Data sets were compiled and formatted by Meagan Mak. Abstract from report: This study is a component of a larger project designed to compare the effects of shrimp trawling and trapping gear on shrimp, fish and the benthic habitat of Simoom Sound located in Broughton Archipelago, British Columbia, Canada. Otter-trawling, beam-trawling, and trapping took place in three distinct experiment blocks of the central seabed of the Sound. In turn, each block consisted of replicate transects, where a towed submersible video-camera surveyed shrimp and fish before and after trawling. Video surveys were deployed only before trapping. From the video surveys, we determined the abundance of common shrimp taxa and fish.
-
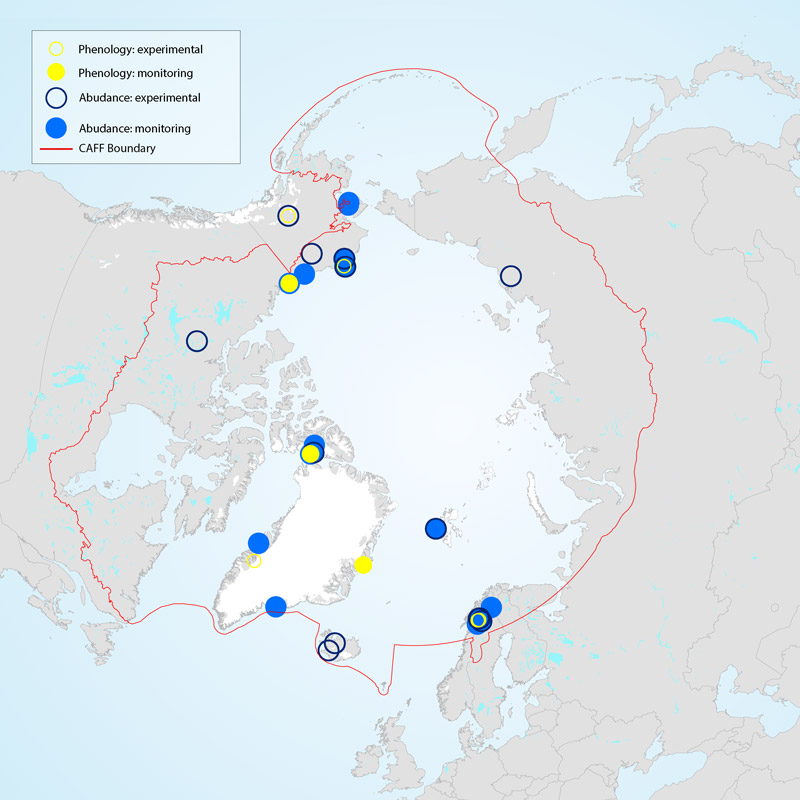
Vegetation monitoring occurs across the Arctic, but the duration of monitoring efforts is variable and is dependent upon both study design and access to resources. Although many field studies on vegetation have been conducted in the Arctic (Figure 3-5), not all can be considered monitoring since some recorded only select measurements over limited time frames. Studies reporting on abundance and composition of vegetation reflect a larger and more widespread geographical coverage than the typically more site-limited and time-consuming phenology studies (Figure 3-5). Geographical gaps in coverage of Siberia and large parts of the Canadian Arctic are evident. STATE OF THE ARCTIC TERRESTRIAL BIODIVERSITY REPORT - Chapter 3 - Page 34 - Figure 3.5
-

These datasets provide information pertaining to sediment grain size, porosity, organic content, total carbon and nitrogen concentrations, trace element concentrations, chlorophyll and phaeopigment concentrations, and meiofauna and macrofaunal abundance in Simoom Sound between November, 2000, and February, 2001. Data formatting of files were performed by Meagan Mak. Sutherland et al (2023) covers the benthic component of a broader project investigating potential modification of marine ecosystems by shrimp trawling and trapping on the central coast of British Columbia. Sediment and infaunal samples were collected before and after fishing with commercial fishing gear consisting of otter-trawl, beam-trawl, and trap-lines. Simoom Sound was sampled in November 2000 and February 2001. Tabulated data of sediment characteristics that include sediment grain size, porosity, carbon and nitrogen content, trace-element, and chlorophyll concentrations are presented in this report. In addition, the infaunal data are comprised of both macrofaunal and meiofaunal communities.
-

Fishing event data (e.g. year, date, time, location, catch and effort) and associated biological data from the Offshore Stratified Random Survey component of the annual Sablefish Research and Assessment Survey on the British Columbia coast. Introduction DFO and the Canadian Sablefish Association (CSA) collaborate to undertake an annual fishery-independent research survey under a joint agreement. The survey employs longline trap gear to obtain catch rate data, gather biological samples, capture oceanographic measurements, and collect tag release and recapture data. Data summaries provided here are for the offshore stratified random sampling design (StRS) component of the survey, which has been conducted annually since 2003. The design of the sablefish survey has developed over time by incorporating and discontinuing components, including individual experimental studies (not available on OpenData). This StRS Survey component differs in methodology from the other two survey components: (1) Standardized trap survey – mainland inlets (1994-present; available on OpenData using link below), and (2) Standardized trap survey – offshore indexing and offshore tagging (1990 – 2010; not yet available on OpenData). The Sablefish offshore stratified random trap survey (StRS) follows a depth and area stratified random sampling design. The survey area is partitioned into five spatial strata (S1 to S5) and three depth strata (RD1 to RD3) for a total of 15 strata. The five spatial strata are S1 (South West Coast Vancouver Island or SWCVI), S2 (North West Coast Vancouver Island or NWCVI), S3 (Queen Charlotte Sound or QCS), S4 (South West Coast of Haida Gwaii or SWCHG), and S5 (North West Coast of Haida Gwaii or NWCHG). The three depth strata are 100-250 fathoms (RD1), 250-450 fathoms (RD2), and 450-750 fathoms (RD3). The area within each of the 15 strata are sectioned into 2 km x 2 km grid cells or ‘fishing blocks’ from which set locations are randomly chosen each year. Survey procedures are standardized and documented in Canadian Technical Reports of Fisheries and Aquatic sciences. Data tables provided for the offshore stratified random survey include (i) effort, (ii) catch, (iii) biological information, (iv) the sampling frame from which blocks are selected for sampling each year, and (v) the calculated coastwide Sablefish biomass index. StRS Effort This table contains information about the annual survey trips and fishing events (sets). Trip-level information includes the year the survey took place, a unique trip identifier, the vessel that conducted the survey and the trip start and end dates (the dates the vessel was away from the dock conducting the survey). Set-level information includes the date, time, location and depth that fishing took place, the survey spatial and depth strata for the set, reason for the set, soak time, number of traps deployed and number of traps fished. All successful fishing events are included, i.e., those sets that conformed to specified survey standards. StRS Catch This table contains the catch information from successful fishing events. Catches are identified to species or to the lowest taxonomic level possible. Catches are recorded as fish counts and / or weight. The unique trip identifier and set number are included so that catches can be related to the fishing event information (including capture location). StRS Biological Information This table contains the biological data for sampled catches. Data may include any or all of length, weight, sex, maturity, and age. Most of the sampled catch is Sablefish; however, some biological information has been collected on Rockfish, Flatfish and other Roundfish species in some years. Age structures are collected and are archived until required for analyses; therefore, all existing structures have not been aged at this time. Tissue samples (usually a fin clip) may be collected for genetic (DNA) analysis for specific species. Genetic samples may be archived until required for analyses; for more information, please see the data contacts. The unique trip identifier and set number are included so that samples can be related to the fishing event and catch information. Sample Frame This table contains a list of all of the 2km x 2km grid cells or ‘fishing blocks’ that are part of the stratified random sampling frame. A subset of blocks are randomly selected for sampling each year from this list. For each grid cell, the corresponding depth and spatial strata ID is included. This sample frame can be used to calculate design-based abundance indices for the survey. StRS Biomass Index This table contains a coastwide relative biomass index for Sablefish based on the annual StRS survey. Stratified random sampling mean index values and 95% confidence intervals are calculated by year using the classical survey stratified random sampling estimator (Cochran 1977) and the number of possible sampling units per stratum provided by Wyeth et al. (2007). The relative biomass index has been input to the operating model and management procedure used to provide management advice for BC Sablefish since 2011 (Cox et al. 2011).