 Arctic SDI catalogue
River
Type of resources
Available actions
Topics
Keywords
Contact for the resource
Provided by
Years
Formats
Representation types
Update frequencies
status
Service types
-
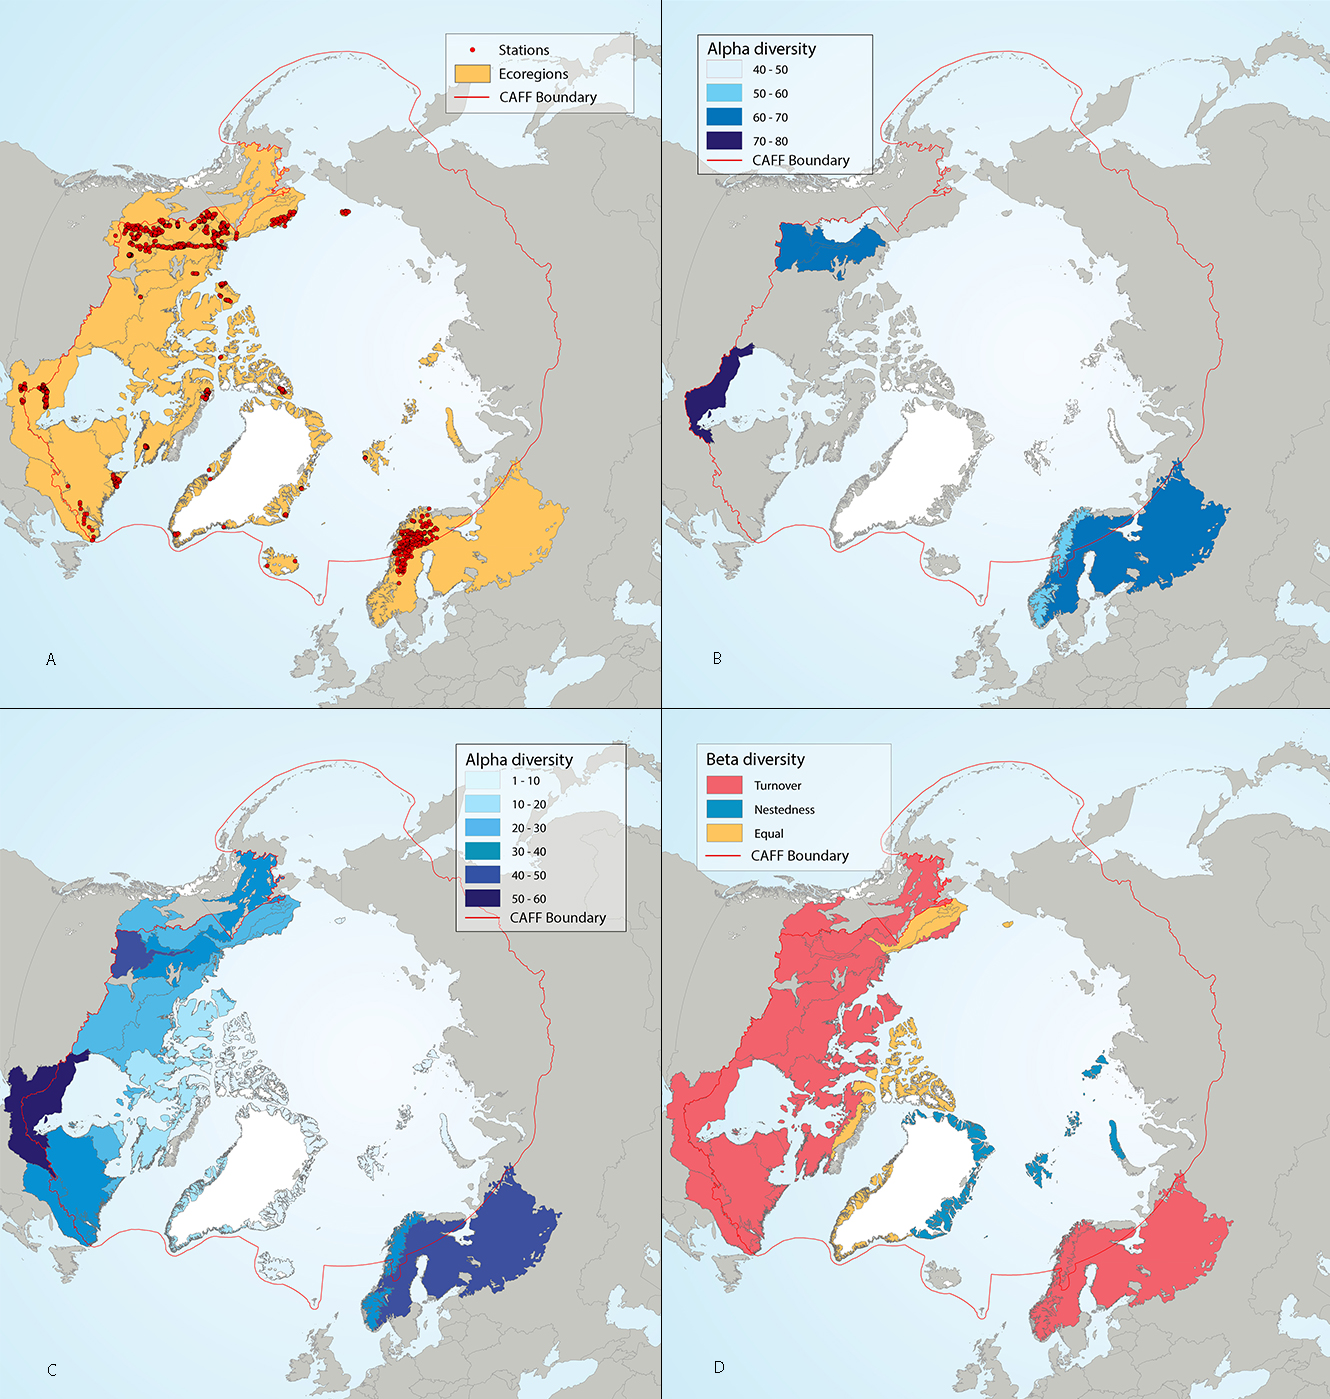
Results of circumpolar assessment of river benthic macroinvertebrates, indicating (a) the location of river benthic macroinvertebrate stations, underlain by circumpolar ecoregions; (b) ecoregions with many river benthic macroinvertebrate stations, colored on the basis of alpha diversity rarefied to 100 stations; (c) all ecoregions with river benthic macroinvertebrate stations, colored on the basis of alpha diversity rarefied to 10 stations; (d) ecoregions with at least two stations in a hydrobasin, colored on the basis of the dominant component of beta diversity (species turnover, nestedness, approximately equal contribution, or no diversity) when averaged across hydrobasins in each ecoregion. State of the Arctic Freshwater Biodiversity Report - Chapter 4 - Page 67 - Figure 4-30
-
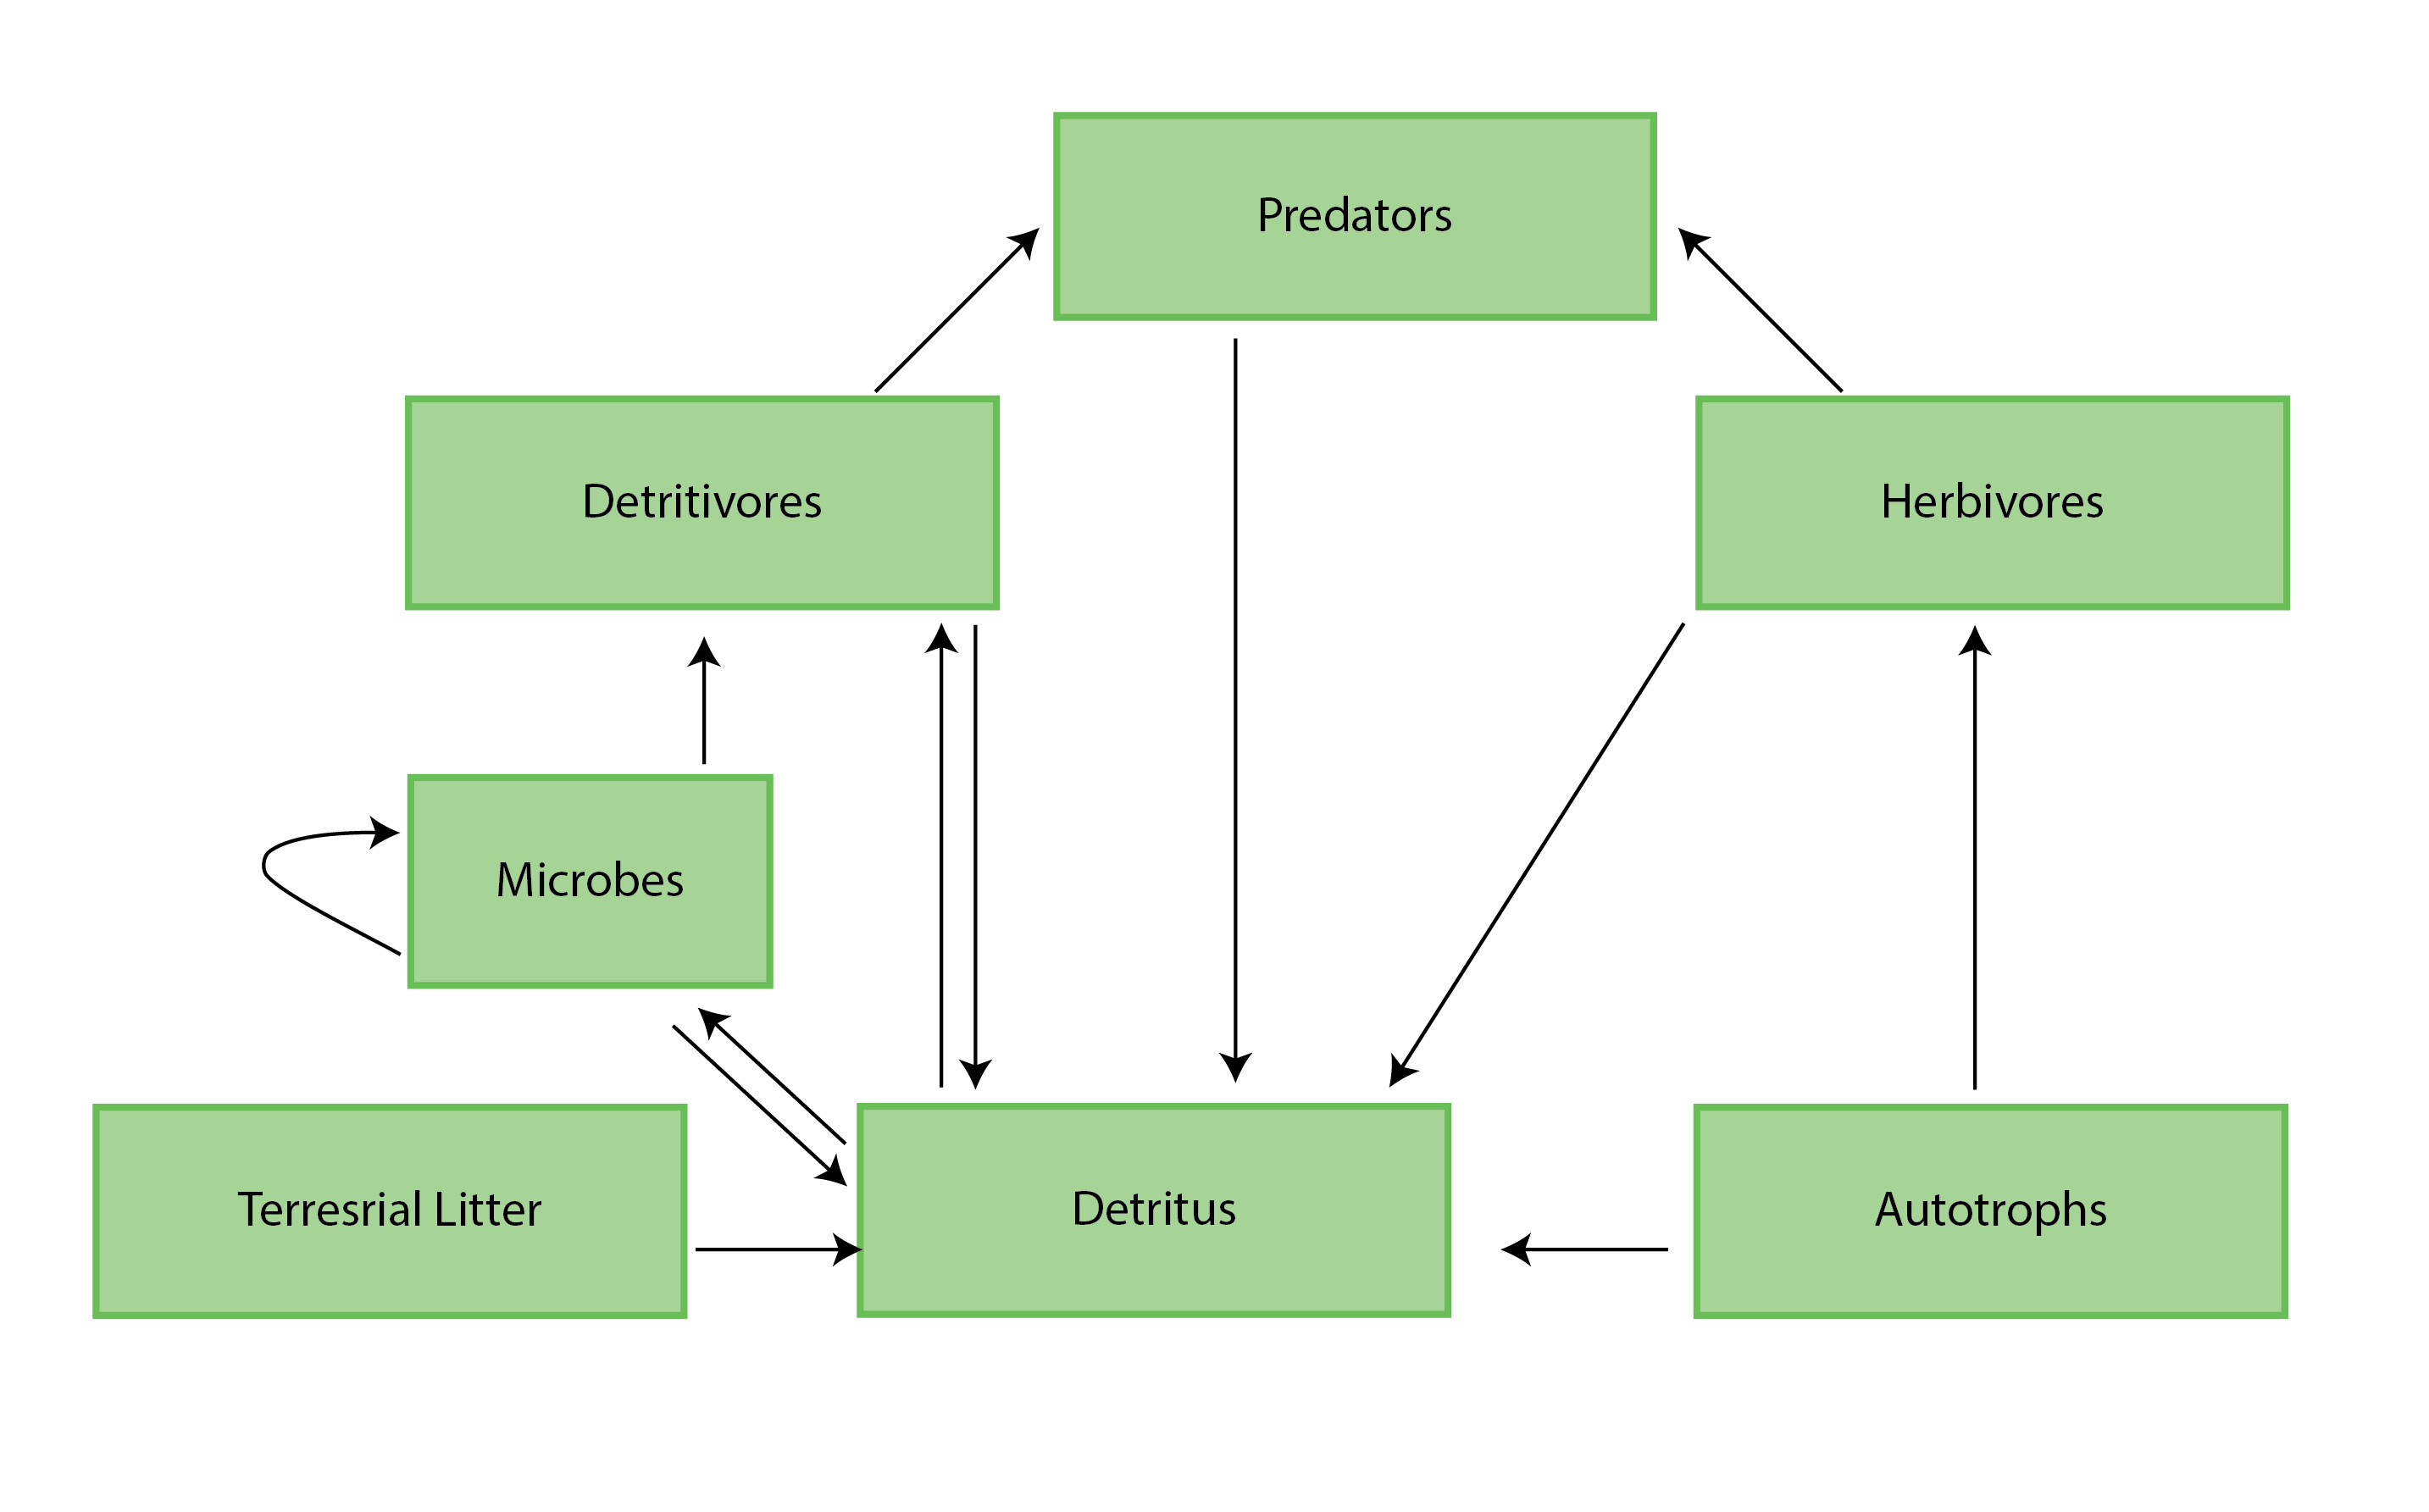
Figure 4-1 A generic food web diagram for a lake or river, indicating the basic trophic levels (boxes) and energy flow (arrows) between those levels. Reproduced from Culp et al. (2012a). State of the Arctic Freshwater Biodiversity Report - Chapter 4 - Page 25 - Figure 4-1
-
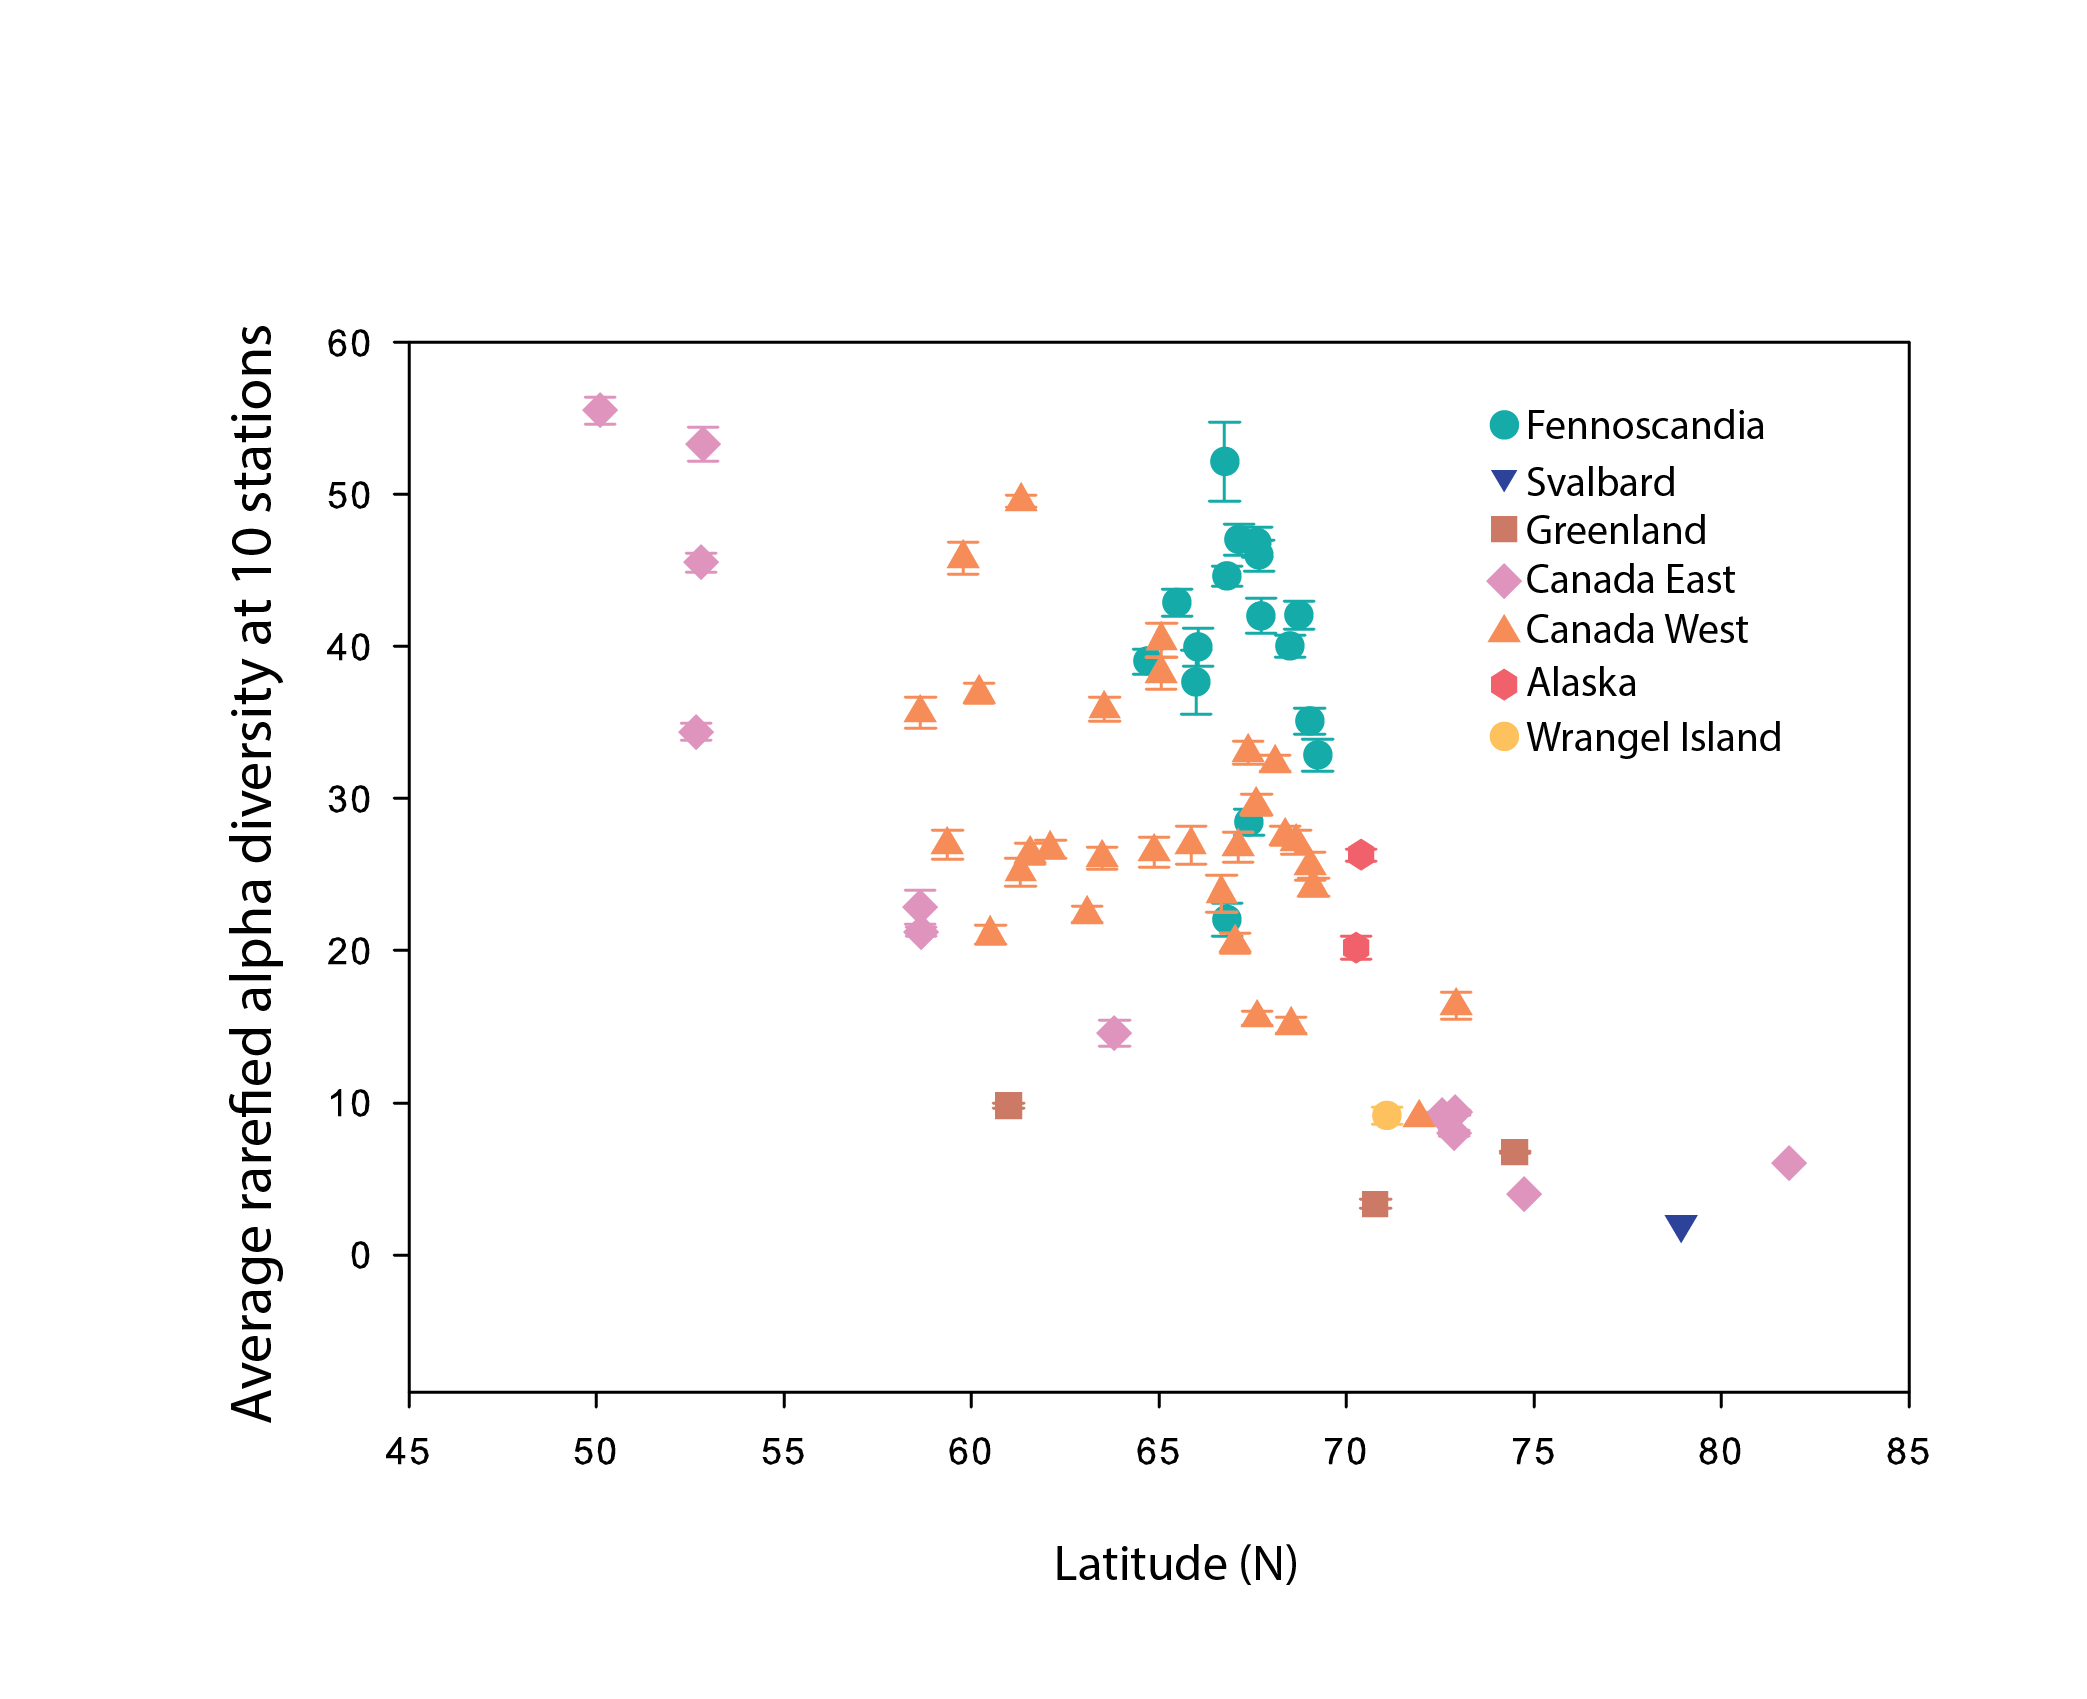
Alpha diversity (rarefied to 10 stations, with error bars indicating standard error) of river benthic macroinvertebrates plotted as a function of the average latitude of stations in each hydrobasin. Hydrobasins are coloured based on country/region State of the Arctic Freshwater Biodiversity Report - Chapter 4 - Page 68 - Figure 4-32
-
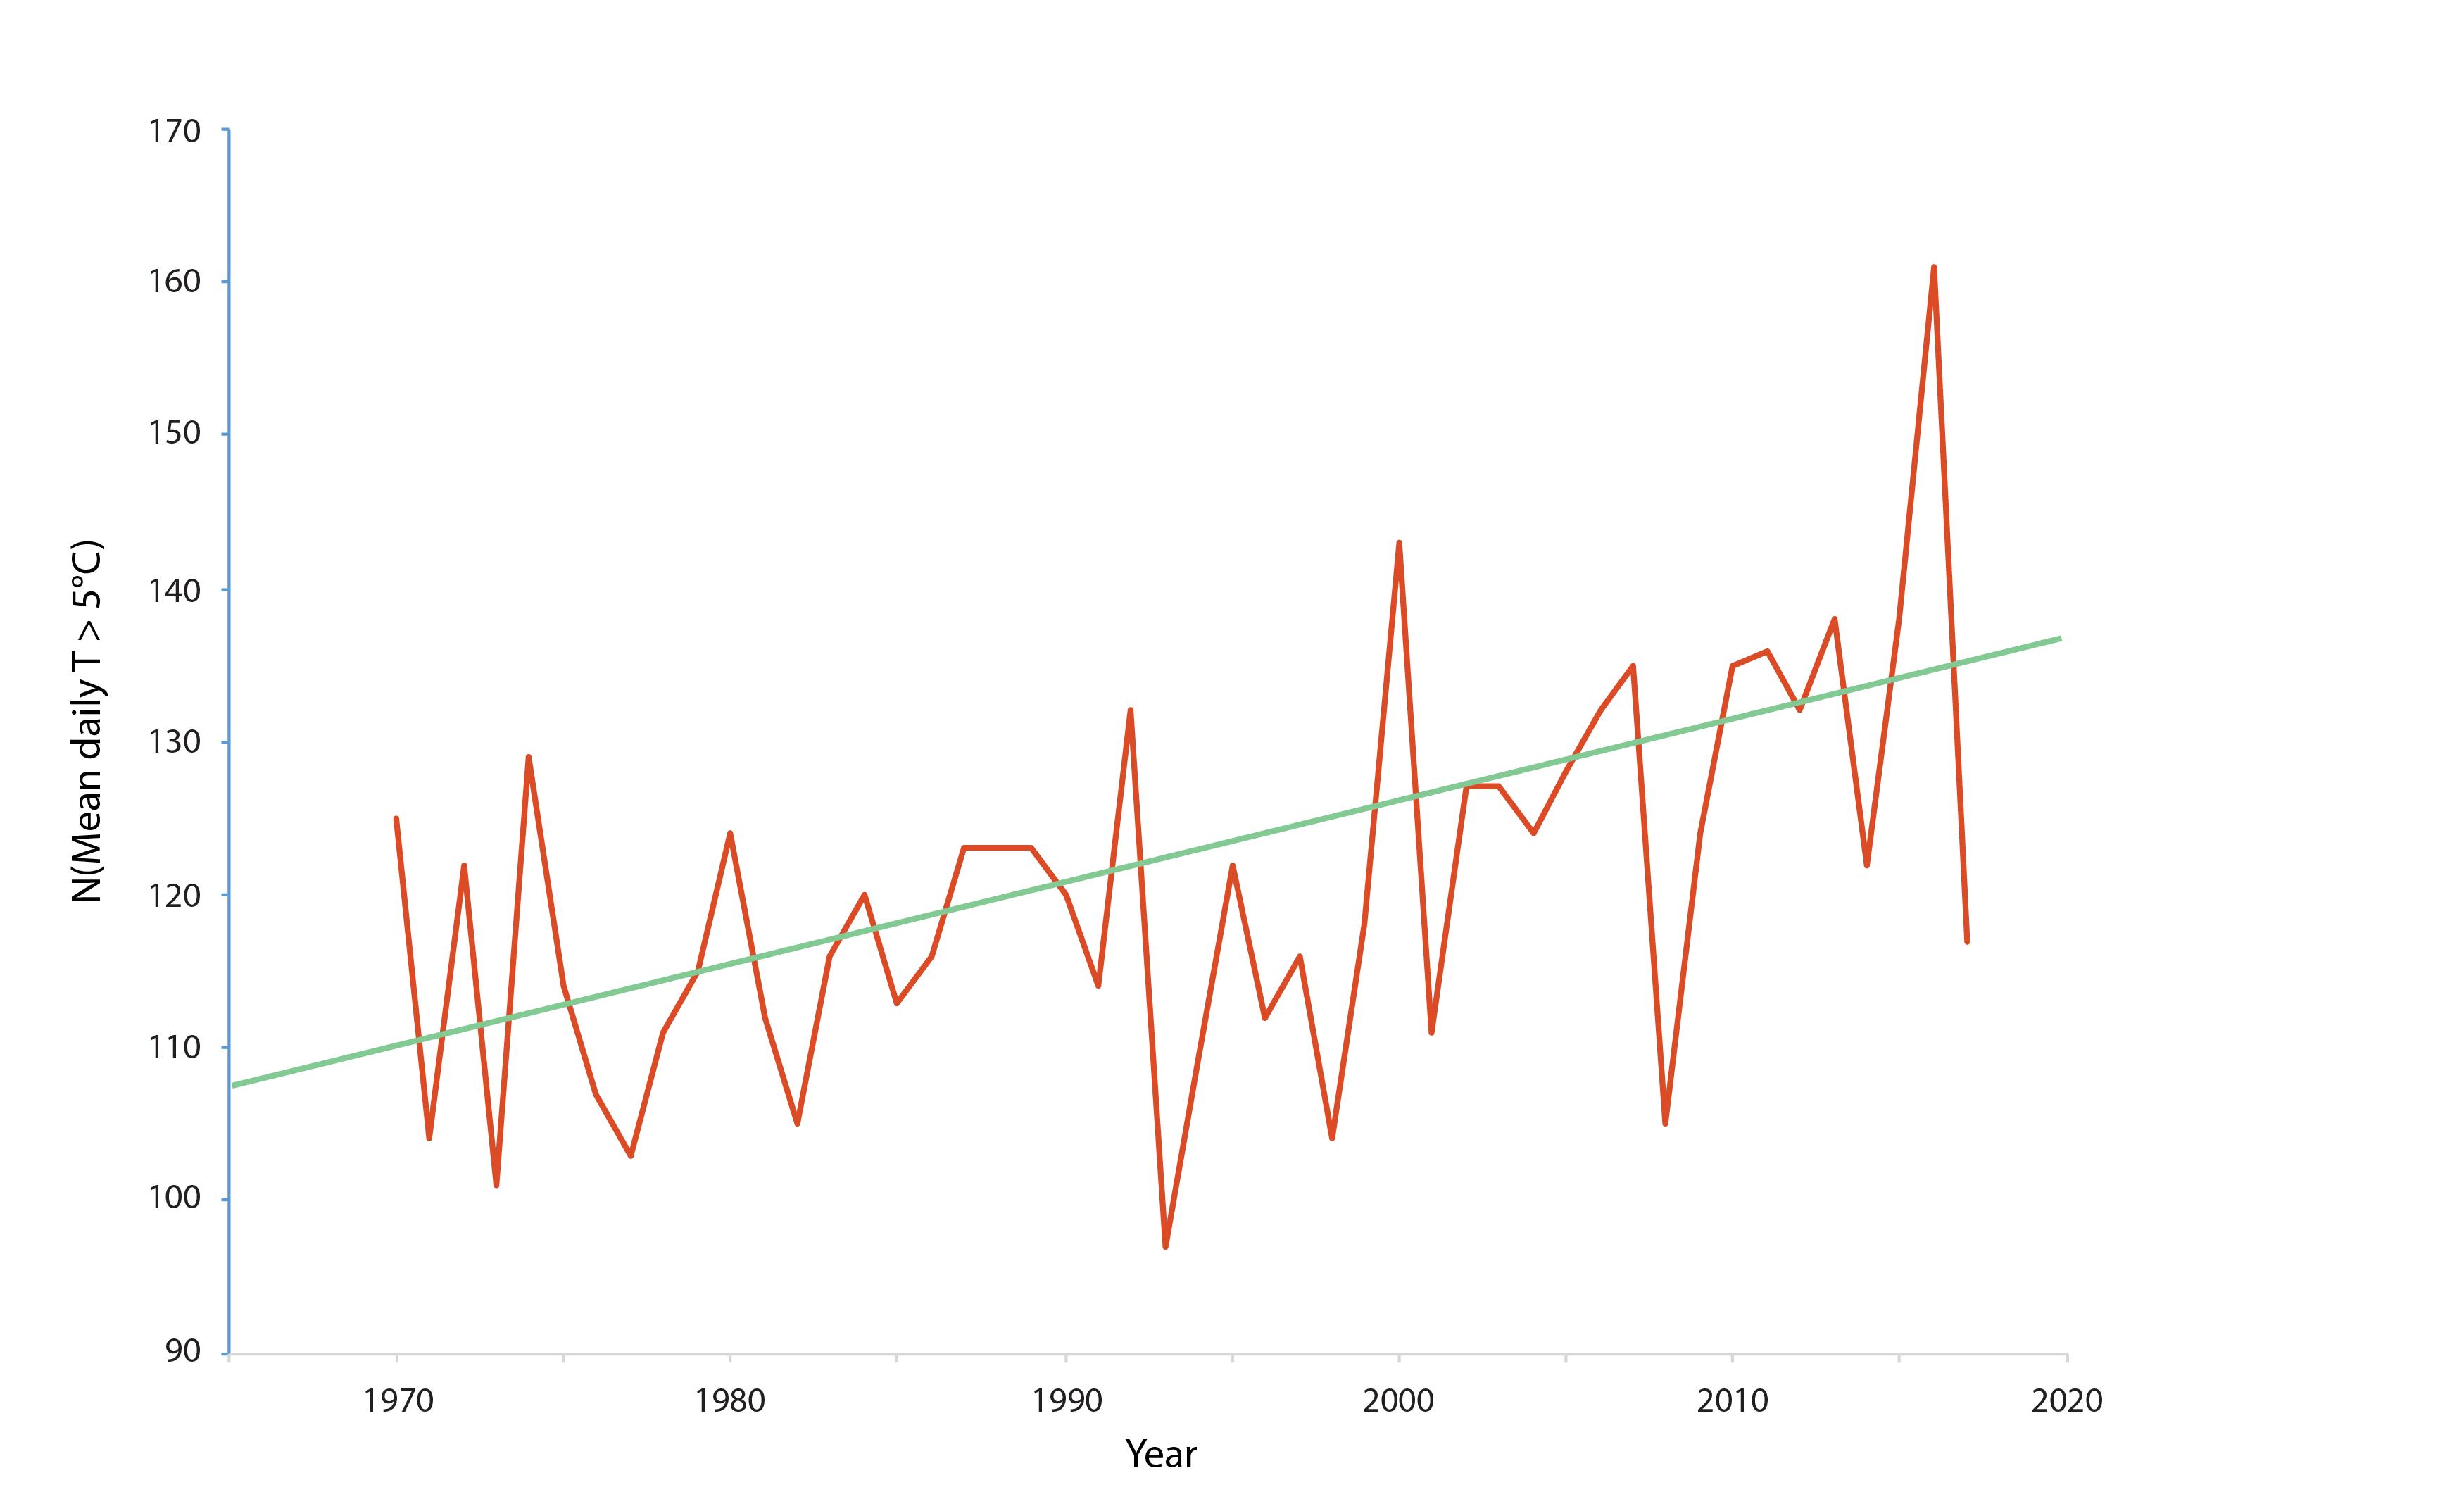
Figure 3-2 Long-term water temperature trends (1970–2017) for the Utsjoki Nuorgam station in the River Tana (69°N in Finland). The diagram shows the number of days per year with a mean temperature exceeding 5°C. The data show that from 1995 to 2017, this indicator increased by over 0.5 days per year. Data source: Finnish Meteorological Institute. State of the Arctic Freshwater Biodiversity Report - Chapter 3 - Page 15 - Figure 2-1
-
The main objectives of the MVAP Project is to produce aerial photography of the Mackenzie Delta development area and Mackenzie Gas Project route to Alberta. The spatial data set has been produced to meet the mapping needs of regulators: for issuing permits and licenses, and for environmental impacts assessment of industry development in the delta and Mackenzie pipeline corridor area. MVAP data acts as a baseline mapping tool to monitor change due to climate fluctuations and/or impacts from economic development. MVAP orthophoto tiles can be used as layers in Geographic Information Systems, for earth science analysis or for display purposes. MVAP orthophoto tiles are used to monitor permafrost changes, habitat mapping and geomorphology studies in the Mackenzie River valley and delta, Northwest Territories. Aerial Photography: scale 1:3,000 Time: August 2004 Two contractors produced the orthophotos: UMA utilised the BAE Socet Set software for the DEM collection. This software is functionally similar to the Intergraph software used by Geosys and Mapcon. Mapcon's Salt Lake City office has been using the BAE software for a number of years and has a lot of experience with this tool. UMA says they collect a 120 m point spacing. They then supplement this with the manually collected breaklines and special points at locations such as hilltops, bottom of depressions, etc. All three of these data sets are used to generate first a 60 m then a 30 m point spacing grid. UMA uses the PCI OrthoEngine software for the orthophoto rectifications. They then use the ER Mapper software for the mosaicing of the individual rectifications Geosys used the Intergraph collection software for the DEM collection. They segmented the project into areas they felt were compatible with the use of the Intergaph auto-correlation software package ISAE and those requiring manual collection. In the ISAE areas a 12 m point spacing was collected automatically. In the other areas a 120 m point spacing was collected. Both of these datasets were supplemented with manually collected breaklines. Geosys uses the Inpho OrthoMaster software for the orthophoto generation and OrthoVista for radiometric image balancing and mosaicing. Imagery was processes as groups so as to ensure balance between adjacent image tiles.
-

COURDO program sampling points, stream quality, Aquatic environment monitoring network.**This third party metadata element was translated using an automated translation tool (Amazon Translate).**
-
COURDO SPÉCIAL program sampling points, watercourse quality, Aquatic environment monitoring network.**This third party metadata element was translated using an automated translation tool (Amazon Translate).**
-

This theme presents the index of water health along the banks of the St. Lawrence River. It makes it possible to determine if the sites present risks to human health and if they are suitable for swimming. These data are the result of an exploratory monitoring program that aims to raise awareness among the population and local actors about the possible reopening of bathing sites that have good potential. This program also makes it possible to highlight any improvement in bacteriological quality resulting from the reduction of wastewater overflows during rainy weather or resulting from the installation of disinfection equipment.**This third party metadata element was translated using an automated translation tool (Amazon Translate).**
-

The purpose of this feature layer is to provide the 2009 overland flooding boundary in the Red River Valley. This dataset shows the extent of peak overland flooding in the Red River Valley in 20 09 . Data is based on RADARSAT – 1 satellite imagery. During processing, the raw data set was resampled to 12.5 meter pixel resolution, then classified using PCI Geomatica software which is a specialized software designed to manipulate space born imagery. The final output depicting the flooding boundary is available as a TIFF or Shapefile. Launched in November 1995, RADARSAT-1 was a Canadian-led project which provided useful information to both commercial and scientific users in such fields as disaster management, agriculture, cartography, hydrology, forestry, oceanography, ice studies and coastal monitoring. Equipped with a powerful synthetic aperture radar (SAR) instrument, it acquired images of the Earth day or night, in all weather and through cloud cover, smoke and haze. As of March 2013, the satellite was declared non-operational and is no longer collecting data. Many applications were developed to take advantage of RADARSAT-1 capacity for detecting the presence of water. These included monitoring flooding and the build-up of river ice, and mapping the melting of snow-covered areas. When used for flood monitoring, RADARSAT-1 data helped assess the impact of flooding, predicted the extent and duration of floodwaters, analyzed the environmental impact of water diversion projects, and developed flood mitigation measures. Fields Included:FID : Internal feature numberNAME : Flooded area nameAREA_SQKM : Size of flooded area
-
Geometric and conventional representation of the hydrographic network. The 3D hydrographic layer is represented by several natural or physical elements associated with the presence of water. These elements form part of the layers in the digital cartographic compilation.**This third party metadata element was translated using an automated translation tool (Amazon Translate).**