 Arctic SDI catalogue
Pesticides
Type of resources
Available actions
Topics
Keywords
Contact for the resource
Provided by
Years
Formats
Representation types
Update frequencies
status
Service types
Scale
-
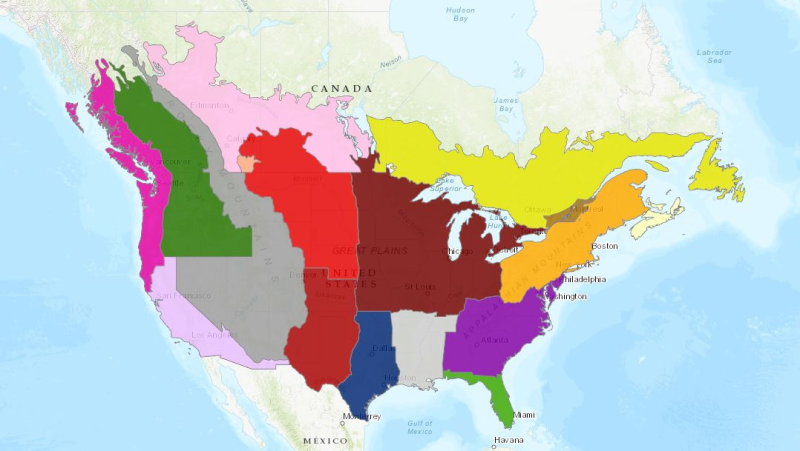
There are fourteen major and four minor field trial regions in Canada and USA. Each of these regions recognizes physical characteristics, such as soils, and crops and climate, that make the region unique. The subzones address differences within a region, generally reflected in the types of crops grown in that region. The Canadian regions, as much as possible, correspond to the U.S. regions. The trial regions contain number of field trials by specific crop.
-
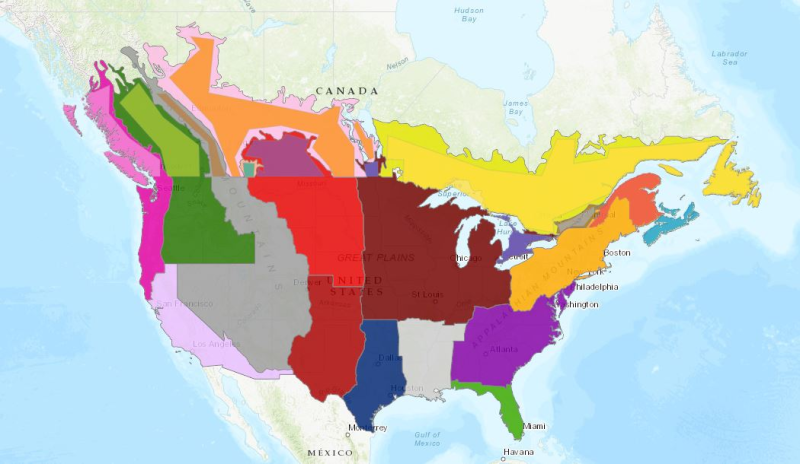
The Canadian major and minor crop field trial regions were developed following extensive stakeholder consultation and have been harmonized between the Pest Management Regulatory Agency (PMRA) and the Environmental Protection Agency of the USA. The Canadian major and minor crop field trial regions were delineated, using the geographic information system (GIS) data processing hardware and software facilities in Spatial Analysis and Geomatics Applications (SAGA), Agriculture Division, Statistics Canada. In general, the delineation process involved integration, evaluation and reference to numerous geographic data sources in a GIS to determine the best sources for the delineation. There are seven major and four minor field trial regions. Each of these regions recognizes physical characteristics, such as soils, and crops and climate, that make the region unique within the Canadian agricultural landscape. The subzones address differences within a region, generally reflected in the types of crops grown in that region. The Canadian regions, as much as possible, correspond to the U.S. regions
-
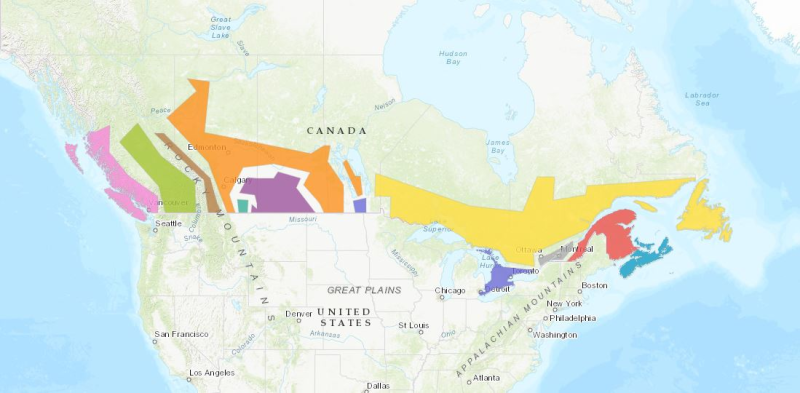
The Canadian major and minor crop field trial regions were developed following extensive stakeholder consultation and have been harmonized between the Pest Management Regulatory Agency (PMRA) and the Environmental Protection Agency of the USA. The identified regions are used for experimental studies in support of residue chemistry data requirements for the registration of new pesticide uses. The regions are based on soil type and climate and do not correspond to plant hardiness zones.
-
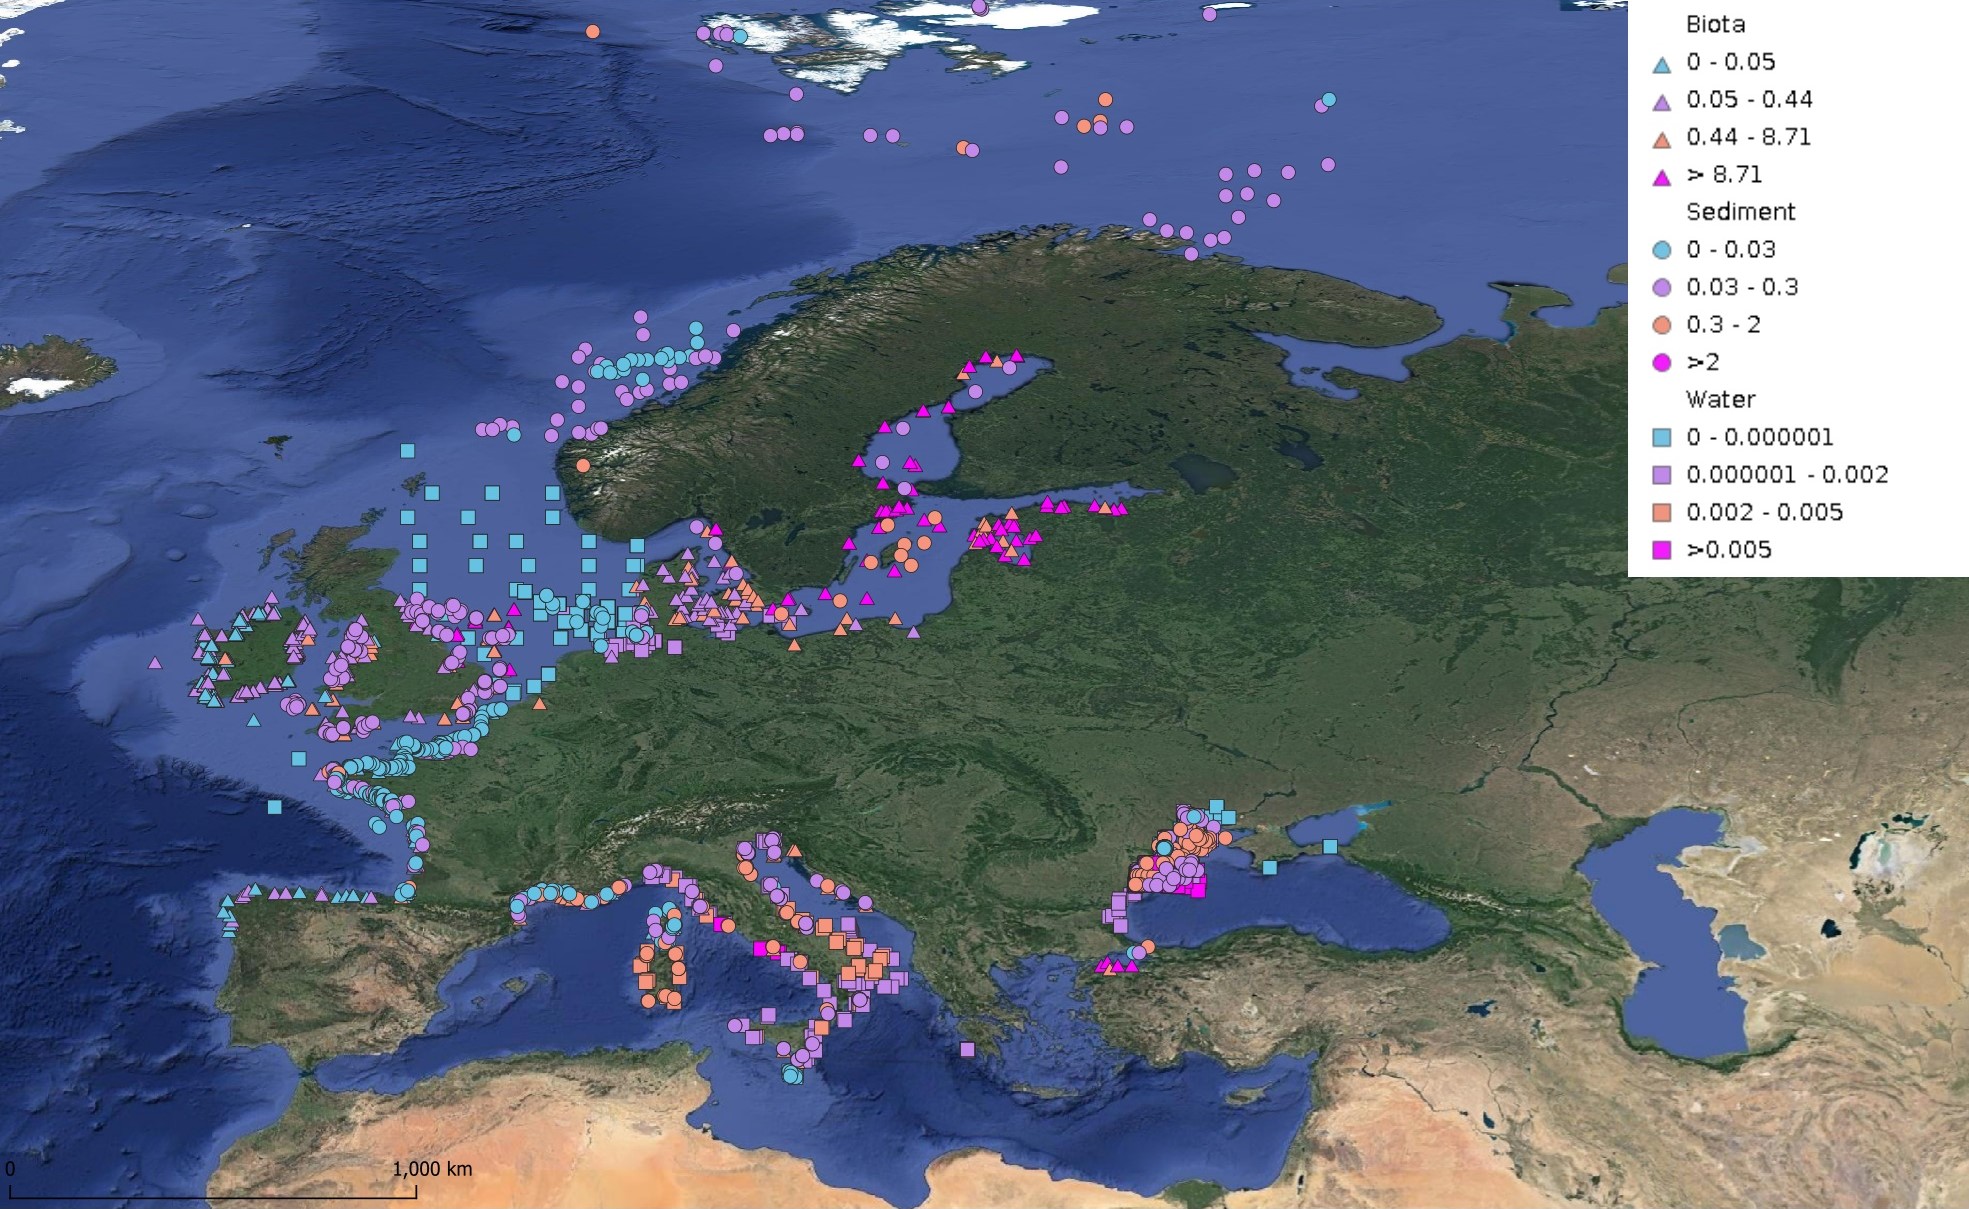
This product displays for DDT, DDE, and DDD, median values since 2012 that have been measured per matrix and are present in EMODnet regional contaminants aggregated datasets, v2024. The median values ranges are derived from the following percentiles: 0-25%, 25-75%, 75-90%, >90%. Only "good data" are used, namely data with Quality Flag=1, 2, 6, Q (SeaDataNet Quality Flag schema). For water, only surface values are used (0-15 m), for sediment and biota data at all depths are used.
-
EMODnet Chemistry aims to provide access to marine chemistry datasets and derived data products concerning eutrophication, acidity and contaminants. The importance of the selected substances and other parameters relates to the Marine Strategy Framework Directive (MSFD). This aggregated dataset contains all unrestricted EMODnet Chemistry data on potential hazardous substances, despite the fact that some data might not be related to pollution (e.g. collected by deep corer). Temperature, salinity and additional parameters are included when available. It covers the Norwegian Sea, Barents Sea, Greenland Sea and Icelandic Waters. Data were harmonised and validated by the 'Institute of Marine Research - Norwegian Marine Data Centre (NMD)' in Norway. The dataset contains water and sediment profiles. The temporal coverage is 1974–2011 for water measurements and 1974–2021 for sediment measurements. Regional datasets concerning contaminants are automatically harvested and the resulting collections are harmonised and validated using ODV Software and following a common methodology for all sea regions ( https://doi.org/10.6092/8b52e8d7-dc92-4305-9337-7634a5cae3f4 ). Parameter names are based on P01 vocabulary, which relates to BODC Parameter Usage Vocabulary and is available at: https://vocab.nerc.ac.uk/search_nvs/P01/ . The harmonised dataset can be downloaded as as an ODV spreadsheet, which is composed of a metadata header followed by tab separated values. This spreadsheet can be imported into ODV Software for visualisation (more information can be found at: https://www.seadatanet.org/Software/ODV ). In addition, the same dataset is offered also as a txt file in a long/vertical format, in which each P01 measurement is a record line. Additionally, there are a series of columns that split P01 terms into subcomponents (substance, CAS number, matrix...).This transposed format is more adapted to worksheet applications (e.g. LibreOffice Calc).
-
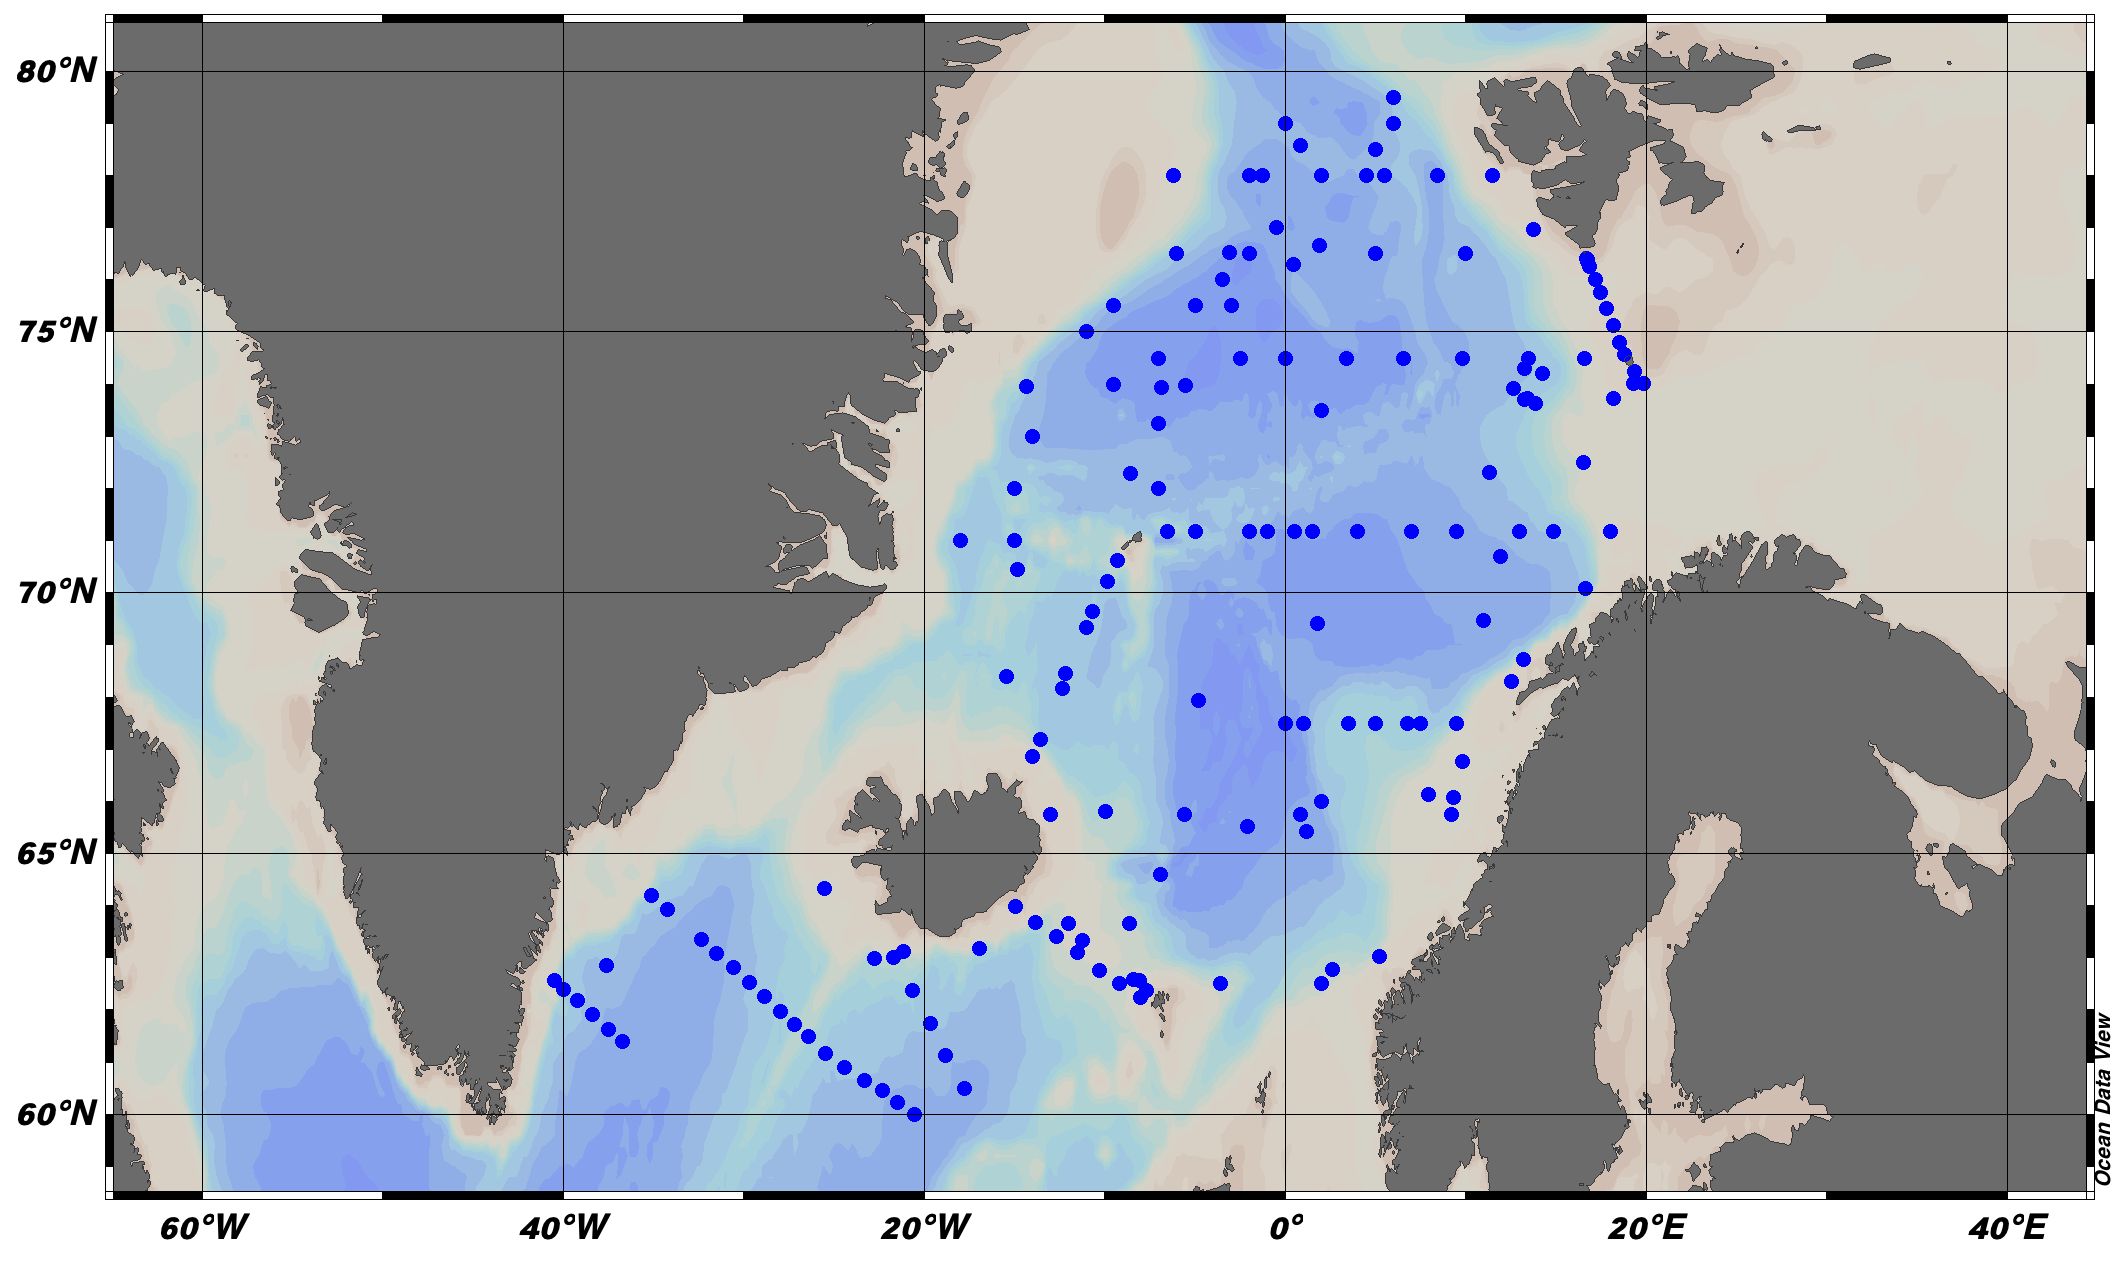
This product displays for Hexachlorobenzene, positions with values counts that have been measured per matrix for each year and are present in EMODnet regional contaminants aggregated datasets, v2024. The product displays positions for every available year.
-
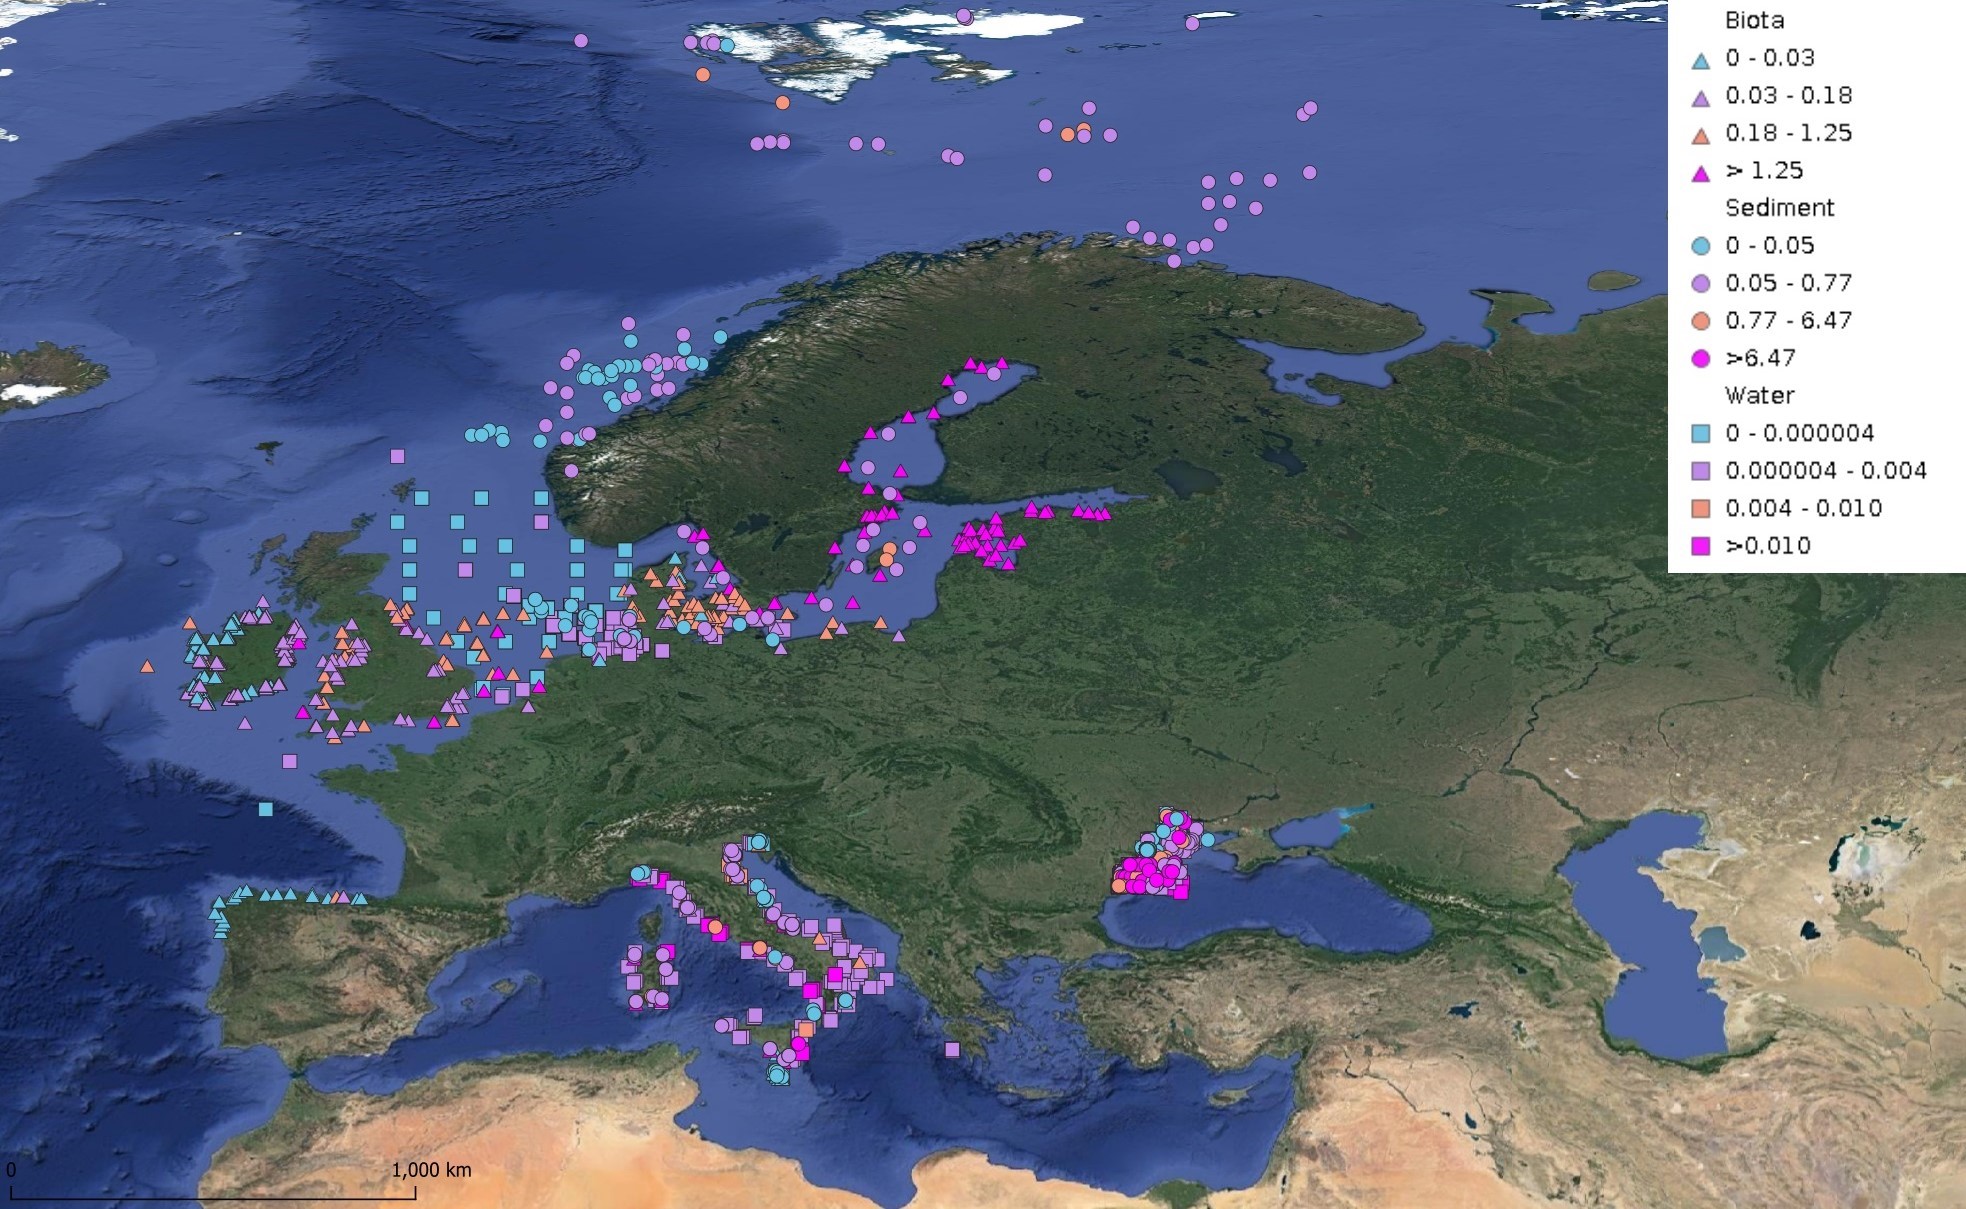
This product displays for Hexachlorobenzene, median values since 2012 that have been measured per matrix and are present in EMODnet regional contaminants aggregated datasets, v2024. The median values ranges are derived from the following percentiles: 0-25%, 25-75%, 75-90%, >90%. Only "good data" are used, namely data with Quality Flag=1, 2, 6, Q (SeaDataNet Quality Flag schema). For water, only surface values are used (0-15 m), for sediment and biota data at all depths are used.
-

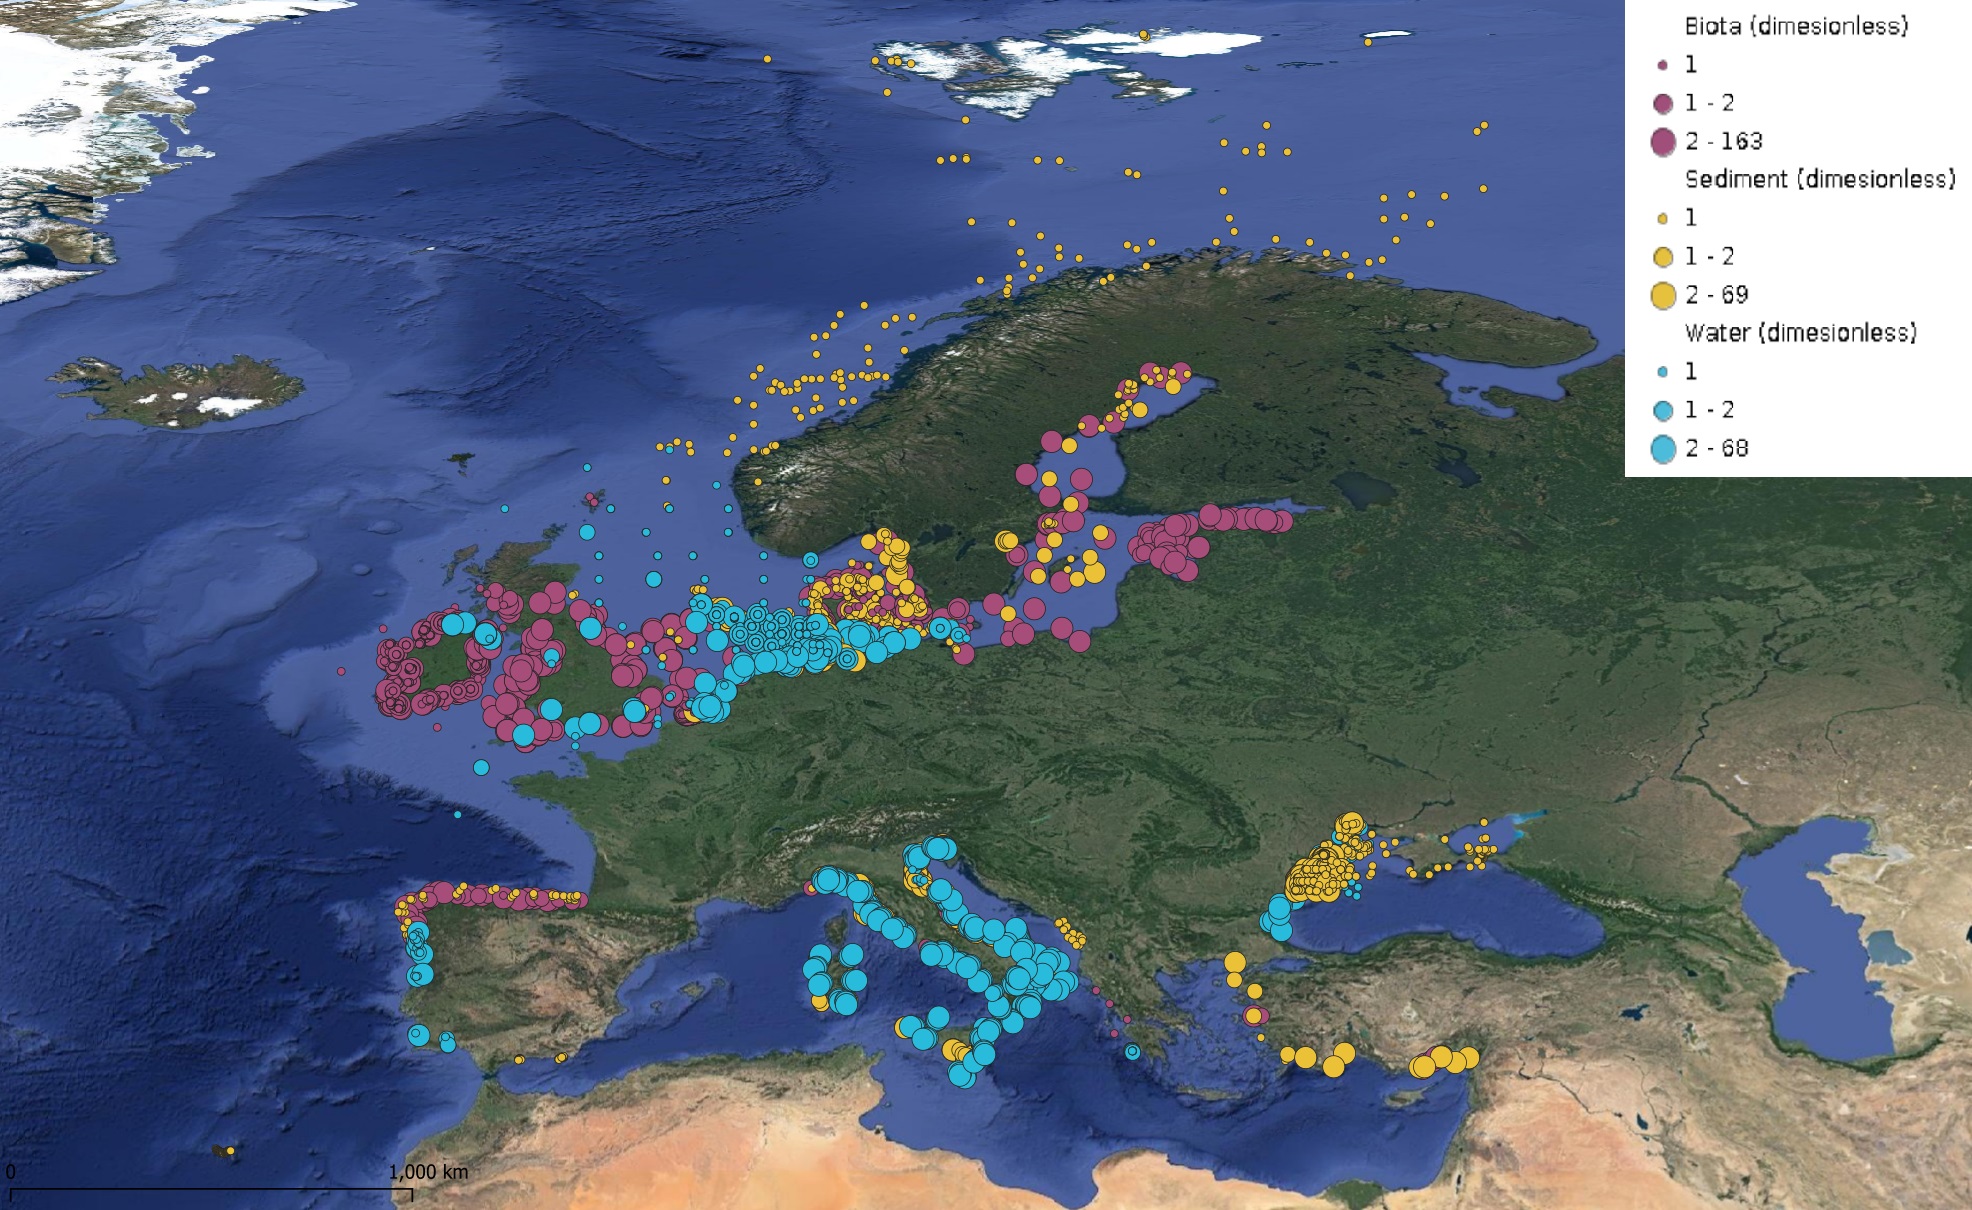
This product displays for Hexachlorobenzene, positions with percentages of all available data values per group of animals that are present in EMODnet regional contaminants aggregated datasets, v2022. The product displays positions for all available years.
-
Long-term freshwater quality data from over 200 federal and federal-provincial sampling sites at various locations and sampling frequencies throughout Canada's aquatic ecosystems are included in this dataset. Measurements regularly include physical-chemical parameters such as temperature, pH, alkalinity, major ions, nutrients and metals. Collection includes data from active sites, as well as historical sites that have a period of record suitable for trend analysis. The number of sites in the network varies slightly from year-to-year, as sites are adjusted according to a risk-based adaptive management framework. The Great Lakes are sampled on a rotation basis and not all sites are sampled every year. Data are collected to meet federal commitments related to transboundary watersheds (rivers and lakes crossing international, inter-provincial and territorial borders) or under authorities such as the Department of the Environment Act, the Canada Water Act, the Canadian Environmental Protection Act, 1999, the Federal Sustainable Development Strategy, or to meet Canada's commitments under the 1969 Master Agreement on Apportionment./Les données de monitoring de la qualité de l'eau douce à long terme de plus de 200 sites d'échantillonnage fédéraux et fédéraux-provinciaux à diverses stations et fréquences d'échantillonnage à travers les écosystèmes aquatiques du Canada sont incluses dans cet ensemble de données. Les mesures incluent régulièrement les paramètres physico-chimiques tels que la température, le pH, l'alcalinité, les ions majeurs, les nutriments et les métaux. La collection inclut des données des sites actifs, ainsi que des sites historiques qui possèdent une période d'enregistrement propice à l'analyse des tendances. Le nombre de sites dans le réseau varie légèrement d'une année à l'autre, puisque les sites sont ajustés selon un cadre de travail de gestion adaptative basée sur le risque. Les Grands Lacs sont échantillonnés sur une base rotationnelle et tous les sites ne sont pas échantillonnés à chaque année. Les données sont recueillies afin de rencontrer les engagements fédéraux relatifs aux bassins versants transfrontaliers (rivières et lacs traversant des frontières internationales, interprovinciales et territoriales) ou sous certaines autorités telles que la Loi sur le ministère de l'Environnement, la Loi sur l'environnement, la Loi sur les ressources en eau du Canada, la Loi canadienne sur la protection de l'environnement de 1999, la stratégie fédérale de développement durable, ou pour rencontrer les engagements du Canada dans le cadre de l'Accord cadre sur la répartition des eaux des Prairies de 1969.
-
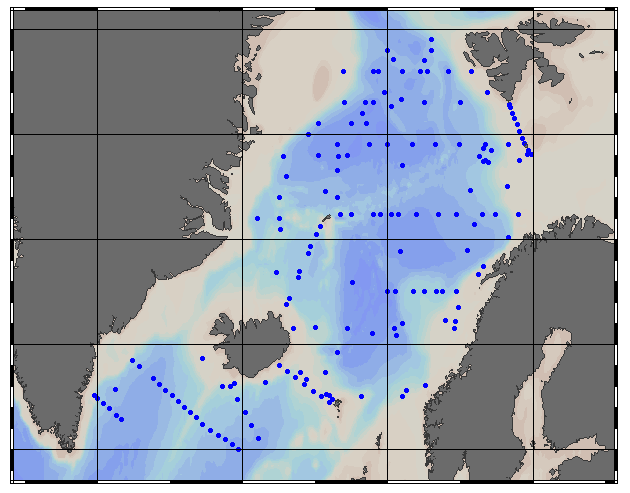
EMODnet Chemistry aims to provide access to marine chemistry data sets and derived data products concerning eutrophication, ocean acidification and contaminants. The chemicals chosen reflect importance to the Marine Strategy Framework Directive (MSFD). This regional aggregated dataset contains all unrestricted EMODnet Chemistry data on contaminants; temperature, salinity and additional sampling parameters are included when available. The spatial coverage is the Arctic Ocean with 780 CDI records divided per matrices: 249 water profiles and 531 sediment profiles. For water, vertical profiles temporal range is from 1974-03-25 to 2011-08-24. For sediment, vertical profiles temporal range is from 1974-08-07 to 2017-10-26. Data were aggregated and quality controlled by ‘Institute of Marine Research - Norwegian Marine Data Centre (NMD)’ from Norway. Regional datasets concerning contaminants are automatically harvested. Parameter names in these datasets are based on P01, BODC Parameter Usage Vocabulary, which is available at: https://vocab.seadatanet.org/p01-facet-search. Each measurement value has a quality flag indicator. The resulting data collections for each Sea Basin are harmonised, and the collections are quality controlled by EMODnet Chemistry Regional Leaders using ODV Software and following a common methodology for all Sea Regions. Harmonisation means that: (1) unit conversion is carried out to express contaminant concentrations with a limited set of measurement units (according to EU directives 2013/39/UE; Comm. Dec. EU 2017/848) and (2) merging of variables described by different “local names” ,but corresponding exactly to the same concepts in BODC P01 vocabulary. Detailed documentation is available at: https://doi.org/10.6092/8b52e8d7-dc92-4305-9337-7634a5cae3f4 Explore and extract data at: https://emodnet-chemistry.webodv.awi.de/contaminants%3EArctic The harmonised dataset can also be downloaded as ODV spreadsheet (TXT file), which is composed of metadata header followed by tab separated values. This worksheet can be imported to ODV Software for visualisation (More information can be found at: https://www.seadatanet.org/Software/ODV ). The same dataset is offered also as TXT file in a long/vertical format, in which each P01 measurement is a record line. Additionally, there are a series of columns that split P01 terms in subcomponents (measure, substance, CAS number, matrix...).This transposed format is more adapted to worksheet applications users (e.g. LibreOffice Calc). The original datasets can be searched and downloaded from EMODnet Chemistry Chemistry CDI Data and Discovery Access Service: https://emodnet-chemistry.maris.nl/search