 Arctic SDI catalogue
Renewable energy
Type of resources
Available actions
Topics
Keywords
Contact for the resource
Provided by
Formats
Representation types
Update frequencies
status
-

644 datasets of hourly meteorological data for all of Canada from various periods (1998 to 2020). The values of the records for solar irradiance are primarily based on satellite-derived solar estimates. This dataset has been updated with the most recent changes made in March 2023. The solar values in these files are based on 0.1° x 0.1° (11 km x 11 km grid) for all of Canada. Refer to Data Resources below for additional information on the CWEEDS file format and revision history.
-

Average of the hourly Direct Normal Irradiance (DNI) over 17 years (1998-2014). Data extracted from the National Solar Radiation Database (NSRDB) developed using the Physical Solar Model (PSM) by National Renewable Energy Laboratory ("NREL"), Alliance for Sustainable Energy, LLC, U.S. Department of Energy ("DOE"). The current version of the National Solar Radiation Database (NSRDB) (v2.0.1) was developed using the Physical Solar Model (PSM), and offers users the solar resource datasets from 1998 to 2014). The NSRDB comprises 30-minute solar and meteorological data for approximately 2 million 0.038-degree latitude by 0.038-degree longitude surface pixels (nominally 4 km2). The area covered is bordered by longitudes 25° W on the east and 175° W on the west, and by latitudes -20° S on the south and 60° N on the north. The solar radiation values represent the resource available to solar energy systems. The AVHRR Pathfinder Atmospheres-Extended (PATMOS-x) model uses half-hourly radiance images in visible and infrared channels from the GOES series of geostationary weather satellites, a climatological albedo database and mixing ratio, temperature and pressure profiles from Modern Era-Retrospective Analysis (MERRA) to generate cloud masking and cloud properties. Cloud properties generated using PATMOS-x are used in fast radiative transfer models along with aerosol optical depth (AOD) and precipitable water vapor (PWV) from ancillary sources to estimate Direct Normal Irradiance (DNI) and Global Horizontal Irradiance (GHI). A daily AOD is retrieved by combining information from the MODIS and MISR satellites and ground-based AERONET stations. Water vapor and other inputs are obtained from MERRA. For clear sky scenes the direct normal irradiance (DNI) and GHI are computed using the REST2 radiative transfer model. For cloud scenes identified by the cloud mask, Fast All-sky Radiation Model for Solar applications (FARMS) is used to compute the GHI. The DNI for cloud scenes is then computed using the DISC model. The data in this layer is an average of the hourly GHI over 17 years (1998-2014). NOTE: The Geographical Information System (GIS) data and maps for solar resources for Global Horizontal Irradiance (GHI) and Direct Normal Irradiance (DNI) were developed by the U.S. National Renewable Energy Laboratory (NREL) and provided for Canada as an estimate. At present, neither the NREL data, nor the Physical Solar Model (PSM) on which the NREL data is based, have been either assessed or validated for the particular Canadian weather applications. A Canadian GHI map developed by the department of Natural Resources Canada (NRCan) is based on the State University of New York (SUNY) model and has been assessed and validated for the particular Canadian weather applications. The Canadian GHI map is available at http://atlas.gc.ca/cerp-rpep/en/.
-

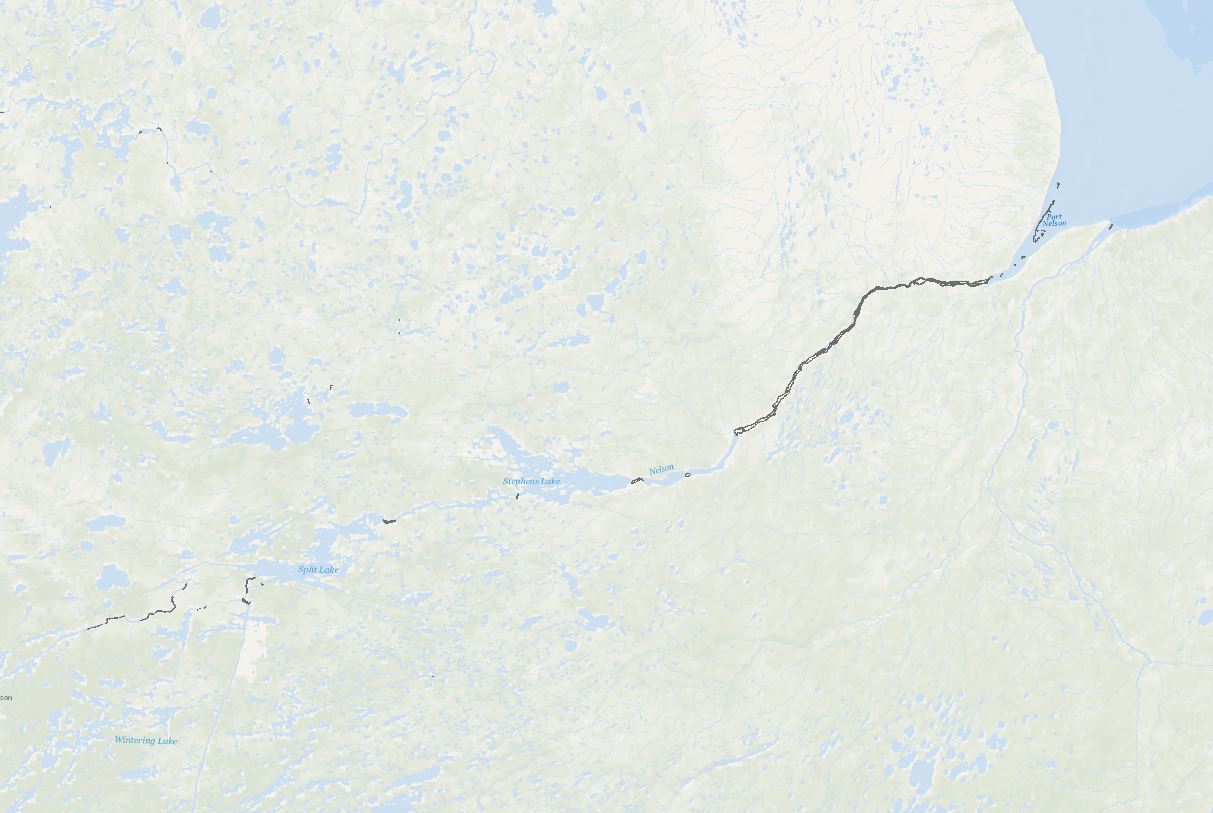
This dataset uses RADARSAT Constellation Mission (RCM) Synthetic Aperture Radar (SAR) satellite images to identify open water regions within ice-covered rivers during winter, with the aim to assess hydrokinetic resources near remote communities reliant on diesel fuel for electricity generation. The data is processed with the HyRASS, a machine learning-based SAR image processing and classification algorithm. Disclaimer: This dataset was designed to identify open water regions within ice-covered rivers for assessing hydrokinetic resources near remote communities reliant on diesel fuel for electricity generation and is subject to the following limitations: • This dataset was derived from RADARSAT Constellation Mission (RCM) Synthetic Aperture Radar (SAR) satellite images. While these images are generally reliable, they are subject to inherent limitations, including resolution constraints, potential distortion, and occasional inaccuracies in real-time conditions capture. • The HyRASS algorithm is designed to pinpoint open water areas using satellite images, with a particular emphasis on RCM quad polarization (QP) imagery. This specialization means that its effectiveness depends on the accessibility of this specific type of imagery. Consequently, the data it produces might not cover a broad spectrum of time periods. For more reliable results, it's essential to classify areas more regularly, ensuring that detected open water regions are consistent over time. This dataset is intended for preliminary assessment and should not be the sole basis for making critical decisions or investments related to hydrokinetic energy projects. Further validation and in-depth analysis are strongly recommended, and users should conduct their own due diligence and additional research to verify the data accuracy and relevance for specific applications. By accessing and using this dataset, users acknowledge and accept these disclaimers. The providers of this dataset explicitly absolve themselves of any responsibility or liability for any consequences arising from the use, reliance upon, or interpretation of this dataset. Users are advised that their use of the dataset is at their own risk, and they assume full responsibility for any actions or decisions made based on the information contained therein. This disclaimer is in accordance with applicable laws and regulations, and by accessing or utilizing the dataset, users agree to release the providers of this dataset from any legal claims, damages, or liabilities that may arise from such use.
-

Average of the hourly Global Horizontal Irradiance (GHI) over 17 years (1998-2014). Data extracted from the National Solar Radiation Database (NSRDB) developed using the Physical Solar Model (PSM) by National Renewable Energy Laboratory ("NREL"), Alliance for Sustainable Energy, LLC, U.S. Department of Energy ("DOE"). The current version of the National Solar Radiation Database (NSRDB) (v2.0.1) was developed using the Physical Solar Model (PSM), and offers users the solar resource datasets from 1998 to 2014). The NSRDB comprises 30-minute solar and meteorological data for approximately 2 million 0.038-degree latitude by 0.038-degree longitude surface pixels (nominally 4 km2). The area covered is bordered by longitudes 25° W on the east and 175° W on the west, and by latitudes -20° S on the south and 60° N on the north. The solar radiation values represent the resource available to solar energy systems. The AVHRR Pathfinder Atmospheres-Extended (PATMOS-x) model uses half-hourly radiance images in visible and infrared channels from the GOES series of geostationary weather satellites, a climatological albedo database and mixing ratio, temperature and pressure profiles from Modern Era-Retrospective Analysis (MERRA) to generate cloud masking and cloud properties. Cloud properties generated using PATMOS-x are used in fast radiative transfer models along with aerosol optical depth (AOD) and precipitable water vapor (PWV) from ancillary sources to estimate Direct Normal Irradiance (DNI) and Global Horizontal Irradiance (GHI). A daily AOD is retrieved by combining information from the MODIS and MISR satellites and ground-based AERONET stations. Water vapor and other inputs are obtained from MERRA. For clear sky scenes the direct normal irradiance (DNI) and GHI are computed using the REST2 radiative transfer model. For cloud scenes identified by the cloud mask, Fast All-sky Radiation Model for Solar applications (FARMS) is used to compute the GHI. The DNI for cloud scenes is then computed using the DISC model. The data in this layer is an average of the hourly GHI over 17 years (1998-2014). NOTE: The Geographical Information System (GIS) data and maps for solar resources for Global Horizontal Irradiance (GHI) and Direct Normal Irradiance (DNI) were developed by the U.S. National Renewable Energy Laboratory (NREL) and provided for Canada as an estimate. At present, neither the NREL data, nor the Physical Solar Model (PSM) on which the NREL data is based, have been either assessed or validated for the particular Canadian weather applications. A Canadian GHI map developed by the department of Natural Resources Canada (NRCan) is based on the State University of New York (SUNY) model and has been assessed and validated for the particular Canadian weather applications. The Canadian GHI map is available at http://atlas.gc.ca/cerp-rpep/en/.
-
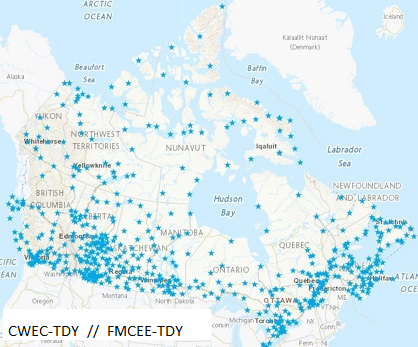
644 datasets of Typical Meteorological Years (TMY) created by joining twelve Typical Meteorological Months selected from a database of up to 20 years of CWEEDS hourly data. The months are chosen by statistically comparing individual monthly means with long-term monthly means for daily total global solar irradiance, mean, minimum and maximum dry bulb temperature, mean, minimum and maximum dew point temperature, and mean and maximum wind speed. These hourly datasets are used by the engineering and scientific community mainly as inputs for solar system design and analysis and building energy systems analysis tools. This dataset has been updated with the most recent changes made in March 2023. The solar values in these files are based on 0.1° x 0.1° (11 km x 11 km grid) for all of Canada. Refer to Data Resources below for additional information on the TMY file format.
-

Offshore wind represents a potentially significant source of low-carbon energy for Canada, and ensuring that relevant, high-quality data and scientifically sound analyses are brought forward into decision-making processes will increase the chances of success for any future deployment of offshore wind in Canada. To support this objective, CanmetENERGY-Ottawa (CE-O), a federal laboratory within Natural Resources Canada (NRCan), completed a preliminary analysis of relevant considerations for offshore wind, with an initial focus on Atlantic Canada. To conduct the analysis, CE-O used geographic information system (GIS) software and methods and engaged with multiple federal government departments to acquire relevant data and obtain insights from subject matter experts on the appropriate use of these data in the context of the analysis. The purpose of this work is to support the identification of candidate regions within Atlantic Canada that could become designated offshore wind energy areas in the future. The study area for the analysis included the Gulf of St. Lawrence, the western and southern coasts of the island of Newfoundland, and the coastal waters south of Nova Scotia. Twelve input data layers representing various geophysical, ecological, and ocean use considerations were incorporated as part of a multi-criteria analysis (MCA) approach to evaluate the effects of multiple inputs within a consistent framework. Six scenarios were developed which allow for visualization of a range of outcomes according to the influence weighting applied to the different input layers and the suitability scoring applied within each layer. This preliminary assessment resulted in the identification of several areas which could be candidates for future designated offshore wind areas, including the areas of the Gulf of St. Lawrence north of Prince Edward Island and west of the island of Newfoundland, and areas surrounding Sable Island. This study is subject to several limitations, namely missing and incomplete data, lack of emphasis on temporal and cumulative effects, and the inherent subjectivity of the scoring scheme applied. Further work is necessary to address data gaps and take ecosystem wide impacts into account before deployment of offshore wind projects in Canada’s coastal waters. Despite these limitations, this study and the data compiled in its preparation can aid in identifying promising locations for further review. A description of the methodology used to undertake this study is contained in the accompanying report, available at the following link: https://doi.org/10.4095/331855. This report provides in depth detail into how these data layers were compiled and details any analysis that was done on the data to produce the final data layers in this package.
-

Natural Resources Canada’s Major Projects Inventory published annually, provides a snapshot of major natural resource projects in Canada that are either currently under construction or are planned within the next 10 years. The inventory includes major projects that increase, extend or improve natural resource production in Canada, including new extraction projects, infrastructure projects, major processing facilities and large expansion projects. In addition, the inventory includes information on the value, timing and geographic location of projects. To be included in the inventory, projects in the energy and mining sectors must meet a minimum capital worth threshold of $50 million and electricity and forest sector projects must meet a threshold of $20 million. Also included in the inventory are clean energy and clean technology projects, which must meet a minimum capital worth threshold of $10 million. DISCLAIMER: Data is sourced from federal, provincial, and territorial databases, publicly accessible websites, and other sources, including CANOILS. Data and maps are for illustrative purposes only. Users understand that, although all efforts have been made to accurately and exhaustively compile, locate and classify projects, the authors do not guarantee the accuracy and/or the comprehensiveness of the data and assume no responsibility for errors or omissions. The routes of the proposed transmission lines and pipelines are approximations, often using only start and end points. In support of this initiative, proponents and partners are encouraged to contact Natural Resources Canada should they identify any significant errors or omissions.
-
Building on the initial effort (“Database of Open Water Areas in River Ice for Provinces of Manitoba, Ontario, Quebec, and the Maritimes - Potential Locations For River Hydrokinetic Energy Extraction Identified Through Optical Satellite Imager”; weblink: https://search.open.canada.ca/openmap/d9823004-29aa-40e2-aa47-9c54cf88c309), a follow-up research project has led to the publication of this extensive analysis encompassing the entirety of Canada’s major freezing rivers. This work has applied advanced image processing and classification algorithms to the selected images, elevating the classification and analysis to a higher level of accuracy and providing a more comprehensive dataset for exploring river hydrokinetic energy prospects across the country. This dataset identifies open water areas within ice-covered major Canadian rivers, aiming to evaluate potential hydrokinetic resources. The data is derived from high-resolution optical satellite imagery obtained from Landsat and Sentinel satellites corresponding to National Research Council (NRC) 2014 flow data of river reaches with water depths of at least 10 meters and a flow velocity of a minimum of 0.5 meters per second. Using advanced image processing and machine learning algorithms, the dataset efficiently differentiates between ice-covered and open water regions, providing a reliable basis for assessing hydrokinetic energy potential in the identified areas. Disclaimer: This dataset is subject to the following limitations: • Landsat and Sentinel optical satellite images are high-resolution, but they may contain resolution errors, possible distortions, and inaccuracies in depicting on-ground conditions. • Despite advanced image processing and machine learning algorithms, errors or biases may exist. • The dataset's reliability is also influenced by the NRC flow data. Therefore, users should view this dataset as a preliminary assessment tool, not a definitive guide for decision-making or investment in hydrokinetic projects. It is strongly recommended to validate its accuracy and suitability for specific applications through additional research and studies. By accessing and using this dataset, users acknowledge and accept these disclaimers. The providers of this dataset explicitly absolve themselves of any responsibility or liability for any consequences arising from the use, reliance upon, or interpretation of this dataset. Users are advised that their use of the dataset is at their own risk, and they assume full responsibility for any actions or decisions made based on the information contained therein. This disclaimer is in accordance with applicable laws and regulations, and by accessing or utilizing the dataset, users agree to release the providers of this dataset from any legal claims, damages, or liabilities that may arise from such use.
-

The Remote Communities Energy Database is a public resource that provides pertinent factual information about the generation and use of electricity and other energy sources for all remote communities in Canada. Communities are identified as remote communities if they are not currently connected to the North-American electrical grid nor to the piped natural gas network; and is a permanent or long-term (5 years or more) settlement with at least 10 dwellings. The Remote Communities Energy Database is the only national data source on energy in remote communities that is publically available on one centralized site. The Remote Communities Energy Database allows users to search and conduct analyses of remote communities and their energy context. Users are also able download the data from the Remote Communities Energy Database dataset in CSV (i.e., excel compatible) format. This data is collected from a number of sources including the remote communities themselves, local utilities, provincial and territorial government’s, Indigenous and Northern Affairs Canada (INAC), Statistics Canada, Natural Resources Canada (NRCan) and various other stakeholders.
-
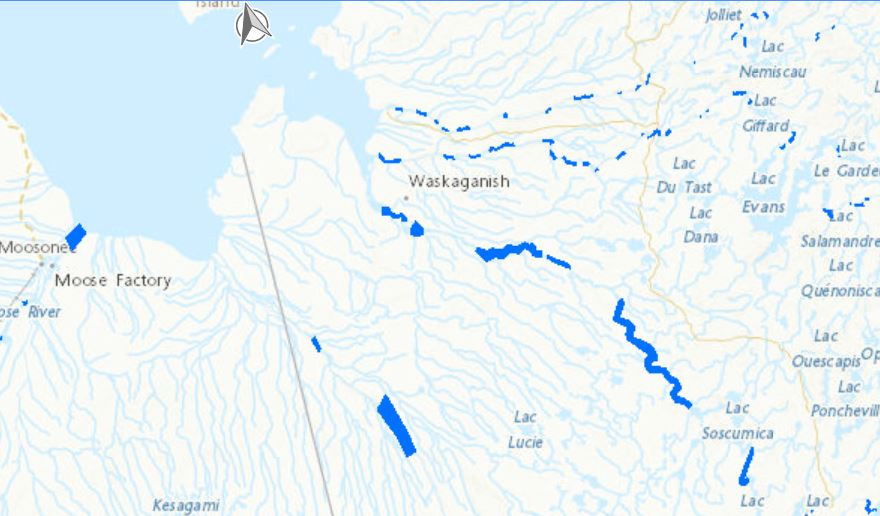
Locations of open water within river ice in Manitoba, Ontario, Quebec, and the Maritimes were discerned manually using publicly accessible optical satellite images spanning from 2013 to 2020. This initial effort has led to a dataset pinpointing potential sites for river hydrokinetic energy initiatives. A more comprehensive dataset encompassing the entirety of Canada’s major freezing rivers has also been developed entitled “Hydrokinetic Resource Mapping - Optical Satellite Imagery Analysis of Open Water Regions in Ice-Covered Canadian Rivers” and is available at (https://search.open.canada.ca/openmap/61b4e576-9f3a-49a1-9546-b29be14787a4). Disclaimer: The identification of open water locations within river ice in Manitoba, Ontario, Quebec, and the Maritimes, as described, was conducted manually through the analysis of publicly available optical satellite images. This dataset is subject to the following limitations: 1- The manual identification method may introduce potential human error and subjectivity within the dataset. 2- The publicly accessible satellite images employed may not provide fully comprehensive or entirely accurate representations of the actual conditions in the identified locations due to image resolution constraints, cloud cover, or atmospheric interference. This dataset is intended for preliminary assessment and should not be the sole basis for making critical decisions or investments related to hydrokinetic energy projects. Further validation and in-depth analysis are strongly recommended, and users should conduct their own due diligence and additional research to verify the data accuracy and relevance for specific applications. By accessing and using this dataset, users acknowledge and accept these disclaimers. The providers of this dataset explicitly absolve themselves of any responsibility or liability for any consequences arising from the use, reliance upon, or interpretation of this dataset. Users are advised that their use of the dataset is at their own risk, and they assume full responsibility for any actions or decisions made based on the information contained therein. This disclaimer is in accordance with applicable laws and regulations, and by accessing or utilizing the dataset, users agree to release the providers of this dataset from any legal claims, damages, or liabilities that may arise from such use.