arctic
Type of resources
Available actions
Topics
Keywords
Contact for the resource
Provided by
Years
Formats
Representation types
Update frequencies
status
Service types
-

The map shows where the ice edge is now, meaning the boundary between solid ice and floating ice. The Norwegian Meteorological Institute updates the map every working day, Monday to Friday.
-

The BarentsWatch WMS service provides the service layers used for the services at barentswatch.no and a few additional layers in order to make the information more accessible for other uses. The service layers can be adapted further if needs are clarified. Some service layers that are not appropriate for external use are not referred to. All the service layers are based on data from other agencies. Therefore, BarentsWatch/the Norwegian Coastal Administration are not the owners of all the data. If BarentsWatch does not add new information and the service layer is already presented by the data owner, it is not added to Geonorge even if it occurs in the service. See also BarentsWatch API for other access to the same data.
-

This service includes topographical maps on a scale of 1:1 to 1:300,000.
-

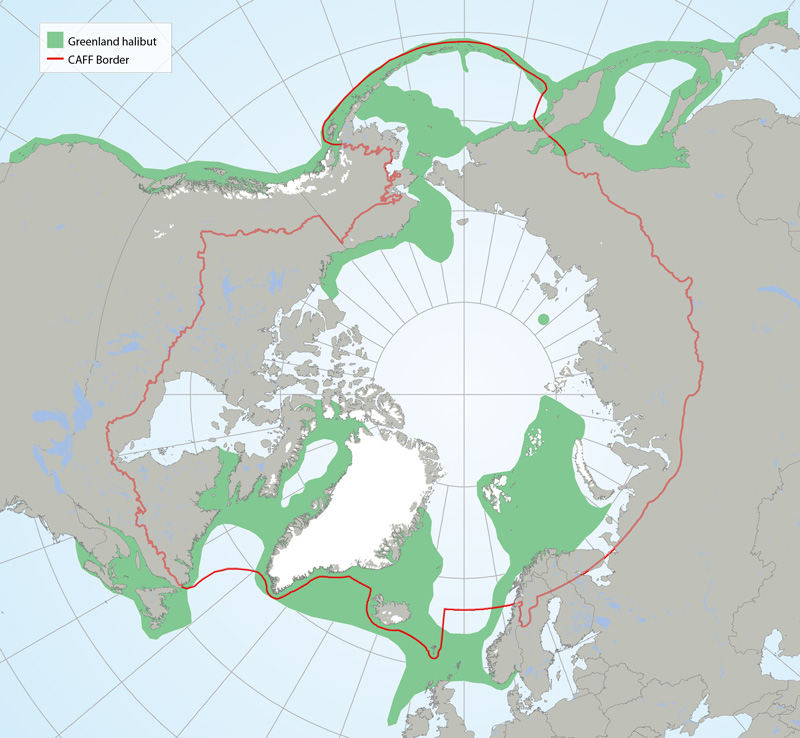
Distribution of Greenland halibut (Reinhardtius hippoglossoides) based on participation in research sampling, examination of museum voucher collections, literature and molecular genetic analysis (Mecklenburg et al. 2011, 2014, 2016, Mecklenburg and Steinke 2015). Map shows the maximum distribution observed from point data and includes both common and rare locations. STATE OF THE ARCTIC MARINE BIODIVERSITY REPORT - <a href="https://arcticbiodiversity.is/findings/marine-fishes" target="_blank">Chapter 3</a> - Page 120 - Figure 3.4.7
-

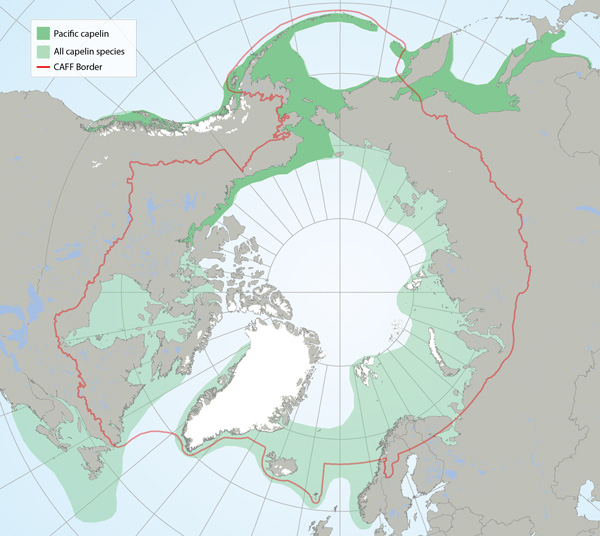
Distributions of all capelin species (light green) and Pacific capelin (Mallotus catervarius; dark green pattern) based on participation in research sampling, examination of museum voucher collections, the literature and molecular genetic analysis (Mecklenburg and Steinke 2015, Mecklenburg et al. 2016). Map shows the maximum distribution observed from point data and includes both common and rare locations STATE OF THE ARCTIC MARINE BIODIVERSITY REPORT - <a href="https://arcticbiodiversity.is/findings/marine-fishes" target="_blank">Chapter 3</a> - Page 117 - Figure 3.4.5
-

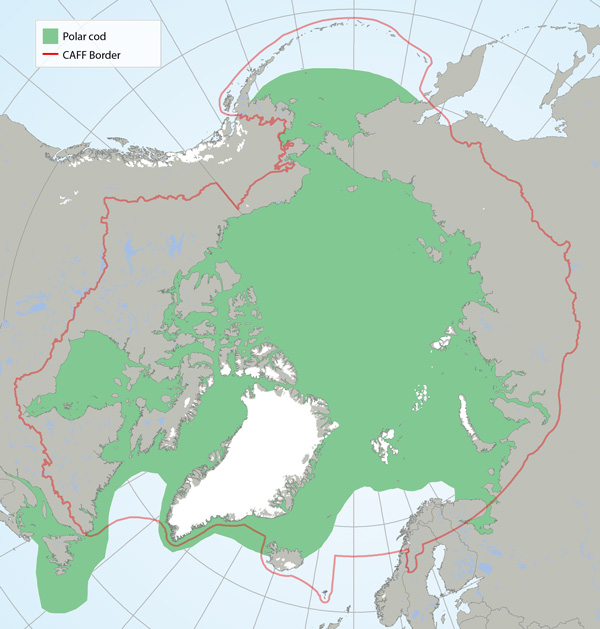
Distribution of polar cod (Boreogadus saida) based on participation in research sampling, examination of museum voucher collections and the literature (Mecklenburg et al. 2011, 2014, 2016; Mecklenburg and Steinke 2015). Map shows the maximum distribution observed from point data and includes both common and rare locations. STATE OF THE ARCTIC MARINE BIODIVERSITY REPORT - <a href="https://arcticbiodiversity.is/findings/marine-fishes" target="_blank">Chapter 3</a> - Page 114 - Figure 3.4.2
-

Bird and distance transect biodiversity GRID data from Barrow, Alaska-
-

In July and August of 2019, a remotely piloted aircraft system (RPAS) project was undertaken in Canada’s western Arctic along the Inuvik to Tuktoyaktuk (ITH) and Dempster highways. The objective of this project was to test long-range RPAS missions for photogrammetric data acquisition and processing of these two Arctic highway corridors with embankments, bridges and culverts at risk of changing environmental and climatic regimes. The imagery was used to derive an orthomosaic and digital elevation model that could be used to measure road infrastructure and landscape change over time (e.g., fish habitat). The RPAS missions were conducted with a Griffon SeaHunter and full-frame DSLR sensor and scoped to obtain <10 cm spatial resolution imagery along a combined 396 linear km. The final deliverables covered over 22,000 ha and 29,000 ha for the ITH and Dempster Highways, respectively, and represent one of the first non-military beyond-visual-line-of-sight RPAS data products of its kind and scale in Canada, and likely elsewhere. At the time of collection the data constituted the most current and detailed photo surveys of two of Canada’s most northern highways constructed over ice-rich permafrost terrain, and will provide a valuable baseline to study past and future landscape change.
-

**Permafrost** is any soil or rock whose temperature has remained below 0°C for years. In the extreme north of Quebec, it is omnipresent and very thick. At its boreal margin, further south, it appears in the landscape in the form of isolated thin plates, whose thickness is generally less than 10 m. Permafrost contains ice in various forms, whose origin is closely linked to the sedimentary characteristics and drainage conditions of the land. The mapping of permafrost conditions for Nunavik (territory located north of the 55th parallel), carried out by the Center for Nordic Studies at Laval University, was done by applying a simple model called TTOP (Temperature at the Top Of Permafrost) for the period from 2000 to 2016. The results of the model are presented in the form of a raster file that illustrates the distribution of continuous, discontinuous, and sporadic permafrost, as well as isolated islands. Under the effect of global warming or poorly adapted human activities, permafrost heats up or even thaws, which leads to settlements and ground movements affecting ecosystems as well as infrastructures. Thus, the susceptibility of the territory to thermokarstic subsidence was evaluated for the same territory taking into account the ice content and the temperature at the top of the permafrost. A matrix file (raster) of the susceptibility of the territory to ground subsidence associated with permafrost thaw presents three susceptibility classes (high, moderate, and low) as well as areas generally without permafrost. **This third party metadata element was translated using an automated translation tool (Amazon Translate).**
-

In July and August of 2019, a remotely piloted aircraft system (RPAS) project was undertaken in Canada’s western Arctic along the Inuvik to Tuktoyaktuk (ITH) and Dempster highways. The objective of this project was to test long-range RPAS missions for photogrammetric data acquisition and processing of these two Arctic highway corridors with embankments, bridges and culverts at risk of changing environmental and climatic regimes. The imagery was used to derive an orthomosaic and digital elevation model that could be used to measure road infrastructure and landscape change over time (e.g., fish habitat). The RPAS missions were conducted with a Griffon SeaHunter and full-frame DSLR sensor and scoped to obtain <10 cm spatial resolution imagery along a combined 396 linear km. The final deliverables covered over 22,000 ha and 29,000 ha for the ITH and Dempster Highways, respectively, and represent one of the first non-military beyond-visual-line-of-sight RPAS data products of its kind and scale in Canada, and likely elsewhere. At the time of collection the data constituted the most current and detailed photo surveys of two of Canada’s most northern highways constructed over ice-rich permafrost terrain, and will provide a valuable baseline to study past and future landscape change.
 Arctic SDI catalogue