 Arctic SDI catalogue
fish
Type of resources
Available actions
Topics
Keywords
Contact for the resource
Provided by
Formats
Representation types
Update frequencies
status
Scale
-

Fish stocking records from Nova Scotia fish hatcheries. Includes trout and salmon stocking, size, number, location, stock and growth stage. Records contain both fall and spring distributions.
-
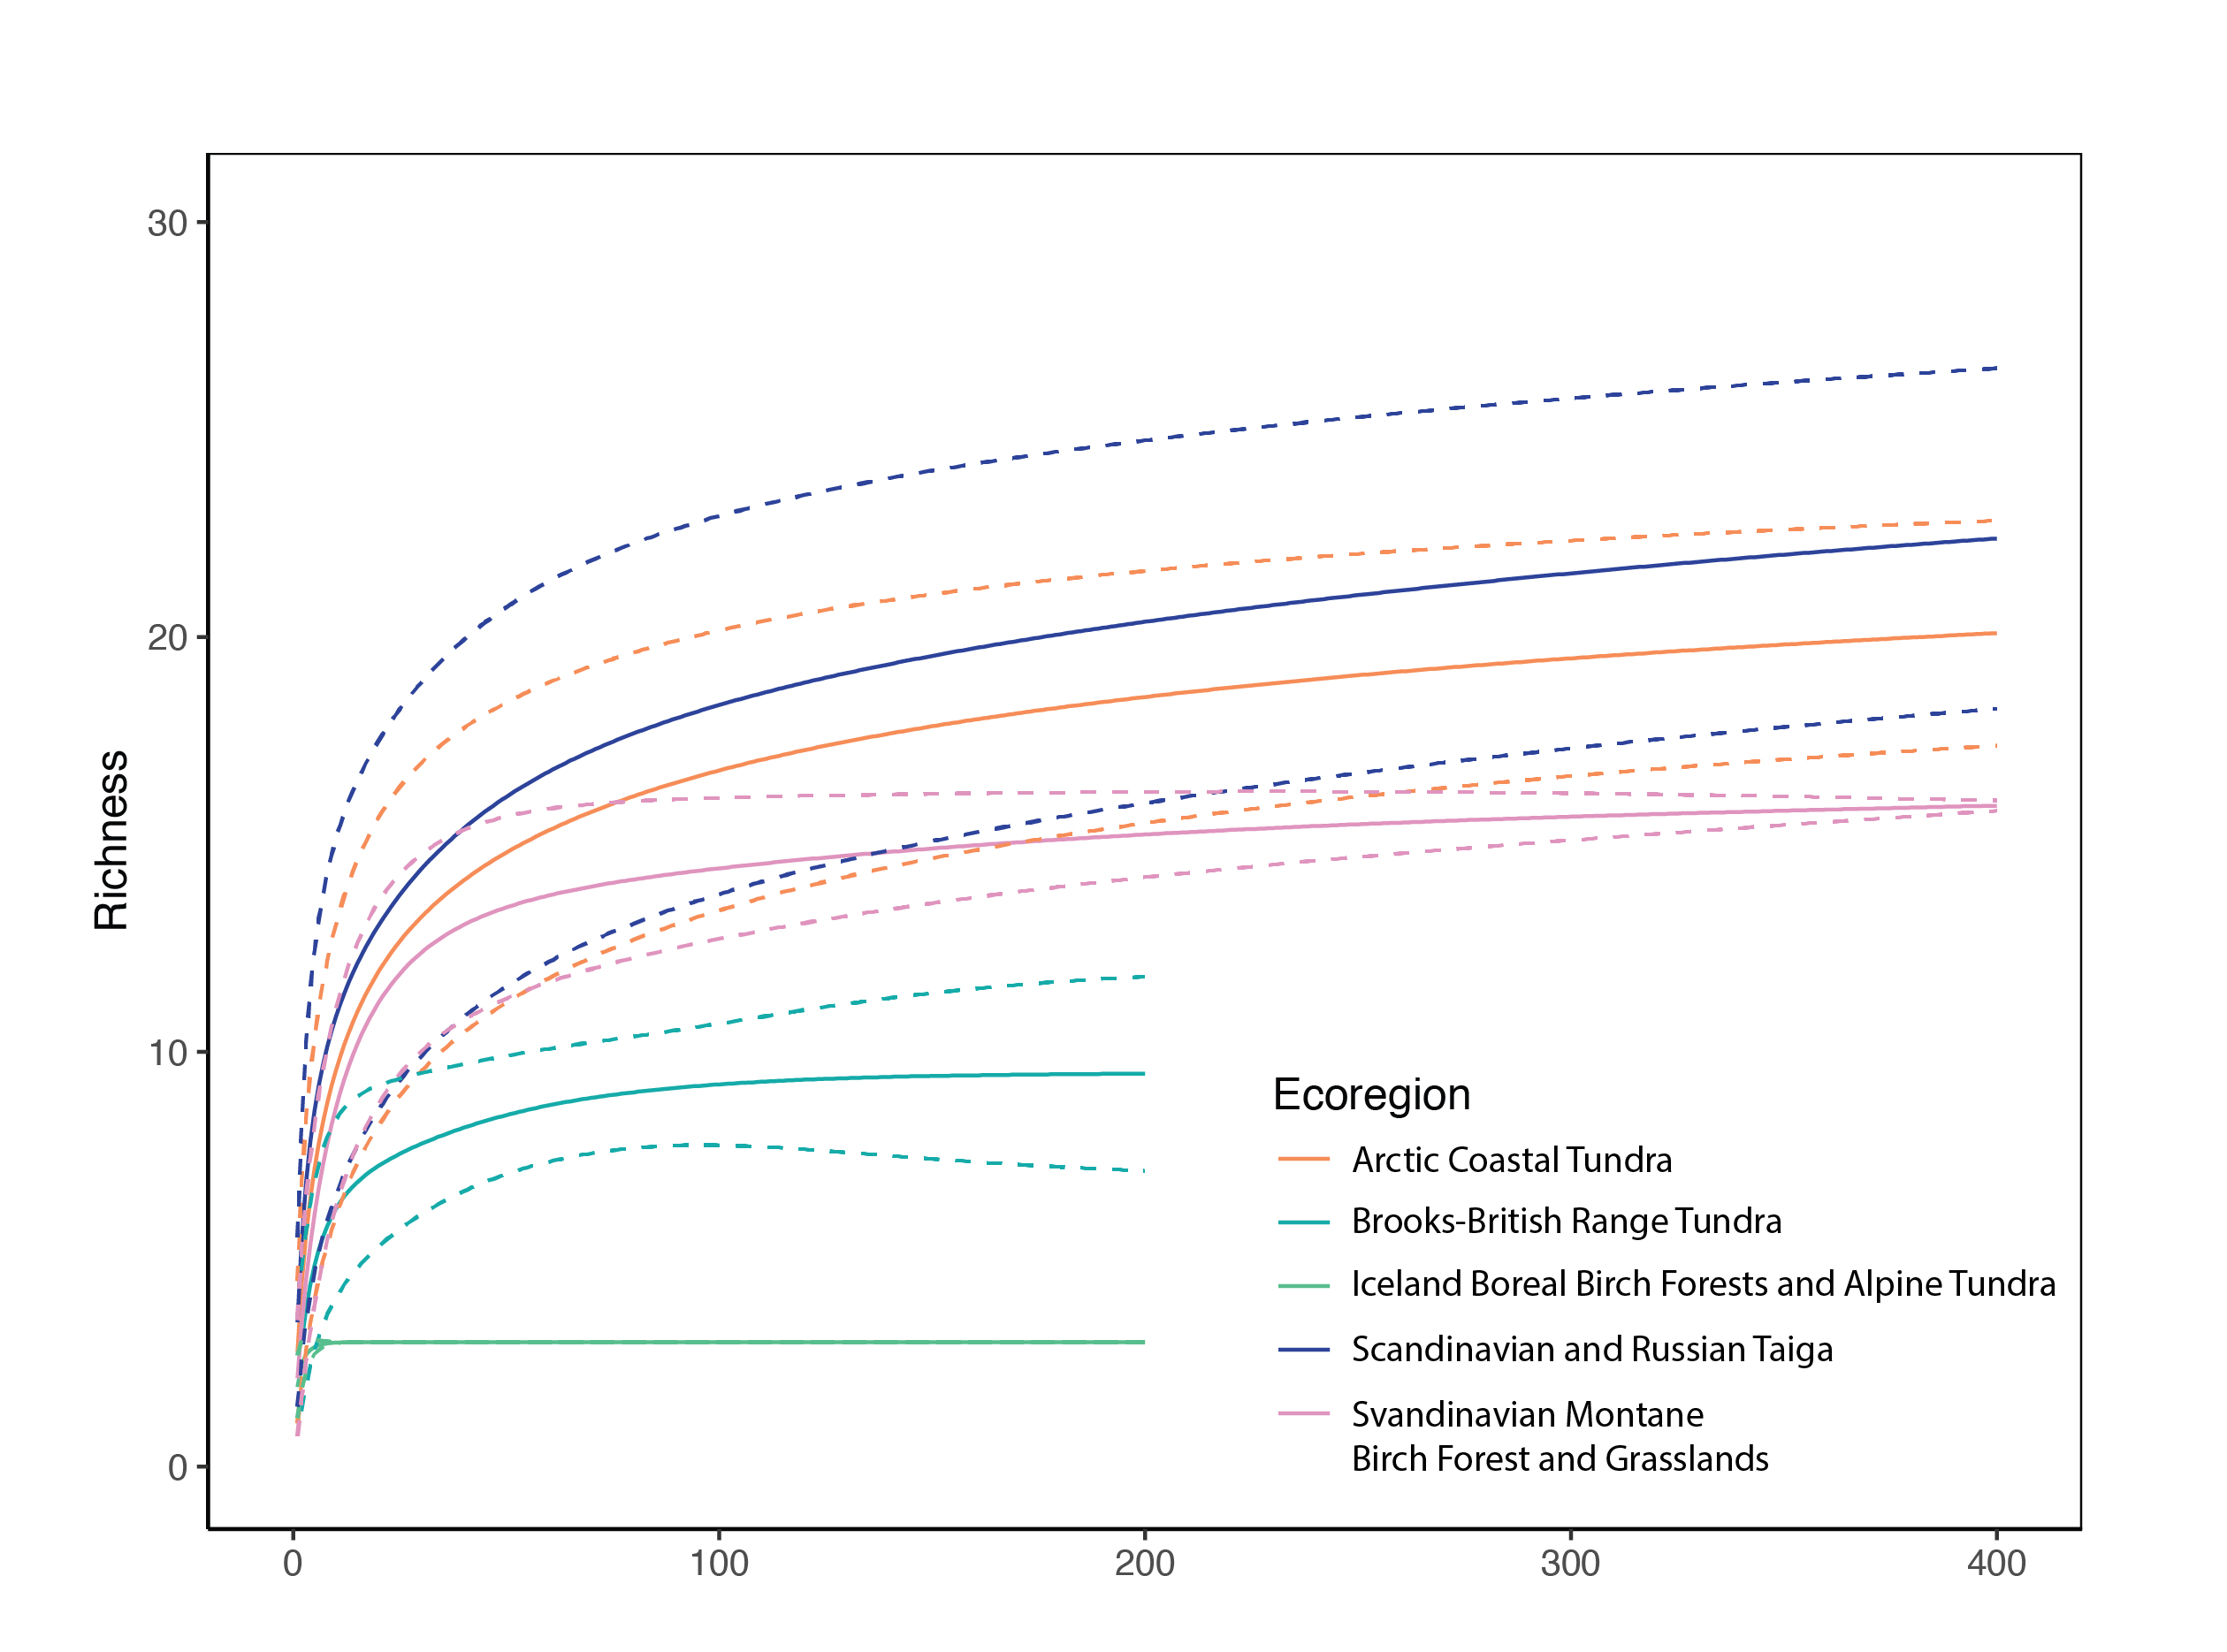
Provides richness estimates and 95% confidence bounds for five ecoregions. State of the Arctic Freshwater Biodiversity Report - Chapter 4 - Page 77 - Figure 4-38
-

This spatial layer displays stream inventory sample sites that have had full or partial surveys, and contains measurements or indicator information of the data collected at each survey site on each date.
-
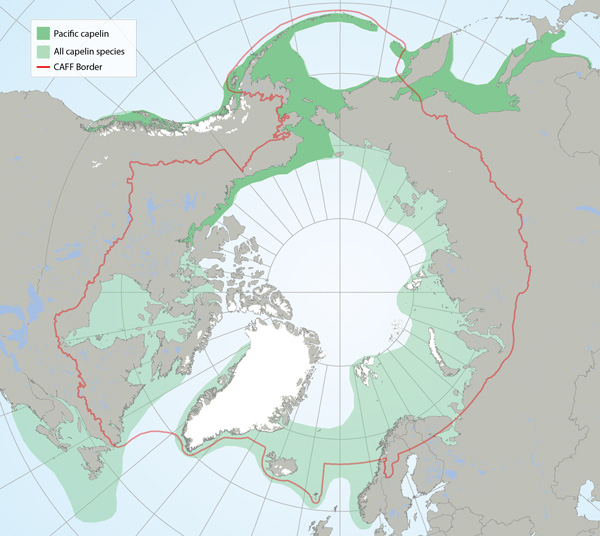
Distributions of all capelin species (light green) and Pacific capelin (Mallotus catervarius; dark green pattern) based on participation in research sampling, examination of museum voucher collections, the literature and molecular genetic analysis (Mecklenburg and Steinke 2015, Mecklenburg et al. 2016). Map shows the maximum distribution observed from point data and includes both common and rare locations STATE OF THE ARCTIC MARINE BIODIVERSITY REPORT - <a href="https://arcticbiodiversity.is/findings/marine-fishes" target="_blank">Chapter 3</a> - Page 117 - Figure 3.4.5
-
Coastline segments indicating herring spawing sites along the coastline of British Columbia. Attribute information includes relative importance, spawing frequency and spawn index. CRIMS is a legacy dataset of BC coastal resource data that was acquired in a systematic and synoptic manner from 1979 and was intermittently updated throughout the years. Resource information was collected in nine study areas using a peer-reviewed provincial Resource Information Standards Committee consisting of DFO Fishery Officers, First Nations, and other subject matter experts. There are currently no plans to update this legacy data.
-
Fish Spawning Periods for the Quesnel and Central Cariboo Forest Districts.
-
Formerly known as the Nova Scotia Sportfish Registry, this dataset is a list of the current record holders for several popular Nova Scotia sportfish. There are both youth and adult, catch and release and catch and keep and smallmouth bass tournament categories.
-
List of freshwater fish species recorded from survey data throughout Nova Scotia.
-
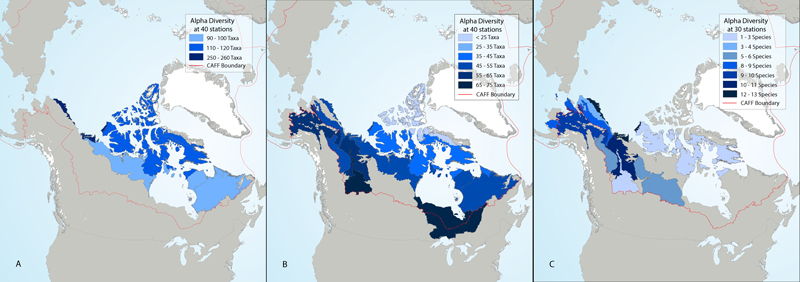
Rarefied alpha diversity of river (a) diatoms from benthic samples, (b) benthic macroinvertebrates, and (c) fish in ecoregions across North America. State of the Arctic Freshwater Biodiversity Report - Chapter 5- Page 84 - Figure 5-1
-
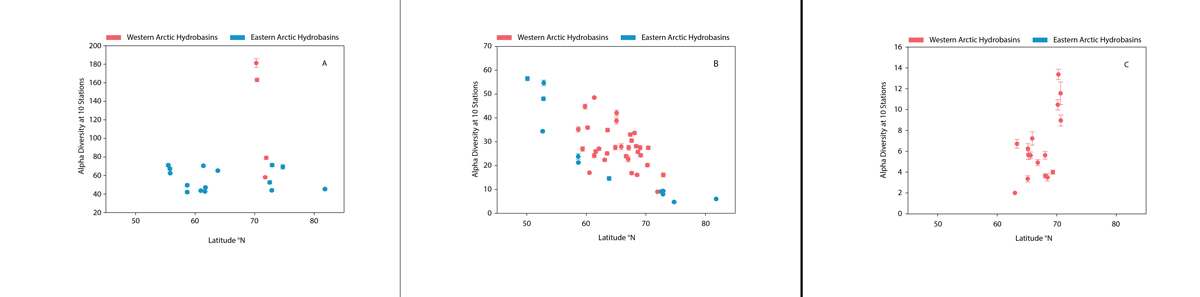
Alpha diversity (± standard error) of river (a) diatoms from benthic samples, (b) benthic macroinvertebrates, and (c) fish within hydrobasins in western and eastern North America plotted as a function of the average latitude in each hydrobasin. Alpha diversity is rarefied to 10 stations per hydrobasin, using size level 5 hydrobasins for all panels. State of the Arctic Freshwater Biodiversity Report - Chapter 5 - Page 85 - Figure 5-2