 Arctic SDI catalogue
Fisheries management
Type of resources
Available actions
Topics
Keywords
Contact for the resource
Provided by
Years
Formats
Representation types
Update frequencies
status
Service types
-

These datasets show commercial fisheries catch weight landings of directed fisheries and bycatch from the Scotian Shelf, the Bay of Fundy, and Georges Bank from NAFO Divisions 4VWX and the Canadian portions of 5Y and 5Z. Five-year composite maps (2019–2023) that aggregate catches for each map series are publicly available. The maps aggregate catch weight (kg) per 10 km2 hexagon grid cell for selected species, species groupings and gear types to identify important fishing areas. These maps can support decision making in coastal and oceans management, including marine spatial planning, environmental emergency response operations and protocols, Marine Stewardship Council certification processes, marine protected area networks, and ecological risk assessment. Reported catch locations may have rounded coordinates or contain errors. Although some errors have been corrected, it is assumed that additional errors remain in the data. These datasets have been filtered to comply with the Government of Canada's privacy policy. Privacy assessments were conducted to identify DFO unit areas containing data with less than five vessel IDs, licence IDs or fisher IDs. If this threshold was not met, catch weight locations were withheld from these unit areas to protect the identity or activity of individual vessels or companies. Maps were created for the following species, species groupings and gear types: 1. Groundfish (all species) 2. Groundfish Bottom Trawl 3. Groundfish Bottom Longline 4. Groundfish Gillnet 5. Groundfish (seasonal composites) 6. Atlantic Cod 7. Atlantic Cod, Haddock and Pollock 8. Flatfish 9. Atlantic Halibut 10. Greenland Halibut (Turbot) 11. Hagfish 12. Cusk 13. Dogfish 14. Redfish 15. Red Hake 16. Silver Hake 17. White Hake 18. Monkfish 19. Sculpin 20. Skate 21. Wolffish 22. Squid 23. Herring 24. Mackerel 25. Herring and Mackerel Gillnet 26. Purse Seine 27. Large Pelagics 28. Bluefin Tuna 29. Other Tuna 30. Swordfish 31. Snow Crab 32. Other Crab 33. Scallop 34. Scallop (seasonal composites) 35. Offshore Clam 36. Shrimp Trawl 37. Shrimp Trap 38. Offshore Lobster 39. Disputed Zone Area 38B Lobster 40. Whelk
-

Biological samples of Geoduck Clams have been collected during surveys in British Columbia as part of the broader survey objectives of determining Geoduck density, distribution and population structure. Samples of Geoducks were collected from 41 locations throughout British Columbia between 1993 and 2002. Clams were measured for total weight, shell length, shell weight and were aged. Biological parameters are presented here for individual clams sampled. See Bureau D., W. Hajas, N.W. Surry, C.M. Hand, G. Dovey and A. Campbell. 2002. Age, size structure and growth parameters of Geoducks (Panopea abrupta, Conrad 1849) from 34 locations in British Columbia sampled between 1993 and 2000. Can Tech. Rep. Fish. Aquat. Sci. 2413: 84 p. and Bureau D., W. Hajas, C.M. Hand and G. Dovey. 2003. Age, size structure and growth parameters of Geoducks (Panopea abrupta, Conrad 1849) from seven locations in British Columbia sampled in 2001 and 2002. Can. Tech. Rep. Fish. Aquat. Sci. 2494: 29 p.
-
This dataset contains area-based management measures that qualify as 'other effective area-based conservation measures' ('other measures') according to DFO's Operational Guidance for Identifying ‘Other Effective Area-Based Conservation Measures’ in Canada’s Marine Environment (http://www.dfo-mpo.gc.ca/oceans/publications/oeabcm-amcepz/index-eng.html). It also contains basic information about these ‘other measures’, specifically their names, objectives, and prohibitions. The identification of existing, and establishment of new, 'other measures' is an important element of Canada’s strategy to meet its marine conservation targets to protect 5 percent of Canada’s marine and coastal areas by 2017 and 10 percent by 2020. 'Other measures' will be evaluated regularly, taking the most recent available information into account. In addition new 'other measures' will be identified or established over time. Therefore, this data set may change over time, and is considered current as of its publication date stamp. The boundaries and attributes in this dataset are for information purposes only, and should not be considered legally authoritative.
-
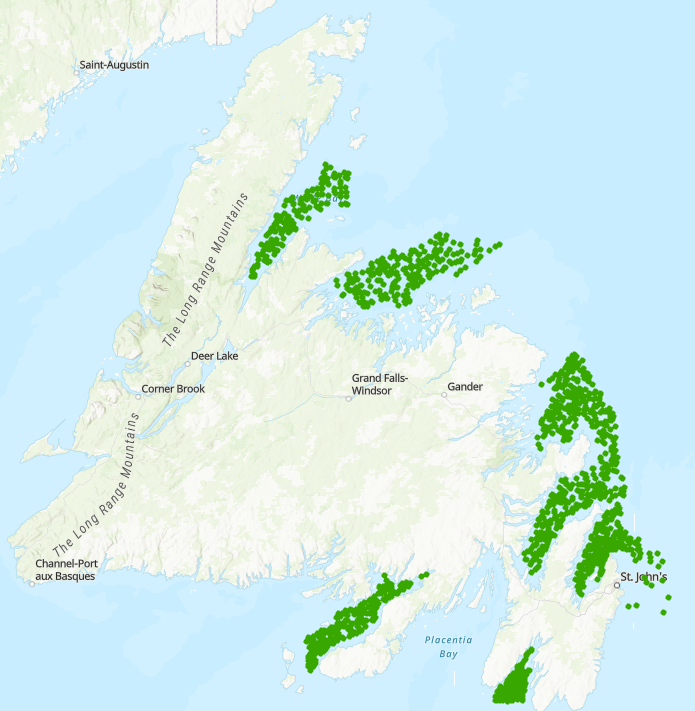
This data is from the Newfoundland and Labrador Region Inshore Trap survey, specific to Snow Crab from 2018-25, with only successful sets included in the database. Details of annual survey coverage and an overview of the survey program can be found in Pantin et al. (2025). This trap survey follows a depth-stratified random survey design, designated by type = 1 (Survey). Data were available from DFO inshore trap surveys in Fortune Bay, St. Mary’s Bay, Conception Bay, Trinity Bay, Bonavista Bay, Notre Dame Bay, White Bay, and infrequently along the Northeast Avalon Peninsula. All surveys follow a depth-stratified survey design with set locations randomly distributed within each stratum, and stratum-specific set allocations weighted by area. All surveys utilize large-mesh (5.25”) and small-mesh (42 mm) traps intermittently placed within each ‘fleet’ of gear, with traps spaced approximately 45 m (i.e., 25 fathoms) apart. Each fleet includes six baited traps, with two additional end traps not baited. Squid (Illex spp.) hung on skivers is attached to the inner entry cone of each trap as bait, with approximately 2–3 pounds of squid on each skiver. Although soak times are intended to be standardized to 24–48 hours, weather and other factors can affect the surveys and soak times are ultimately variable. Biological sampling is conducted at-sea from all traps at each station and is described in Pantin et al. (2025). Whole weights of Snow Crab are not always taken for every crab (e.g., in poor weather, missing limbs, carapace covered in biofouling) and those without measurements are denoted by an NA in the dataset. Analyses by the DFO NL Snow Crab group apply a length-weight relationship to determine weights, which is not in this dataset. Traps that caught zero Snow Crab are denoted in the dataset by a ‘number’ of 0. References: Pantin, J., D. Mullowney, K. Baker, K. Lefort, W. Coffey, F. Cyr, H. Munro, and Koen-Alonso, M. 2025. An Assessment of Newfoundland and Labrador Snow Crab (Chionoecetes opilio) in 2023. DFO. Can. Sci. Advis. Sec. Res. Doc. 2025/080. iv + 152 p.
-

Pacific Herring spawn index data for British Columbia from 1951 to present. Note that the spawn index is a relative index of spawning biomass. In addition, “NA" indicates that data are unavailable because they are either incomplete or withheld; contact the custodian for more information. For the "Region" column specifically, "NA" indicates that the location is outside stock assessment region boundaries. There are a few caveats to consider when interpreting Pacific Herring spawn index data, which are discussed in the technical report (see supporting documents).
-
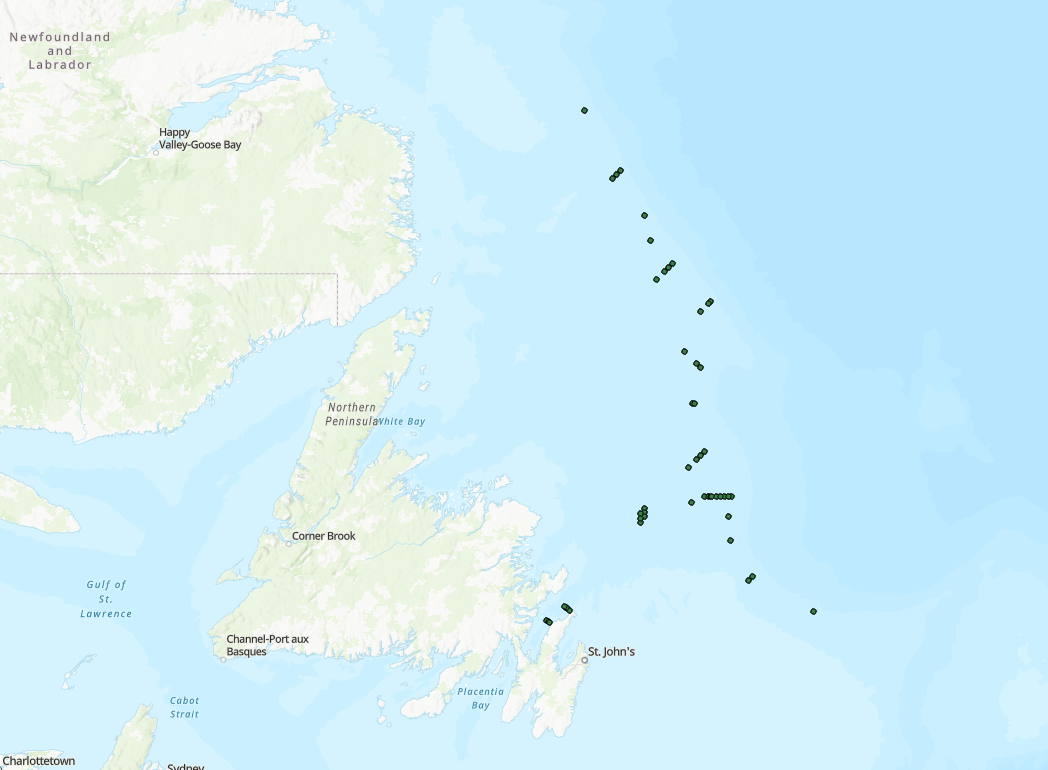
Greenland halibut (Reinhardtius hippoglossoides) occupy deep waters off Newfoundland and Labrador and are a commercially important species. The Groundfish Section, Fisheries and Oceans Canada – Newfoundland and Labrador Region implemented an acoustic tagging program to better understand the movement and habitat use for this species. This program began in 2021, and was further developed as a results of two DFO Competitive Science Research Fund project between 2022-2026. Fish were caught via trawl or longline, VEMCO acoustic transmitters surgically implanted, and released at site of capture. Detections occurred from acoustic receivers deployed by the Groundfish section and/or from receiver arrays associated with the Oceans Tracking Network (e.g. Northern Cod Acoustic Telemetry Array [NCAT]). Raw detection data are downloaded from receivers and sent to the Ocean Tracking Network for formatting and archiving. Data provided here summarize reported detections from 2021-2024 as part of a master’s project at Memorial University of Newfoundland. Release locations, number and location of detections, defined movement class, and detection duration are summarized by individual. Location information includes the position of the receiver the fish was detected at, and the North Atlantic Fisheries Organization (NAFO) Divisions where fish were detected in.
-

Fisheries and Oceans Canada (DFO) conducts an annual summer multidisciplinary scientific survey with a bottom trawl in the Estuary and the northern Gulf of St. Lawrence since 1984. Over the years this survey has been conducted on four vessels: the MV Lady Hammond (1984-1990), the CCGS Alfred Needler (1990-2005), the CCGS Teleost (2004-2021) and the CCGS Cabot (2022-current). It is important to note that the objectives, the methods used and the identification of the species during these surveys have improved over time in response to DFO requests and mandates. The data are therefore not directly comparable between these surveys. The specificities of the missions onboard the CCGS Alfred Needler are described below. Objectives: 1. Assess groundfish and northern shrimp population abundance and condition 2. Assess environmental conditions 3. Conduct a biodiversity inventory of benthic and demersal megafauna 4. Monitor the pelagic ecosystem 5. Collect samples for various research projects Survey description The survey covers the divisions 4R, 4S, 3Pn and the northern part of division 4T of the Northwest Atlantic Fisheries Organization (NAFO). This survey follows a stratified random sampling design and the fishing gear used on the CCGS Alfred Needler is a URI shrimp trawl (81'/114'). Standard trawling tows last 25 minutes, starting from the time the trawl touched the sea floor. Towing speed is 3 knots. Data For each fishing tow, the catch is sorted and weighed by taxa; individuals are then counted and biological data are collected on a subsample. For fish, crab and squid, size and weight are measured by individual and, for some species, sex, gonad maturity, and the weight of certain organs (stomach, liver, gonads) are also evaluated. The soft rays of the anal fin are counted for redfish, and the otoliths are collected for several species such as witch flounder, Atlantic cod, Greenland halibut and Atlantic halibut. A roughly 2-kg shrimp sample is sorted and weighed by species (and by stage of maturity for northern shrimp). The shrimps are measured individually. The other invertebrates are counted (no individual measurements) and photographed. The biological data are divided into 5 files: a “Metadata” file containing set information, a “Catches” file containing catches per set for fish taxa, a “Carbio” file containing biological and morphometric measurements per individual, a “Freql” file containing the length frequency of fish and a “Shrimps” file containing information on shrimp catches. It's important to note that this is raw data. Only sets considered successful are retained. In each set, all species are kept, with a few exceptions. For more information please contact the data management team (gddaiss-dmsaisb@dfo-mpo.gc.ca).
-

In place since fall 1994, the sentinel fisheries program is the result of a collaboration between Fisheries and Oceans Canada (DFO) and Quebec and Newfoundland commercial fishermen's associations. Under this program, contracts are awarded by tender to fishermen’s associations to carry out fishing activities according to scientific protocols developed by DFO. The main objective of this survey is to collect data that will be used to calculate abundance indices for the northern Gulf of St. Lawrence Atlantic cod stock. Description of fixed gears survey The fixed gear sentinel fisheries of the northern Gulf of St. Lawrence are conducted in the sub-division 3Pn and the divisions 4R, 4S of the Northwest Atlantic Fisheries Organization (NAFO) using fixed gillnets or longlines (other fishing gears were also used at the start of the program). Fishing activities with nets must have a mesh size of 5 ½ inches (140mm) and are limited to a maximum of 6 to 20 nets depending on the region and capture and the target immersion time is between 19 to 24 hours. Longline fishing activities, for its part, must be carried out with traditional J #16 or C #12 hooks. The maximum number of hooks varies from 500 to 1000, depending on the catch, and the target immersion time is 4 to 6 hours. Data are collected by observers at sea or by technicians. Data For each fishing activity, the total catch is sorted and weighed by species. For each species other than Atlantic cod, the number of individuals caught is noted. Atlantic cod are then measured at the fork (cm). Other biological data such as weight (total, gonad, liver and stomach), age, sex and maturity can then be collected on a subsample of cod. The biological data are divided into 4 files: a “Metadata” file containing set information, a “Catches” file containing catches per set for fish taxa, a “Carbio” file containing biological and morphometric measurements per individual, a “Freql” file containing the length frequency of fish. The data collected as part of this program is available below. It is important to note, however, that 1) only traits deemed successful have been retained; 2) historical data may contain inaccuracies; 3) the most recent survey is not available for validation purposes.
-

Fisheries and Oceans Canada (DFO) conducted a winter multidisciplinary scientific surveys with a bottom trawl the northern Gulf of St. Lawrence and Cabot Straight from 1978 to 1994. The specificities of the missions onboard the MV Lady Hammond are described below. Objectives: 1. Assess groundfish populations abundance and condition 2. Assess environmental conditions 3. Conduct a biodiversity inventory of benthic and demersal megafauna 4. Collect samples for various research projects Survey description This winter survey covers the northern Gulf of St. Lawrence, that is the divisions 4R, 4S and 3Pn of the Northwest Atlantic Fisheries Organization (NAFO). A stratified random sampling strategy is used for this survey and the fishing gear used on the MV Gadus Atlantica is an Engel 145 Otter trawl. Standard trawling tows last 30 minutes, starting from the time the trawl touches the sea floor. Towing speed is 3.5 knots. Data For each fishing tow, the catch is sorted and weighed by taxa; individuals are counted and biological data are collected on a subsample. For fish, crab and squid, size and weight are measured by individual and, for some species, sex, gonad maturity, and the weight of certain organs (stomach, liver, gonads) are also evaluated. The soft rays of the anal fin are counted for redfish and otoliths are collected for Greenland halibut and Atlantic cod. Invertebrates are weighted and counted (no individual measurements). The biological data are divided into 4 files: a “Metadata” file containing set information, a “Catches” file containing catches per set for fish taxa, a “Carbio” file containing morphometric measurements per individual and a “Freql” file containing the length frequency of fish. It's important to note that this is raw data. Only sets considered successful are retained. In each set, all species are kept, with a few exceptions. For more information please contact the data management team (gddaiss-dmsaisb@dfo-mpo.gc.ca).
-
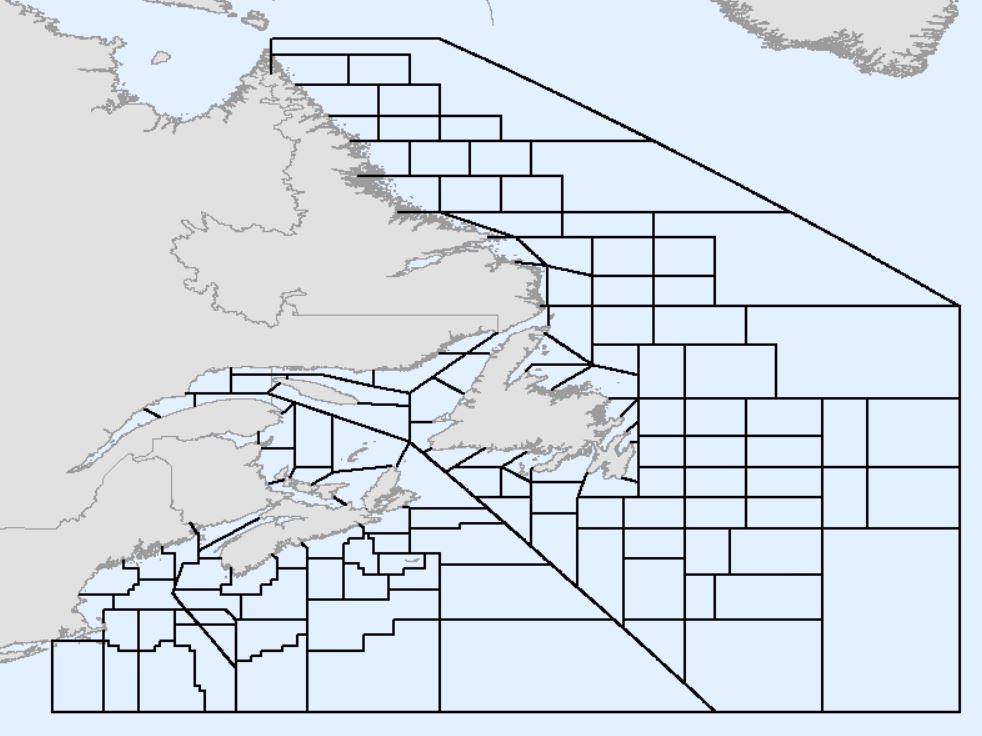
Fisheries and Oceans Canada (DFO) statistical unit areas (also referred to as unit areas) are smaller portions of the Northwest Atlantic Fisheries Organization (NAFO) Subareas, Divisions, and Subdivisions defined in the Convention on Cooperation in the Northwest Atlantic Fisheries (2020). The spatial representation of boundaries defined by NAFO has recently been updated to address inconsistencies and errors in earlier versions, which is available here: https://open.canada.ca/data/dataset/59af1c96-fc8f-4fa0-b398-d65e953eadaa#comment-41855. Unit areas are used by DFO for a variety of purposes including, but not limited to stock assessments, privacy screening of fisheries maps, and statistical analyses. Unit areas were originally defined throughout the 1940s and 1950s. Subsequently, several revisions and alternate versions were created by DFO in various regions leading to inconsistencies in spatial extent and naming conventions. These changes have not been formally documented. The datasets often have topological errors such as gaps and overlaps, especially along diagonals and coastlines. In addition, inconsistencies have arisen from conflicting interpretations of the NAFO divisions, where not all land points are defined by coordinates. Therefore, DFO, with input from the Canadian Hydrographic Service (CHS), has created an updated version of the DFO unit areas file to address inconsistencies and errors among previous versions. The recently updated NAFO divisions were used as the basis for an updated DFO unit areas file. This version of the DFO unit areas must not be used for legal purposes. Legal descriptions of fishing area boundaries can be found in the Atlantic Fisheries Regulations, Maritime Provinces Fishery Regulations, and DFO License Conditions.