 Arctic SDI catalogue
Environmental management
Type of resources
Available actions
Topics
Keywords
Contact for the resource
Provided by
Formats
Representation types
Update frequencies
status
-

This database aggregates basic information on orphaned and abandoned mine sites from participating Canadian jurisdictions, including their name, location, jurisdiciton, and the commodity that was mined. It was originally created in 2012 through the National Orphaned/Abandoned Mines Initiative and has undergone several updates since that time. Data on sites in each jurisdiction is owned and maintained by that jurisdiction. The database includes links to the corresponding records in that jursidiction. While the database includes common informaiton about all sites, there may be discrepancies in the types of data provided about sites in different jurisdictions and data from some jurisdictions may be updated more frequently than others.
-
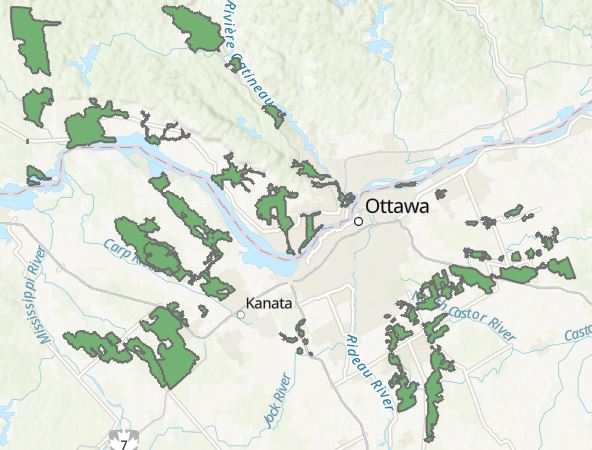
To identify the overall reach and configuration of the Capital Pathway, show the location of existing pathways (as of 2020) and proposed pathway segments, and distinguish between discovery routes and feeder links. Capital Pathway Strategic Plan, October 2020 https://ncc-website-2.s3.amazonaws.com/documents/Pathways-BOOK-10-15-2020-EN_Final_Compressed.pdf
-
The National Interest Land Mass (NILM) comprises a set of lands (mainly-NCC owned) considered essential to the functioning and experience of Canada's Capital. The NILM is the dominant tool guiding federal land management and ownership in support of Capital functions. The NILM was approved by Treasury Board in 1998 and the first update was approved in 2001. The 2020 NILM Update is the second update.
-
The Ecological Land Mass (ELM) classification was established through the 2020 National Interest Land Mass (NILM) Update. ELM lands describe ecological corridors that have inherent natural values and that protect Species at Risk (SAR) and their habitats. The classification identifies lands to protect in perpetuity through planning and partnership efforts. ELM was derived from two separate analyses - the Ontario side from the AECOM natural linkages analysis (2012) and the Quebec side from Del Degan, Masse (DDM) ecological corridors analysis (2012). Adjustments were made as appropriate.
-

This dataset represents the Environmental and Socio-economic Assessments (ESA) submitted to the Canada Energy Regulator (CER). The CER has made this and other ESAs available through an online search tool called BERDI (Biophysical Socio-Economic Regional Data and Information). Data extraction methodology is available on the BERDI website. Pipelines represented in this layer include a start and end point.
-

Description: Spatial information on the distribution of juvenile Pacific salmon is needed to support Marine Spatial Planning in the Pacific Region of Canada. Here we provide spatial estimates of the distribution of juvenile fish in the Strait of Georgia for all five species of Pacific salmon. These estimates were generated using a spatiotemporal generalized linear model and are based on standardized fishery-independent survey data from the Strait of Georgia mid-water juvenile salmon mid-water trawl survey from 2010 to 2020. We provide predicted catch per unit effort (CPUE), year-to-year variation in CPUE, and prediction uncertainty for both summer (June–July) and fall (September–October) at a 0.5 km resolution, covering the majority of the strait. These results show that the surface 75 m of the entire Strait of Georgia is habitat for juvenile salmon from June through early October, but that distributions within the strait differ across species and across seasons. While there is interannual variability in abundances and distributions, our analysis identifies areas that have consistently high abundances across years. The results from this study illustrate juvenile habitat use in the Strait of Georgia for the five species of Pacific salmon and can support ongoing marine spatial planning initiatives in the Pacific region of Canada. Methods: Juvenile Salmon Survey Data This analysis is based on surveys conducted between 2010 and 2020. Sets that lasted between 12 and 50 minutes and at depths less than or equal to 60 m (head rope depth) were included. The resulting survey dataset consists of 1588 sets. The analysis included all five species of Pacific salmon. For pink salmon, only even year surveys were included as they have a two-year life cycle and are effectively absent from the Strait in odd years. Geostatistical model of salmon abundance and Predictions We estimated the spatial distribution and abundance of each species of Pacific Salmon using geostatistical models fit with sdmTMB (Anderson et al. 2022). For each species, we modelled the number of individuals caught in a set, at a location and time using a negative binomial observation model with a log link. Predictions were made for each survey season (summer and fall) in each year from 2010 to 2020 over a 500 m by 500 m grid based on a 3 km buffer around the outer concave hull of the trawl coordinates. The concave hull was calculated using the ‘sf_concave_hull’ function from the sf package using a concavity ratio of 0.3, and excluding holes. Predictions were made as catch per unit effort (CPUE, for 60 minutes) for tows conducted in the surface waters (i.e., head rope at 0 m). Continuous estimates are provided at a 0.5 km resolution throughout the Strait of Georgia. These estimates consist of 1) mean catch per unit effort (CPUE), 2) year-to-year coefficient of variation (CV) of CPUE as a measure of the temporal variability, 3) binned biscale measures of mean vs. CV of CPUE to distinguish areas where abundance is consistently high vs. areas where it is high on average, but with high year-to-year variability, and 4) mean standard error in CPUE as a measure of uncertainty. See Thompson and Neville for full method details. Uncertainties: Although the models had relatively low uncertainty and the estimated spatial patterns reflected the spatial and temporal variation in CPUE in the surveys, it is important to understand the limitations of these model predictions. Because juvenile salmon are often aggregated, there is high variability in the CPUE in the survey data. Our model predictions represent the geometric mean CPUE and so are an average expectation, but do not reproduce the high inter-tow variability that is present in the survey data. Spatially, our predictions have low uncertainty in areas that are central within the standard survey track line. However, uncertainty is higher on the margins of the survey area, where there are fewer sets to inform those predictions. Data Sources: Juvenile salmon survey database from Salmon Marine Interactions Program, REEFF, ESD, Pacific Biological Station. Data is also available through Canadian Data Report of Fisheries and Aquatic Sciences publications.
-

As part of the Musquash Marine Protected Area (MPA) Monitoring Plan, this project was implemented to establish a baseline for infaunal biodiversity for this area. Data collection began in 2010 and contributed monitoring information for productivity, biodiversity, and habitat indicators within the Musquash Harbour. A 1500 cubic centimetre ponar benthic grab was deployed at 30 random stations distributed over three strata (channel, intertidal and subtidal). Samples were to be collected up to three times per year to account for seasonality and annual variation. Once collected the benthic samples were analyzed for changes in grain size, carbon content (Loss on ignition), species abundance/diversity and biomass. Cite this data as: Cooper, J.A., and Blanchard, M. Musquash Benthic Infauna. Published in September 2023. Coastal Ecosystem Science Division, Fisheries and Oceans Canada, St. Andrews, NB. For additional information please see: Cooper, A., Abbott, M., Allard, K., Chang,, B., Courtenay, S., Doherty, P., Greenlaw, M., Ipsen, E., Koropatnick, T., Law, B., Losier, R., Martin, J., Methven, D., and Page, F. 2014. Musquash Estuary Marine Protected Area (MPA): Data Assessment. DFO Can. Sci. Advis. Sec. Res. Doc. 2014/001. v + 57 p. Cooper, J.A., Jones, O. and Blanchard, M. 2023. Review of Baseline Monitoring within the Musquash Estuary Marine Protected Area. DFO Can. Sci. Advis. Sec. Res. Doc. 2023/028. viii + 56 p. Oceans and Coastal Management Division (OCMD). 2015. Musquash Estuary Marine Protected Area Ecosystem Monitoring Plan (2014-2019). Can. Manuscr. Rep. Fish Aquat. Sci. 3077: v+17 pp. DFO. 2022. 2021 Review of Musquash Marine Protected Area Monitoring. DFO Can. Sci. Advis. Sec. Sci. Advis. Rep. 2022/016.
-
The Turkey Lakes Watershed (TLW) Study was established in 1979 by several federal government departments (Natural Resources Canada, Environment and Climate Change Canada, and Fisheries and Oceans Canada) to study the impacts of acid rain on aquatic and forest ecosystems but has since expanded to include other research on toxic contaminants, forest harvesting, habitat modification, and climate change. The TLW is a mixed hardwood forest with a 10.5 km squared area in the Canada Shield that drains into Lake Superior, and has been the focus of many interdisciplinary, whole-ecosystem studies on environmental issues. Benthic invertebrates, or insects found at the bottom of waterbodies, can be key indicators of stream health and play important roles in nutrient cycling and the food chain. In 1995, a project within the TLW aimed to evaluate how stream ecosystems respond to tree harvesting, which involved long-term surveys of benthic invertebrate communities pre- and post-harvest. Three stream catchments (c31, c33, c34) were harvested at different intensities in the summer of 1997 and were compared to multiple undisturbed catchments. Alongside the invertebrate data, corresponding stream habitat surveys, streamside litterfall traps, leaf decomposition, deposition of stream particulate matter, and standing sediment bedload data was collected during the same period. The data was collected from 1995-2009 by researchers at the Canadian Forest Service (Great Lakes Forestry Centre). This dataset is a rare and valuable resource because there are very few existing long-term datasets of benthic invertebrates from the same locations, and because this dataset is integrated with other biological and chemical datasets within the broader TLW database stored at the Open Government data repository. For an overview of other types of data available from the TLW, see https://doi.org/10.1002/hyp.14109, and for a complete list of publications that have been produced from data collected at this site, see https://www.canada.ca/en/environment-climate-change/services/turkey-lakes-watershed-study/publications.html.
-

The assessments layer represents all assessments undertaken under the Impact Assessment Act, including those that continue under the provisions of the Canadian Environmental Assessment Act, 2012. It includes assessments undertaken by the Impact Assessment Agency and other federal authorities as posted on the Canadian Impact Assessment Registry Internet site. The location of a given assessment included in the dataset is approximate and is based on information submitted by proponents, if applicable. More than one location may be identified for a given assessment. This dataset does not include information related to the footprint. Additional information about this dataset is available on the Canadian Impact Assessment Registry Internet site.
-
The Beaufort Sea and Mackenzie Delta dataset comes from the Petroleum and Environmental Management Tool (PEMT). The online tool was decommissioned in 2019 and the data was transferred to Open Data in order to preserve it. The PEMT was originally developed in 2009 to help guide development in the Canadian Arctic by Indian and Northern Affairs Canada (INAC). The online tool mapped the sensitivities of a variety of Arctic features, ranging from whales to traditional harvesting, across the Arctic. The tool was intended to aid government, oil and gas companies, Aboriginal groups, resource managers and public stakeholders in better understanding the geographic distribution of areas which are sensitive for environmental and socio-economic reasons. The study area and analytical resolution was defined using the oil and gas leasing grid within the Beaufort Sea. The study area has been the scene of oil and gas exploration activity since 1957. Oil was first discovered at Atkinson Point in 1969 and major gas fields in the early 1970s. Such finds spurred the proposal of the Mackenzie Valley Pipeline in 1974 and the addition of exploration and investment offshore. Exploration and drilling continued both onshore and offshore until the mid-1970s with the release of the Berger Report, which recommended a 10-year moratorium on the construction of the pipeline. After the release of the Berger Report, the pace of onshore activity declined but offshore exploration escalated in the 1980s. Offshore exploration was facilitated with innovative operating techniques and new offshore platforms that extended the ability to operate in the short open-water season and ice. With the minor exception of the small onshore gas field at Ikhil, no oil or gas has been commercially produced in the area. DISCLAIMER: Please refer to the PEMT Disclaimer document or the Resource Constraints - Use Limitation in the Additional Information section below. Note: This is one of the 3 (three) datasets included in the PEMT application which includes the High Arctic and Eastern Arctic datasets.