 Arctic SDI catalogue
North Atlantic
Type of resources
Available actions
Topics
Keywords
Contact for the resource
Provided by
Years
Formats
Representation types
Update frequencies
status
Service types
-
The North Atlantic current (red arrows) originates in the hot and salty Gulf Stream which flows out of the Mexican gulf and follows the east coast of the USA. When this current leaves the continental shelf and moves across the North Atlantic it’s often called the North Atlantic current. The North Atlantic current provides a significant amount of heat transport to northern Europe. This heat transport is greatest in winter because the current velocity is greater in that part of the year. The North Atlantic current keeps a very constant temperature and salinity throughout the year. It gradually looses heat and salinity as it flows towards the north east and gets mixed with colder and less salty water. At the south western part of the map where the current leaves the American continental shelf the surface temperature is 15-20 oC and the salinity is approximately 36. When it reaches the inlet to the Barents Sea the surface temperature is reduced to 5 oC in the winter and 10 oC in the summer, while the salinity stays at 35 throughout the year.The North Atlantic current continues into the Polar seas through the Fram Strait west of Svalbard and into the Barents Sea (pink arrows). When it reaches these areas its quickly chilled to 2-3 oC and the salinity sinks towards 34.7.The cooling of the North Atlantic current happens when it comes into contact with the colder and less salty Arctic current (blue arrows) that flows south west towards Svalbard’s east coast, south out of the Fram Strait and south out of the Davids Strait between Greenland and Canada. This current has salinity below 34 and the temperature is between -2 oC and +2 oC. In the same way as the North Atlantic current cools on the way north east the Arctic current heats up on its way towards the south west. The Arctic current does however give a significant colder climate around the coast of Greenland and along the Canadian Labrador- and Newfoundland-coasts compared to Europe coasts.Close to the coasts both on the eastern and western side of the North Atlantic there are lighter coastal currents with salinity between 25 and 34 (green arrows). In these areas both the temperature and salinity varies greatly throughout the season. They are warmer then the North Atlantic current during the summer and colder during the winter. In the same way the salinity varies greatly throughout the year because of the varying freshwater runoffs from land.
-
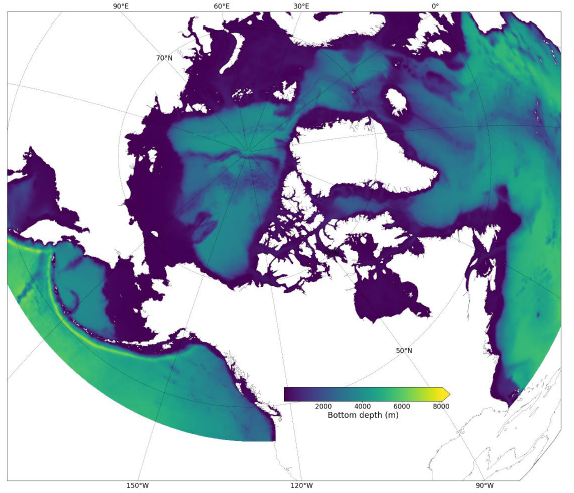
Data Description: Monthly mean simulation results from Canada's three Oceans model (sensitivity experiments--2017). Experiment codes can be matched to specific parameter sets following Table 1 in Christian et al 2026 from Canadian Technical Report of Fisheries and Aquatic Sciences 3721. Abstract from the report: A numerical ocean model with biogeochemistry has been developed for a domain that spans Canada's three oceans: the Atlantic, Pacific and Arctic. The domain extends to 26°N in the Atlantic and 44°N in the Pacific, and spans the full width of each basin as well as the whole of the Arctic Ocean. The resolution is moderate to high (≈0.25°, 75 levels). A series of simulations was conducted to assess the best choices for biogeochemical model parameters across the diverse regions, using a variety of validation data sets including satellite ocean colour (surface chlorophyll and particulate organic carbon, integrated primary production), surface underway pCO2, and depth profiles of oxygen and nitrate concentration from ships and Argo floats. An extensive set of parameter sensitivity experiments was conducted which are documented in detail here, with a focus on zooplankton grazing and phytoplankton and zooplankton mortality (linear and quadratic) parameters, and particle sedimentation rates. Sensitivity to many of the parameter adjustments examined is low, but the experiments conducted span the range from weak seasonal biological drawdown of surface inorganic carbon and nutrients, to excessively large drawdown and thermocline oxygen demand. Further, the general nonlinearity of the model response to parameter adjustments is shown by similar parameter sets having very different effects on different data metrics. In addition, the model solution's general insensitivity to some phytoplankton processes (exudation, chlorophyll photooxidation) that are neglected in the 'base case' model simulation is demonstrated. An optimal set of parameters for this domain is proposed, but it is possible that there are unexplored regions of the parameter space that could improve performance, especially if additional observational constraints are applied.
-
Description: This dataset consists of monthly mean simulation results from Canada's three Oceans: the Atlantic, Pacific and Arctic from 2015 to 2017. Abstract from the report: A numerical ocean model with biogeochemistry has been developed for a domain that spans Canada's three oceans: the Atlantic, Pacific and Arctic. The domain extends to 26°N in the Atlantic and 44°N in the Pacific, and spans the full width of each basin as well as the whole of the Arctic Ocean. The resolution is moderate to high (≈0.25°, 75 levels). A series of simulations was conducted to assess the best choices for biogeochemical model parameters across the diverse regions, using a variety of validation data sets including satellite ocean colour (surface chlorophyll and particulate organic carbon, integrated primary production), surface underway pCO2, and depth profiles of oxygen and nitrate concentration from ships and Argo floats. In addition to parameter values, processes examined include interactive sediments, fluvial nutrients, light attenuation by fluvial coloured dissolved organic matter (CDOM), and iron limitation. The results indicate that the optimal parameter set is one that limits phytoplankton losses to grazing and other processes so as to ensure strong biological drawdown of dissolved inorganic carbon and nutrients in spring and summer; among the parameter sets tested both insufficient and excessive drawdown were observed. Sensitivity to other processes such as interactive sediments, fluvial nutrients or CDOM attenuation was weak in most regions. In some regions, attenuation by CDOM or sequestration of nutrients in the sediment can substantially reduce primary production and zooplankton biomass, and fluvial nutrients can cause localized reduction of pCO2 by as much as 60 μatm. Iron limitation has an effect on the model solution in regions generally considered iron-replete; building a model that successfully spans iron-limited and non-iron-limited domains will require complete and accurate specification of iron sources and sinks.
-

The North Atlantic current (red arrows) originates in the hot and salty Gulf Stream which flows out of the Mexican gulf and follows the east coast of the USA. When this current leaves the continental shelf and moves across the North Atlantic itâs often called the North Atlantic current. The North Atlantic current provides a significant amount of heat transport to northern Europe. This heat transport is greatest in winter because the current velocity is greater in that part of the year. The North Atlantic current keeps a very constant temperature and salinity throughout the year. It gradually looses heat and salinity as it flows towards the north east and gets mixed with colder and less salty water. At the south western part of the map where the current leaves the American continental shelf the surface temperature is 15-20 oC and the salinity is approximately 36. When it reaches the inlet to the Barents Sea the surface temperature is reduced to 5 oC in the winter and 10 oC in the summer, while the salinity stays at 35 throughout the year.The North Atlantic current continues into the Polar seas through the Fram Strait west of Svalbard and into the Barents Sea (pink arrows). When it reaches these areas its quickly chilled to 2-3 oC and the salinity sinks towards 34.7.The cooling of the North Atlantic current happens when it comes into contact with the colder and less salty Arctic current (blue arrows) that flows south west towards Svalbardâs east coast, south out of the Fram Strait and south out of the Davids Strait between Greenland and Canada. This current has salinity below 34 and the temperature is between -2 oC and +2 oC. In the same way as the North Atlantic current cools on the way north east the Arctic current heats up on its way towards the south west. The Arctic current does however give a significant colder climate around the coast of Greenland and along the Canadian Labrador- and Newfoundland-coasts compared to Europe coasts.Close to the coasts both on the eastern and western side of the North Atlantic there are lighter coastal currents with salinity between 25 and 34 (green arrows). In these areas both the temperature and salinity varies greatly throughout the season. They are warmer then the North Atlantic current during the summer and colder during the winter. In the same way the salinity varies greatly throughout the year because of the varying freshwater runoffs from land.
-

“4VSW” missions focus on the eastern half of the Scotian Shelf, and occur primarily in March, but sets in both February, and April are also present in the data. These missions use a unique stratification scheme intended to optimize the abundance estimates of cod. Collected data includes total catch in numbers and weights by species. Length frequency data is available for most species, as are the age, sex, maturity and weight information for a subset of the individual animals. Other data such as ageing material, genetic material, and stomach contents are often also collected, but are stored elsewhere. Cite this data as: Clark, D., Emberley, J. Data of Maritimes 4VSW Research Vessel Survey. Published January 2021. Population Ecology Division, Fisheries and Oceans Canada, Dartmouth, N.S. https://open.canada.ca/data/en/dataset/a851ce30-e216-4d7d-a29c-05631eef140e
-
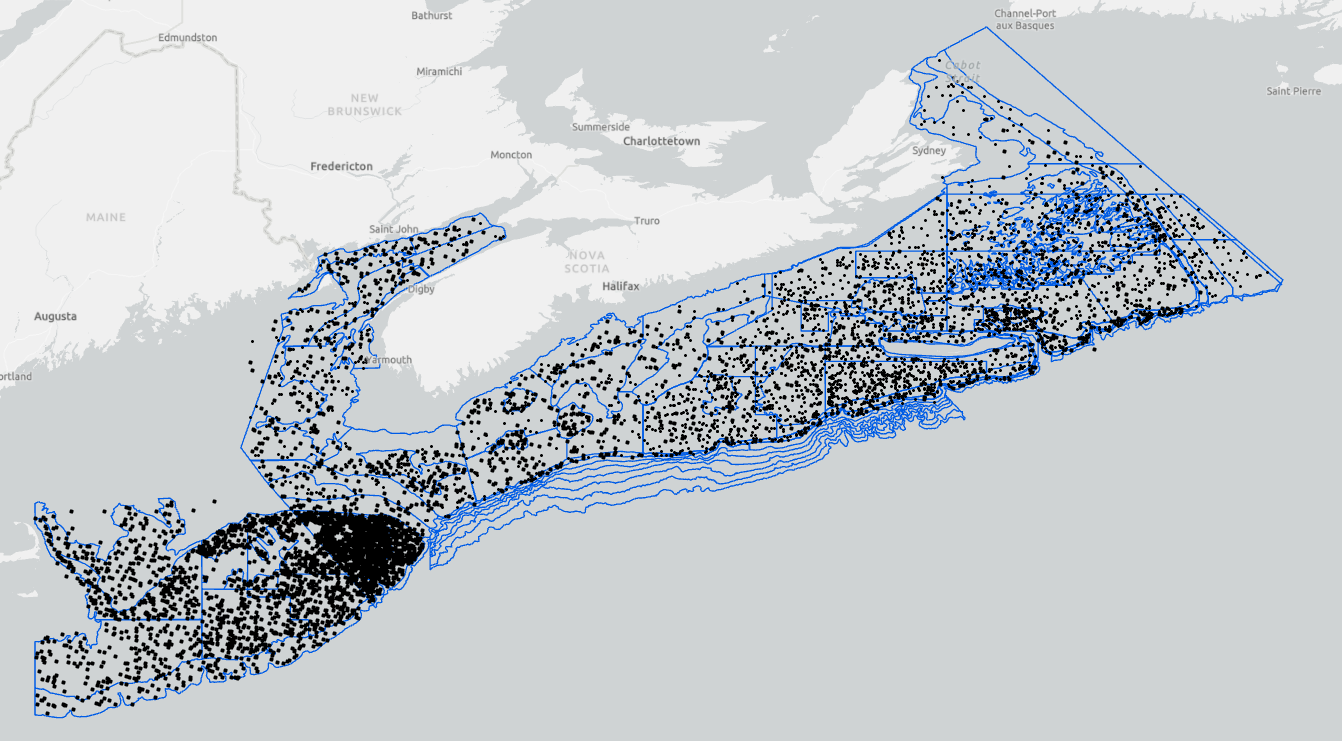
The Fisheries and Oceans Canada ecosystem surveys are conducted annually and are a source of integrated ecosystem monitoring data. These survey data are the primary data source for monitoring trends in species distribution, abundance, and biological condition within the region, and also provide data to the Atlantic Zonal Monitoring Program (AZMP) for monitoring hydrographic conditions, along with zooplankton and phytoplankton. The surveys follow a stratified random sampling design, and include sampling using a bottom otter trawl, CTD rosette and vertical plankton tows. Data from the bottom trawl catch are used to monitor the distribution and abundance of fish and invertebrates throughout the Scotian Shelf, Bay of Fundy and Georges Bank. Cite this data as: Clark, D., Emberley, J. Data of MARITIMES RESEARCH VESSEL SURVEYS. Published January 2021. Population Ecology Division, Fisheries and Oceans Canada, Dartmouth, N.S. https://open.canada.ca/data/en/dataset/8ddcaeea-b806-4958-a79f-ba9ab645f53b
-

The Fisheries and Oceans Canada (DFO) ecosystem surveys consist of research vessel survey data collected to monitor the distribution and abundance of fish and invertebrates throughout the Scotian Shelf, Bay of Fundy and Georges Bank. The surveys follow a stratified random sampling design, and include sampling of fish and invertebrates using a bottom otter trawl. These survey data are the primary data source for monitoring trends in species distribution, abundance, and biological condition within the region, and also provide data to the Atlantic Zonal Monitoring Program (AZMP) for monitoring hydrographic variability. Collected data includes total catch in numbers and weights by species. Length frequency data is available for most species, as are the age, sex, maturity and weight information for a subset of the individual animals. Other data such as ageing material, genetic material, and stomach contents are often also collected, but are stored elsewhere. “Spring” cruises occur in January, February, March and April, and focus on Georges Bank (i.e. 5Z). Cite this data as: Clark, D., Emberley, J. Data of MARITIMES SPRING RESEARCH VESSEL SURVEY. Published January 2021. Population Ecology Division, Fisheries and Oceans Canada, Dartmouth, N.S. https://open.canada.ca/data/en/dataset/fecf045a-95a2-4b69-8a40-818649a62716
-

"Fall" missions occur primarily in October and November, but sets from September and December are also present in the data. Collected data includes total catch in numbers and weights by species. Length frequency data is available for most species, as are the age, sex, maturity and weight information for a subset of the individual animals. Other data such as ageing material, genetic material, and stomach contents are often also collected, but are stored elsewhere. "Fall" cruises occur in September, October, November and December. Cite this data as: Clark, D., Emberley, J. Data of Maritimes Fall Research Vessel Survey. Published January 2021. Population Ecology Division, Fisheries and Oceans Canada, Dartmouth, N.S. https://open.canada.ca/data/en/dataset/5f82b379-c1e5-4a02-b825-f34fc645a529
-
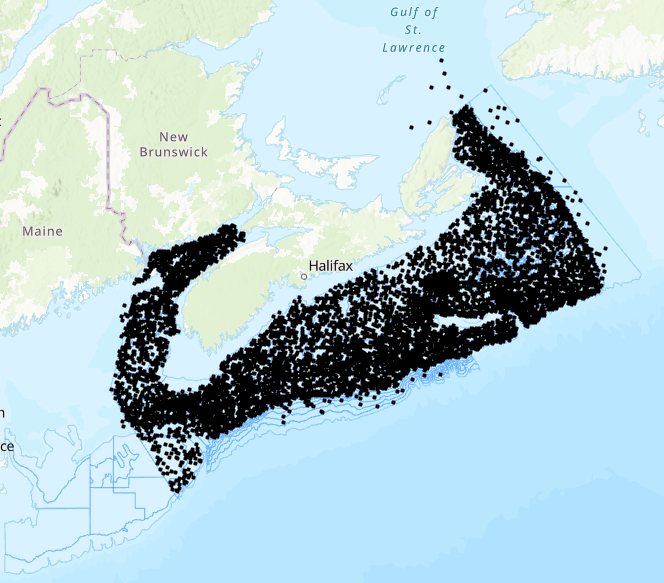
“Summer” missions occur in June, July and August and these focus on the Scotian Shelf and Bay of Fundy (i.e. 4VWX 5Yb, expanding recently to include the Laurentian Channel and Georges Bank (5Zc). Collected data includes total catch in numbers and weights by species. Length frequency data is available for most species, as are the age, sex, maturity and weight information for a subset of the individual animals. Other data such as ageing material, genetic material, and stomach contents are often also collected, but are stored elsewhere. “Summer” cruises occur in May, June, July and August and these focus on the Scotian Shelf and Bay of Fundy (i.e. 4VWX). Cite this data as: Clark, D., Emberley, J. Data of MARITIMES SUMMER RESEARCH VESSEL SURVEYS. Published January 2021. Population Ecology Division, Fisheries and Oceans Canada, Dartmouth, N.S. https://open.canada.ca/data/en/dataset/1366e1f1-e2c8-4905-89ae-e10f1be0a164
-
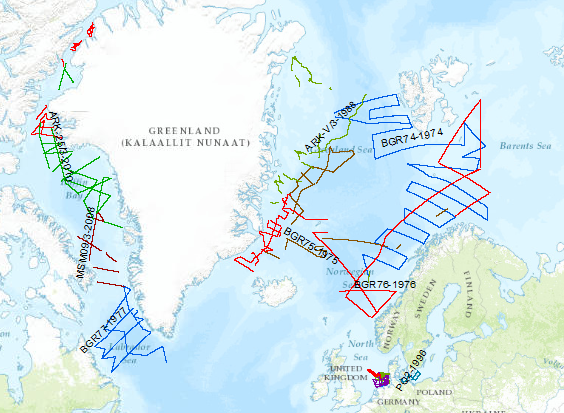
During the period from 1974 to 2010 various cruises from BGR acquired seismic lines worldwide. The aim of these marine expeditions was a detailed survey of the geological structure.