 Arctic SDI catalogue
Sciences de la terre
Type of resources
Available actions
Keywords
Contact for the resource
Provided by
Years
Formats
Representation types
Update frequencies
status
Service types
Scale
-

The “Land Cover for Agricultural Regions of Canada, circa 2000” is a thematic land cover classification representative of Circa 2000 conditions for agricultural regions of Canada. Land cover is derived from Landsat5-TM and/or 7-ETM+ multi-spectral imagery by inputting imagery and ground reference training data into a Decision-Tree or Supervised image classification process. Object segmentation, pixel filtering, and/or post editing is applied as part of the image classification. Mapping is corrected to the GeoBase Data Alignment Layer. National Road Network (1:50,000) features and other select existing land cover products are integrated into the product. UTM Zone mosaics are generated from individual 30 meter resolution classified scenes. A spatial index is available indicating the Landsat imagery scenes and dates input in the classification. This product is published and compiled by Agriculture and Agri-Food Canada (AAFC), but also integrates products mapped by other provincial and federal agencies; with appropriate legend adaptations. This release includes UTM Zones 9, 10, 11, 12, 13, 14, 15, 16, 17, 18, 19, 20, 21, and 22 for corresponding agricultural regions in Newfoundland, Prince Edward Island, Nova Scotia, New Brunswick, Québec, Ontario, Manitoba, Saskatchewan, Alberta and British Columbia covering approximately 370,000,000 hectares of mapped area. Mapped classes include: Water, Exposed, Built-up, Shrubland, Wetland, Grassland, Annual Crops, Perennial Crops and Pasture, Coniferous, Deciduous and Mixed forests. However, emphasis is placed on accurately delineating agricultural classes, including: annual crops (cropland and specialty crops like vineyards and orchards), perennial crops (including pastures and forages), and grasslands.
-
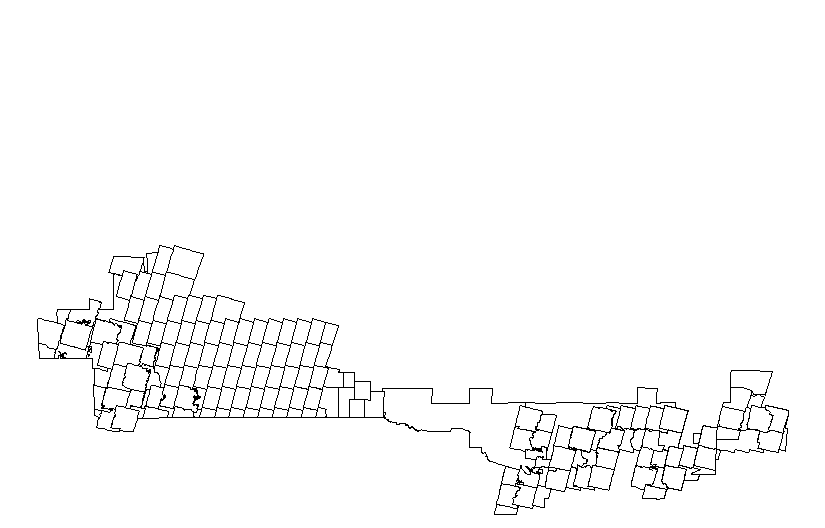
The “Land Cover for Agricultural Regions of Canada (circa 2000), Date Index” dataset is a geospatial data layer containing polygon features representing the Landsat scene number, associated dates and other products that were incorporated into the thematic land cover classification which is contained within the AAFC Landcover (circa 2000) product.
-

The National Ecological Framework for Canada's "Soil Development by Ecoprovince” dataset contains tables that provide soil development information for components within the ecoprovince framework polygon. It provides soil development codes and their English and French-language descriptions as well as the percentage of the polygon that the component occupies. The soil development descriptions are based on the second edition of the Canadian System of Soil Classification (Agriculture Canada Expert Committee on Soil Survey, 1987).
-

The Agri-Environmental Indicator (AEI) dataset series provides information that was created using indicators that assess the environmental impact of agricultural activities. These agri-environmental indicators integrate information on soils, climate and land surface features with statistics on land use and crop and livestock management practices. The datasets provide valuable, location-specific information on the overall environmental risks and conditions in agriculture across Canada and how these change over time. This dataset series collects AEI data that is related to geographic features and can be represented on a map. Other types of AEI data are not included. The datasets can be organized into the following major groups: • Farm land management • Soil health • Water quality • Air quality • Food and beverage industry (not included) Farm land management datasets: • Soil cover • Wildlife habitat • Farm land management (not included) Soil health datasets: • Soil erosion • Soil organic matter • Trace elements • Soil salinity Water quality datasets: • Nitrogen • Phosphorus • Coliforms • Pesticides Air quality datasets: • Greenhouse Gases • Ammonia • Particulate Matter
-

The AAFC Infrastructure Flood Mapping in Saskatchewan 20 centimeter colour orthophotos is a collection of georeferenced color digital orthophotos with 20 cm pixel size. The imagery was delivered in GeoTIF and ECW formats. The TIF and ECW mosaics were delivered in the same 1 km x 1 km tiles as the LiDAR data, and complete mosaics for each area in MrSID format were also provided. The digital photos were orthorectified using the ground model created from the DTM Key Points. With orthorectification, only features on the surface of the ground are correctly positioned in the orthophotos. Objects above the surface of the ground, such as building rooftops and trees, may contain horizontal displacement due to image parallax experienced when the photos were captured. This is sometimes apparent along the cut lines between photos. For positioning of above-ground structures it is recommended to use the LiDAR point clouds for accurate horizontal placement.
-

McElhanney Consulting Services Ltd (MCSL) has performed a LiDAR and Imagery survey in southern Saskatchewan. The acquisition was completed between the 16th and 25th of October, 2009. The survey consisted of approximately 790 square kilometers of coverage. While collecting the LiDAR data, we also acquired aerial photo in RGB and NIR modes consisting of 1649 frames each.
-

The proportion of agricultural land as percentage of Soil Landscape of Canada (SLC) polygon area data set depicts areas of greater than 2% of agriculture within agricultural extents of Canada.
-
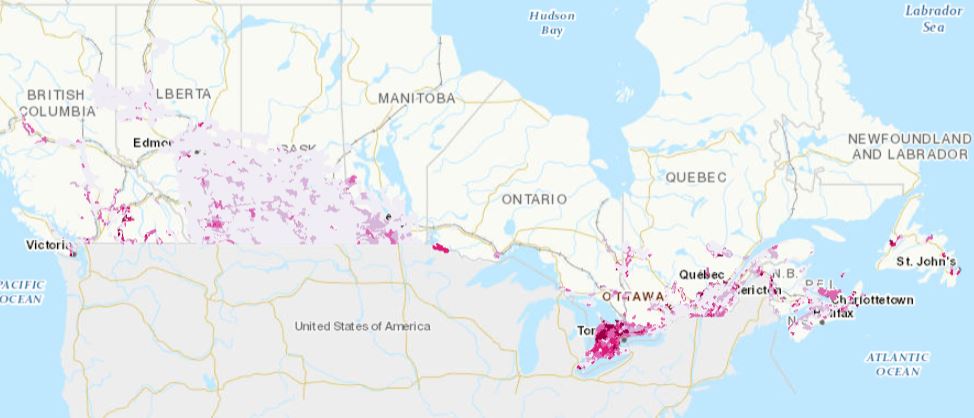
The Agri-Environmental Indicator Soil Erosion Risk dataset provides the estimated risk of soil loss from the combined effects of wind, water, and tillage for Soil Landscapes of Canada agricultural areas for each year since 1981 to 2021.
-
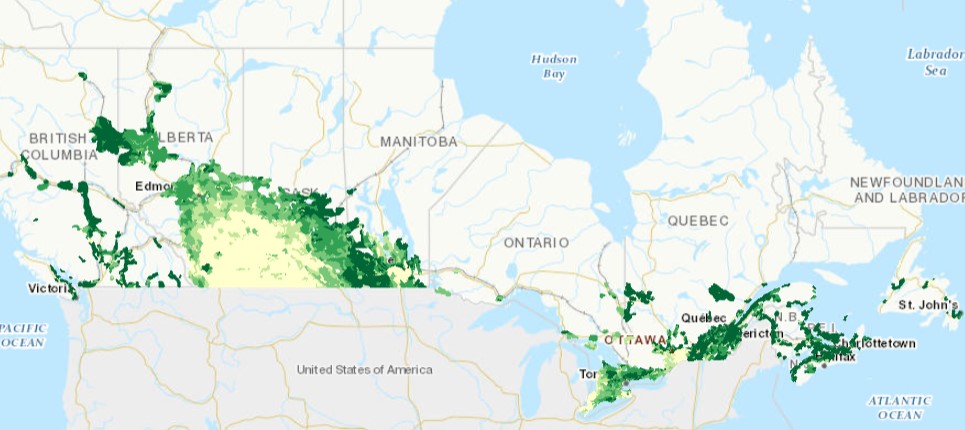
The Agri-Environmental Indicator Residual Soil Nitrogen (RSN) dataset estimates the amount of nitrogen remaining in the soil at the end of the growing season (after harvest) on Canadian agricultural lands annually.
-
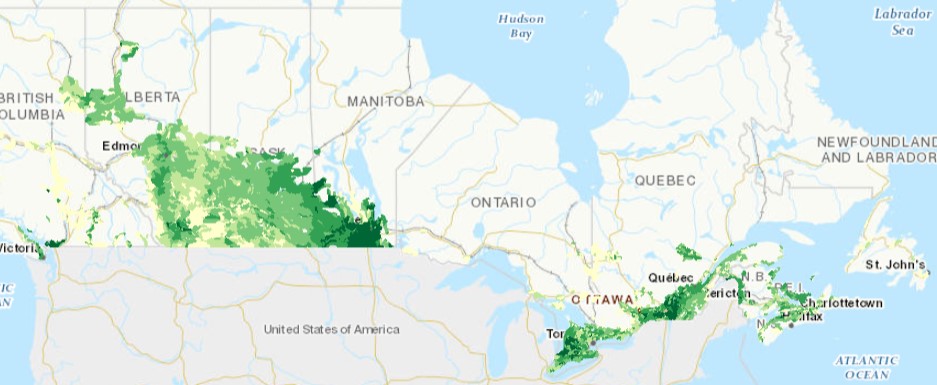
The Agri-Environmental Indicator Particulate Matter dataset provides an estimated net emissions of particulate matter from agricultural lands.