Sustainable development
Type of resources
Available actions
Topics
Keywords
Contact for the resource
Provided by
Formats
Representation types
Update frequencies
status
-

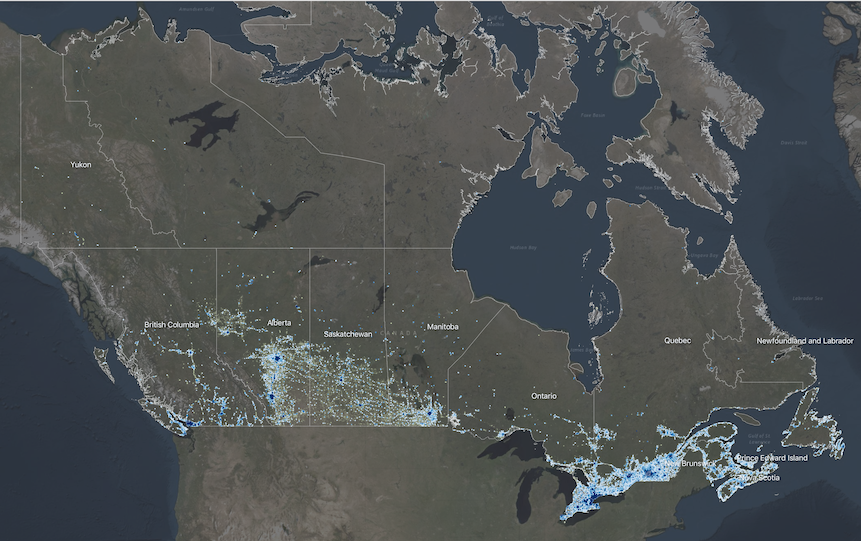
The Physical Exposure component of the National Human Settlement Layer (NHSL), defined here as the ‘Physical Exposure Model’, includes a delineation of settled areas and related land use across Canada, as well as information about buildings, persons, and building replacement values (structure and contents) within those areas. Buildings within the inventory are classified using a combination of occupancy types, engineering-based construction types adopted for Canada, and design levels representing the approximate building code requirements at the time of construction. The inventory is derived from detailed housing statistics provided at the dissemination area level as part of the 2016 national census and from georeferenced business listings. Building populations at different times of day are estimated for standard daytime hours (9am-5pm); for morning and evening commute hours (7am-9am; 5pm-7pm), and; for nighttime hours when the majority of people are home (7pm-7am). Replacement values are provided for structural, nonstructural, and contents components of buildings, based on industry replacement costs for representative regions across Canada. The physical exposure model is provided in two formats: (1) According to settled areas (i.e., polygons), which are areas that approximately delineate clusters of buildings across Canada. Summary statistics about buildings and populations within each settled area boundary are provided. (2) According to building archetypes (i.e., points) within settled areas. These are represented as point locations at the centroid of the corresponding settled area, and each settled area can have multiple point features corresponding to different building archetypes present within that area. In total, the model characterizes 35.2 million people in 9.7 million buildings across 390,000 locations with a total approximate replacement value of $8.2 trillion (2019 CAD) including contents.
-

The Social Vulnerability component of the National Human Settlement Layer (NHSL) includes information about broad spatial patterns of social vulnerability at the neighbourhood scale, and indicators about the capacities for a community to withstand and recover from disaster events based on intrinsic characteristics of housing, family structure, individual autonomy and financial agency. Information in the model provides a means of comparing relative levels of social vulnerability from one region to another across Canada and helps to identify specific dimensions within a community that contributes to their relative levels of social vulnerability. This information is not intended for site-specific study, but instead to understand broad patterns of social characteristics and vulnerability across multiple census dissemination areas.
-

The Canadian Environmental Sustainability Indicators (CESI) program provides data and information to track Canada's performance on key environmental sustainability issues. These indicators track facility-based releases to water of 3 substances that are defined as toxic under the Canadian Environmental Protection Act, 1999: mercury, lead and cadmium and their compounds. For each substance, data are provided at the national, regional (provincial and territorial) and facility level, as well as by source. The indicators inform Canadians about releases to water of these 3 substances from facilities in Canada. The Releases of harmful substances to water indicators also help the government to identify priorities and develop or revise strategies to inform further risk management and to track progress on policies put in place to reduce or control these 3 substances and water pollution in general. Information is provided to Canadians in a number of formats including: static and interactive maps, charts and graphs, HTML and CSV data tables and downloadable reports. See the supplementary documentation for the data sources and details on how the data were collected and how the indicator was calculated. Canadian Environmental Sustainability Indicators: https://www.canada.ca/environmental-indicators
-
The Canadian Environmental Sustainability Indicators (CESI) program provides data and information to track Canada's performance on key environmental sustainability issues. These indicators track facility-based releases to water of 4 substances that are defined as toxic under the Canadian Environmental Protection Act, 1999: mercury, lead, cadmium and arsenic and their compounds. For each substance, data are provided at the national, regional (provincial and territorial) and facility level, as well as by source. The indicators inform Canadians about releases to water of these 4 substances from facilities in Canada. The Releases of harmful substances to water indicators also help the government to identify priorities and develop or revise strategies to inform further risk management and to track progress on policies put in place to reduce or control these 4 substances and water pollution in general.Information is provided to Canadians in a number of formats including: static and interactive maps, charts and graphs, HTML and CSV data tables and downloadable reports. See the supplementary documentation for the data sources and details on how the data were collected and how the indicator was calculated. Canadian Environmental Sustainability Indicators: https://www.canada.ca/environmental-indicators
-

The Canadian Environmental Sustainability Indicators (CESI) program provides data and information to track Canada's performance on key environmental sustainability issues. These indicators track facility-based releases to water of 3 substances that are defined as toxic under the Canadian Environmental Protection Act, 1999: mercury, lead and cadmium and their compounds. For each substance, data are provided at the national, regional (provincial and territorial) and facility level, as well as by source. The indicators inform Canadians about releases to water of these 3 substances from facilities in Canada. The Releases of harmful substances to water indicators also help the government to identify priorities and develop or revise strategies to inform further risk management and to track progress on policies put in place to reduce or control these 3 substances and water pollution in general. Information is provided to Canadians in a number of formats including: static and interactive maps, charts and graphs, HTML and CSV data tables and downloadable reports. See the supplementary documentation for the data sources and details on how the data were collected and how the indicator was calculated. Canadian Environmental Sustainability Indicators: https://www.canada.ca/environmental-indicators
-

The National Human Settlement Layer (NHSL) is a collection of thematic datasets that describe the physical, social and economic characteristics of urban centres and rural/remote communities across Canada, and their vulnerability to natural hazards of concern. Detailed information on land use, buildings, people and capital assets are provided at the Census Dissemination Area administrative level for more than 454,000 settled areas across Canada. The Physical Exposure Layer includes a delineation of human settlement areas and related functional land use classes across Canada, and provides detailed information on construction type, occupancy and design level of more than 9.1 million buildings; population dynamics at different times of day for 35.1 million people, and; capital asset valuation of buildings and contents totaling more than 8.3 trillion CAD$. The Social Fabric Layer utilizes Census demographic data to evaluate broad spatial patterns of vulnerability, and neighbourhood-level capacities to withstand and recover from disaster events based on intrinsic characteristics of housing, family structure, individual autonomy and financial agency. Although developed to support quantitative risk assessments and implementation of the Sendai Framework for Disaster Risk Reduction at local and regional scales in Canada, the NHSL is also suitable for use in other integrated landscape modeling applications, including climate change adaptation and sustainable land use planning.
-

The Canadian Environmental Sustainability Indicators (CESI) program provides data and information to track Canada's performance on key environmental sustainability issues. These indicators track facility-based releases to water of 3 substances that are defined as toxic under the Canadian Environmental Protection Act, 1999: mercury, lead and cadmium and their compounds. For each substance, data are provided at the national, regional (provincial and territorial) and facility level, as well as by source. The indicators inform Canadians about releases to water of these 3 substances from facilities in Canada. The Releases of harmful substances to water indicators also help the government to identify priorities and develop or revise strategies to inform further risk management and to track progress on policies put in place to reduce or control these 3 substances and water pollution in general. Information is provided to Canadians in a number of formats including: static and interactive maps, charts and graphs, HTML and CSV data tables and downloadable reports. See the supplementary documentation for the data sources and details on how the data were collected and how the indicator was calculated. Canadian Environmental Sustainability Indicators: https://www.canada.ca/environmental-indicators
-
The Canadian Environmental Sustainability Indicators (CESI) program provides data and information to track Canada's performance on key environmental sustainability issues. The Air pollutant emissions indicators track emissions from human activities of 6 key air pollutants: sulphur oxides (SOX), nitrogen oxides (NOX), volatile organic compounds (VOCs), ammonia (NH3), carbon monoxide (CO) and fine particulate matter (PM2.5). Black carbon, which is a component of PM2.5, produced by combustion, is also reported. Sectoral indicators on air pollutant emissions from the oil and gas industry, transportation, off-road vehicles and mobile equipment and electric utilities provide additional analysis on the largest sources of Canada's air pollutant emissions. For each air pollutant, the indicators are provided at the national and provincial/territorial levels. They also identify the major sources of emissions and provide links to detailed information on air pollutant emissions from facilities. The Air pollutant emissions indicators are intended to inform Canadians and decision makers about progress made towards reducing emissions from human-related sources of air pollutants and about the effectiveness of emission reduction measures in reducing emissions to improve ambient air quality in Canada. Information is provided to Canadians in a number of formats including: static and interactive maps, charts and graphs, HTML and CSV data tables and downloadable reports. See the supplementary documentation for the data sources and details on how the data were collected and how the indicator was calculated. Canadian Environmental Sustainability Indicators: https://www.canada.ca/environmental-indicators
 Arctic SDI catalogue