 Arctic SDI catalogue

Type of resources
Available actions
Topics
Keywords
Contact for the resource
Provided by
Years
Formats
Representation types
Update frequencies
Service types
Scale
-

For the background of data production and data interpretation we refer to the PAME report “Modelling Arctic oceanographic connectivity to further develop PAME’s MPA toolbox”. The uploaded data consist of two main types: 1. Connectivity matrices describing the seascape connectivity in the model domain consisting of 40893 model grid cells. The connectivity matrices describe the probability of dispersal between any two selected model grid cells. 2. GIS shape files of dispersal distance (km) from each model grid cell within the model domain.
-
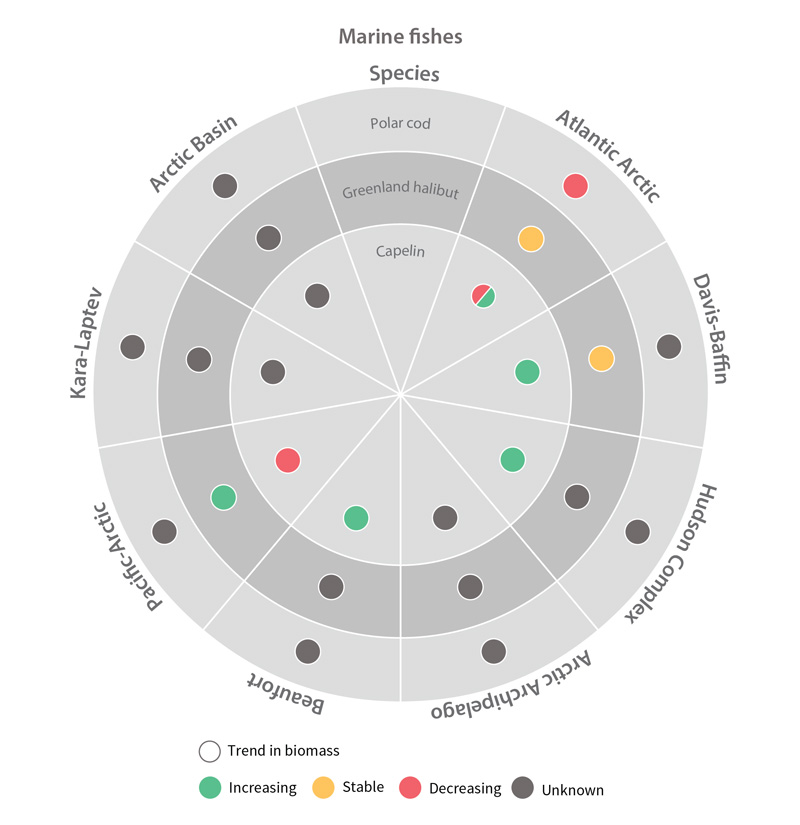
Trends in biomass of marine fish Focal Ecosystem Components across each Arctic Marine Area STATE OF THE ARCTIC MARINE BIODIVERSITY REPORT - Chapter 4 - Page 180 - Figure 4.4
-
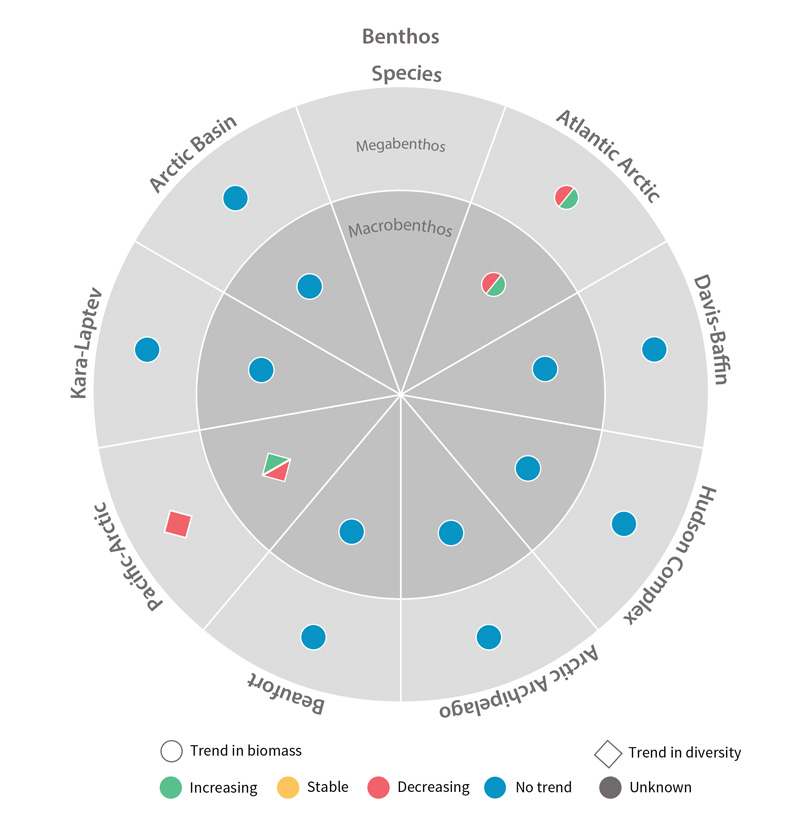
Trends in biomass or diversity of benthic Focal Ecosystem Components across each Arctic Marine Area. STATE OF THE ARCTIC MARINE BIODIVERSITY REPORT - Chapter 4 - Page 179 - Figure 4.3
-
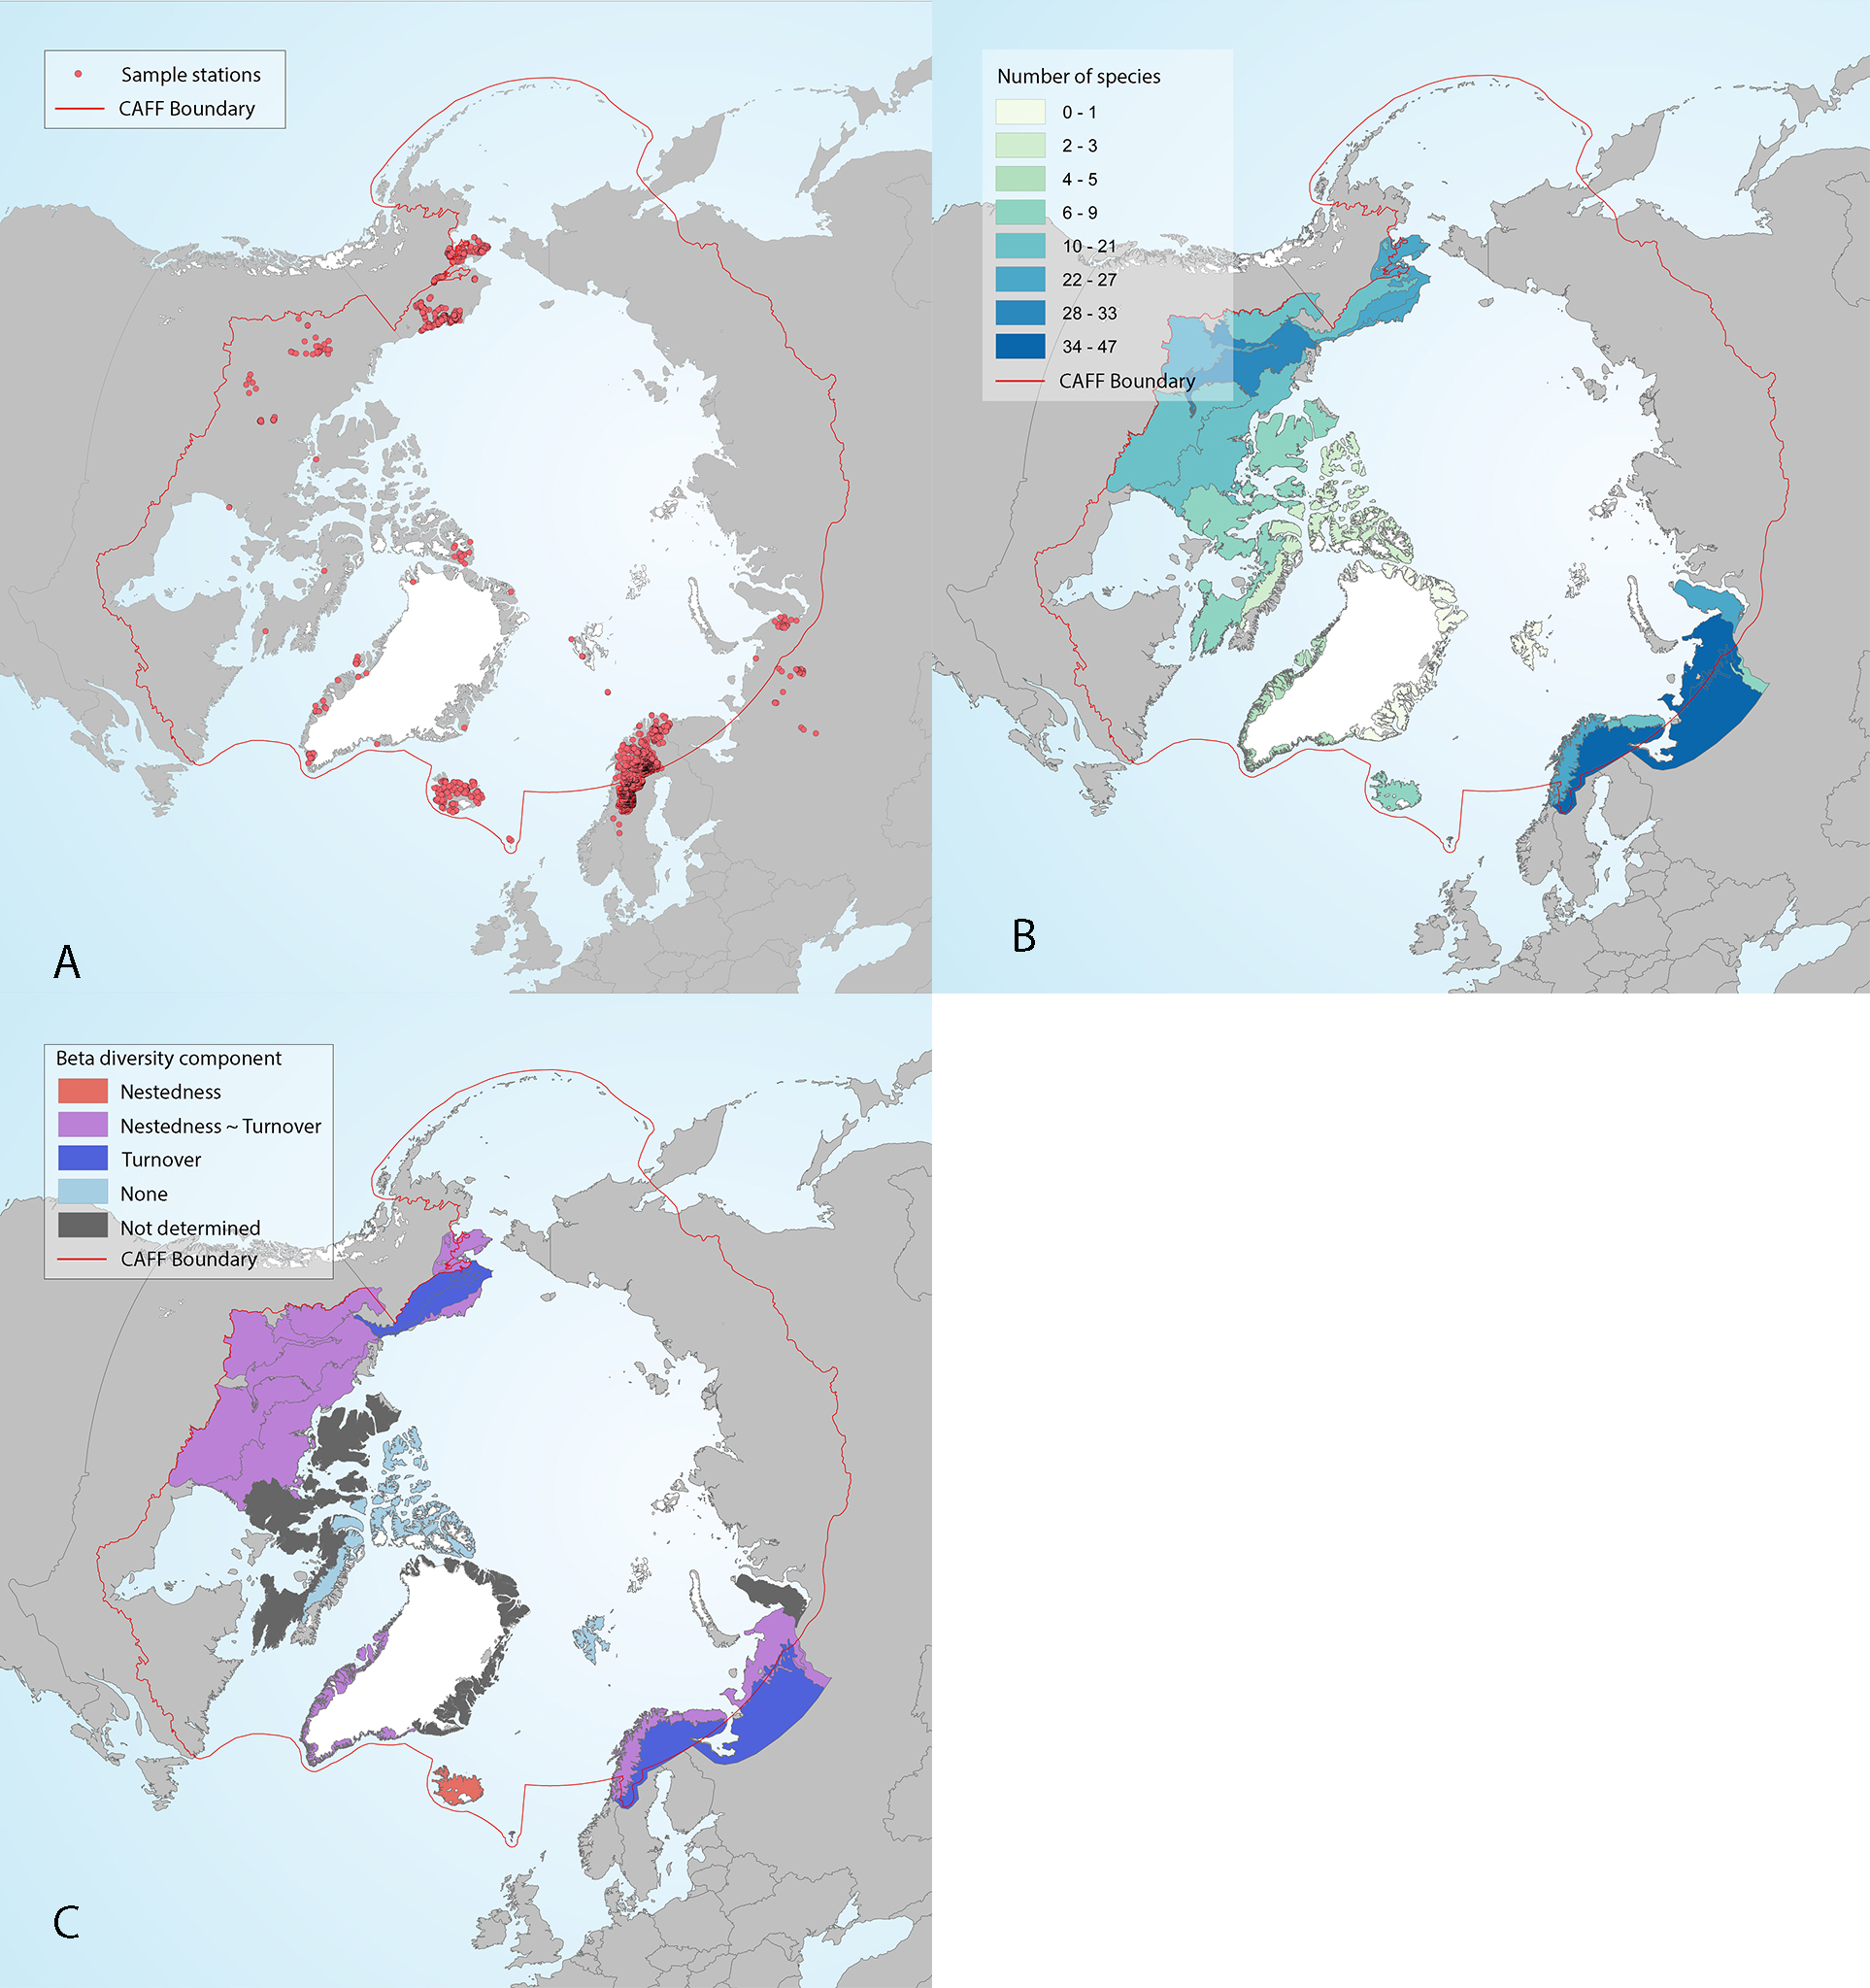
Figure 4 -36 Freshwater fish sampling stations (A), ecoregion alpha diversity in each of the sampled ecoregions, as quantified by estimates of species richness from reference texts (Muus and Dahlstrøm 1971, Scott and Crossman 1973, Mecklenburg et al. 2002) and expert knowledge (academic and government scientists and traditional knowledge) (B), and ecoregion beta diversity (C) characterized according to components of beta diversity as either nestedness, turnover, no diversity (none, beta = 0), or similar nestedness and turnover (nestedness ~ turnover) in the circumpolar Arctic. Ecoregions are shown only where sampling stations occur. Fish sampling stations included in this study assessed complete fish assemblages at each location. State of the Arctic Freshwater Biodiversity Report - Chapter 4 - Page 74 - Figure 4-36
-
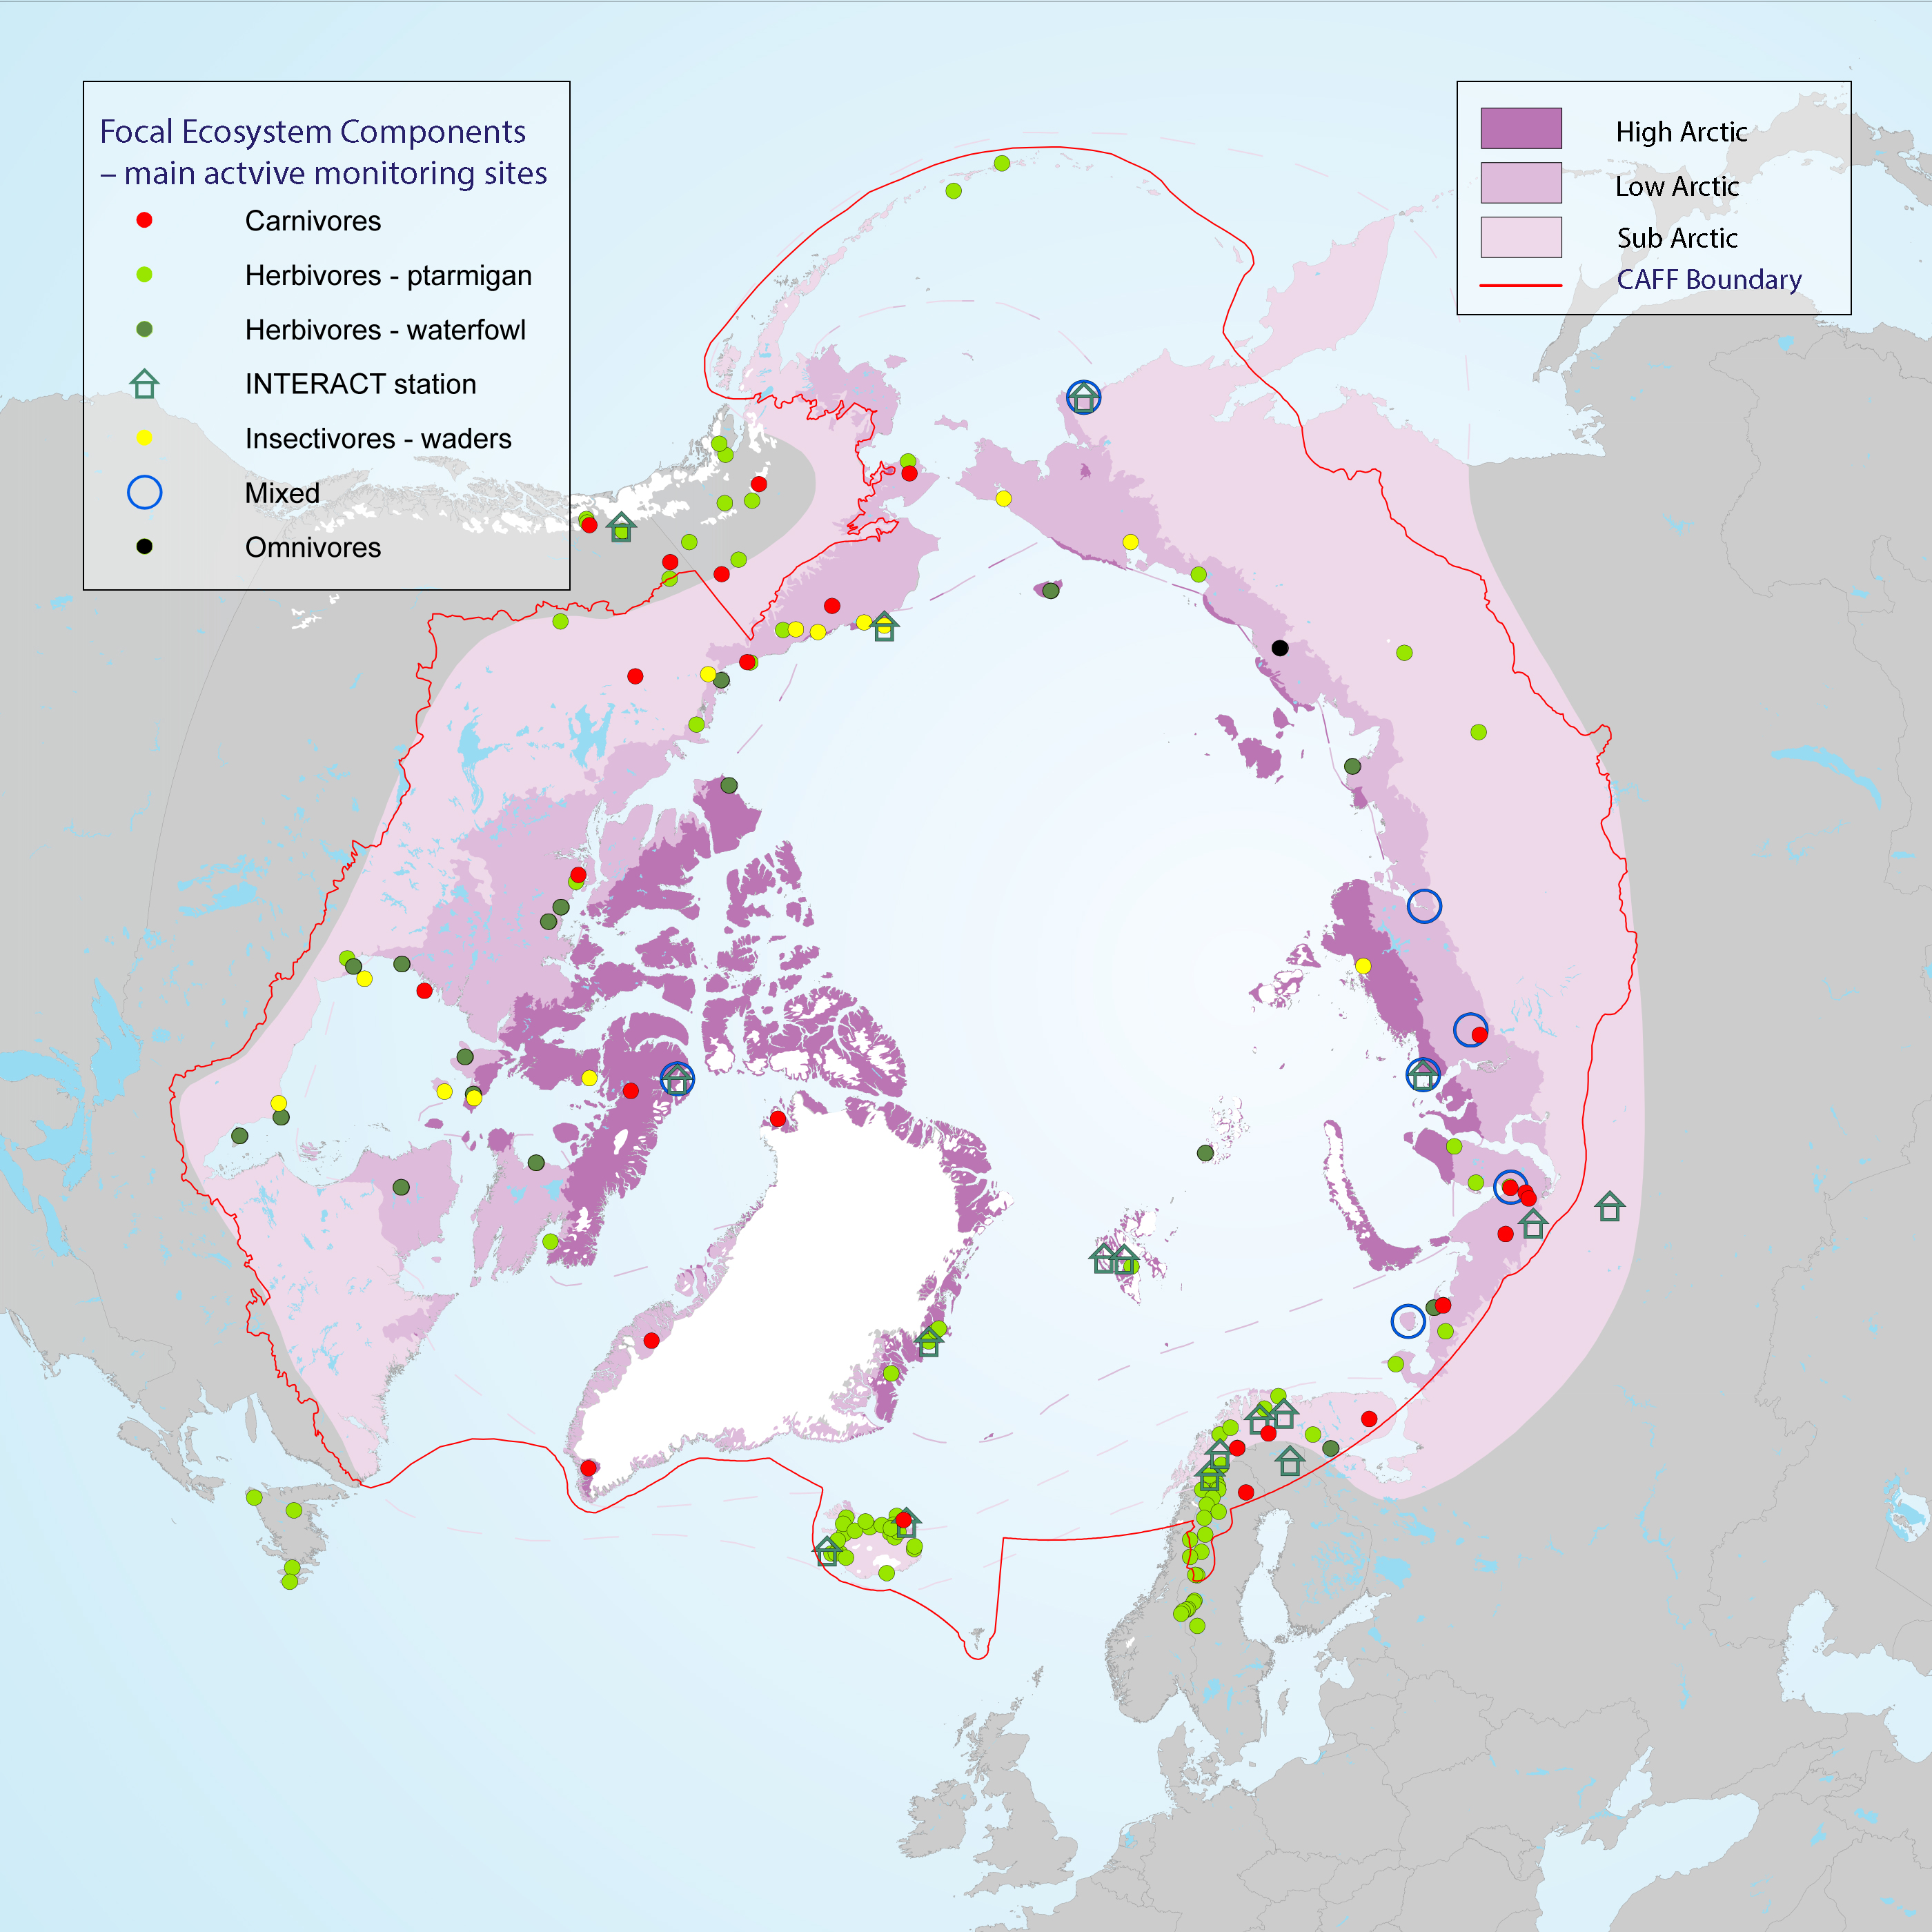
Many population counts of gregarious migrant species, such as waders and geese, take place along the flyways and at wintering grounds outside the Arctic which stresses the importance of continued development of movement ecology studies. Monitoring of FEC attributes related to breeding success and links to environmental drivers within the Arctic takes place in a wide network of research sites across the Arctic, although with low coverage of the high Arctic zone (Figure 3-25) STATE OF THE ARCTIC TERRESTRIAL BIODIVERSITY REPORT - Chapter 3 - Page 58 - Figure 3.25
-
Variation of average annual trawling activity (in hours) and macrobenthic biomass (g m-2), (a) and relationship of biomass with a four-year lag (mean value of time of the turnover in biomass value) to trawling activity, (b) along the Kola section of the Barents Sea during 1920-1997 (Denisenko 2001, 2013). STATE OF THE ARCTIC MARINE BIODIVERSITY REPORT - <a href="https://arcticbiodiversity.is/findings/benthos" target="_blank">Chapter 3</a> - Page 97 - Figure 3.3.5
-

Trends in total abundance of moths and species richness, from two locations in Iceland, 1995–2016. Trends differ between locations. The solid and dashed straight lines represent linear regression lines which are significant or non-significant, respectively. Modified from Gillespie et al. 2020a. STATE OF THE ARCTIC TERRESTRIAL BIODIVERSITY REPORT - Chapter 3 - Page 41 - Figure 3.14
-
Temporal trends of arthropod abundance for three habitat types at Zackenberg Research Station, Greenland, 1996–2016. Data are grouped as the FEC ‘arthropod prey for vertebrates’ and separated by habitat type. Solid lines indicate significant regression lines at the p<0.05. Modified from Gillespie et al. 2020a. STATE OF THE ARCTIC TERRESTRIAL BIODIVERSITY REPORT - Chapter 3 - Page 39 - Figure 3.9
-

Trends and distribution of muskoxen populations based on Table 3-5. Modified from Cuyler et al. 2020. STATE OF THE ARCTIC TERRESTRIAL BIODIVERSITY REPORT - Chapter 3 - Page 79 - Figure 3.30
-
Satellite-tracked SVP drifting buoys (Sybrandy and Niiler, 1991; Niiler, 2001) provide observations of near-surface circulation at unprecedented resolution. In September 2005, the Global Drifter Array became the first fully realized component of the Global Ocean Observing System when it reached an array size of 1250 drifters. A drifter is composed of a surface float which includes a transmitter to relay data, a thermometer which reads temperature a few centimeters below the air/sea interface, and a submergence sensor used to detect when/if the drogue is lost. The surface float is tethered to a subsurface float which minimizes rectification of surface wave motion (Niiler et al., 1987; Niiler et al., 1995). This in turn is tethered to a holey sock drogue, centered at 15 m depth. The drifter follows the flow integrated over the drogue depth, although some slip with respect to this motion is associated with direct wind forcing (Niiler and Paduan, 1995). This slip is greatly enhanced in drifters which have lost their drogues (Pazan and Niiler, 2000). Drifter velocities are derived from finite differencing their raw position fixes. These velocities, and the concurrent SST measurements, are archived at <a href="http://www.aoml.noaa.gov/phod/dac/dacdata.php" target="_blank">AOML's Drifting Buoy Data Assembly Center</a> where the data are quality controlled and interpolated to 1/4-day intervals (Hansen and Herman, 1989; Hansen and Poulain, 1996). Reference: Lumpkin, R. and Z. Garraffo, 2005: Evaluating the Decomposition of Tropical Atlantic Drifter Observations. J. Atmos. Oceanic Techn. I 22, 1403-1415.