 Arctic SDI catalogue
Newfoundland and Labrador
Type of resources
Available actions
Topics
Keywords
Contact for the resource
Provided by
Years
Formats
Representation types
Update frequencies
status
Service types
-

The water level data comes from the groundwater monitoring network of Nova Scotia (Canadian province). Each well in the observation network is equipped with a hydrostatic pressure transducer and a temperature sensor connected to a data logger. A second pressure transducer located above the water surface allows for adjusting the water level according to atmospheric pressure variations. The time series refers to the level below which the soil is saturated with water at the site and at the time indicated. The water level is expressed in meters above sea level (MASL). The dataset consists of a general description of the observation site including; the identifier, the name, the location, the elevation and a series of numerical values designating the water levels at a defined date and time of measurement.
-

Bivalve aquaculture has direct and indirect effects on plankton communities, which are highly sensitive to short-term (seasonal, interannual) and long-term climate changes, although how these dynamics alter aquaculture ecosystem interactions is poorly understood. Here, we investigate seasonal patterns in plankton abundance and community structure spanning several size fractions from 0.2 µm up to 5 mm, in a deep aquaculture embayment in northeast Newfoundland, Canada. Using flow cytometry and FlowCam imaging, we observed a clear seasonal relationship between fraction sizes driven by water column stratification (freshwater input, nutrient availability, light availability, water temperature). Plankton abundance decreased proportionally with increasing size fraction, aligning with size spectra theory. Within the bay, greater mesozooplankton abundance, and a greater relative abundance of copepods, was observed closest to the aquaculture lease. No significant spatial effect was observed for phytoplankton composition. While the months of August to October showed statistically similar plankton composition and size spectra slopes (i.e., food chain efficiency) and could be used for interannual variability comparisons of plankton composition, sampling for longer periods could capture long-term phenological shifts in plankton abundance and composition related to various processes, including climate change. Conclusions provide guidance on optimal sampling to monitor and assess aquaculture pathways of effects. Cite this data as: Sharpe H, Lacoursière-Roussel A, Gallardi D (2024). Ecological insight of seasonal plankton succession to monitor shellfish aquaculture ecosystem interactions. Version 3.2. Fisheries and Oceans Canada. Sampling event dataset. https://doi.org/10.25607/2ujdvh
-

A relative exposure index (REI), unweighted fetch, effective fetch, and other fetch-based indices (i.e., sum, minimum) were calculated for the Newfoundland and Labrador (NL) Shelves bioregion. Due to the extensive coastline of the study region, this analysis was conducted for a 5km buffered region along the coast at a spatial resolution of 250m. Detailed methods on the selection of input points for the NL bioregion are included below. Methods Preprocessing and input point selection: Land boundary files were obtained for Eastern Canada and the Canadian Arctic (NrCan 2017) at a scale of 1:50,000 as well as for Saint Pierre and Miquelon (Hijmans 2015), and the New England states (GADM 2012) however the scale at which these layers were produced is unknown. Land boundary files were merged into a single land polygon layer and watercourses reaching for in-land and/or above sea level were clipped from this polygon layer (Greyson 2021). A 5km buffer was generated around the NL provincial boundary. This buffer was then clipped by all land polygons to remove areas overlapping land polygons within the study area. All buffer segments intersecting the NAFO divisions within the NL bioregion were selected and the Union tool in ArcGIS Pro (v. 2.7.2) was used to fill-in gaps within the buffered area, creating a more continuous polygon. The buffered layer was then dissolved, and the NL provincial boundary polygon was erased from the buffered layer to create the study area polygon. A 250m fishnet was created and clipped to the study area (5km buffer layer) and the feature to point tool was used (with the “inside parameter checked”) to convert this grid into a point layer (approx. 1,000,000 points). The spatial resolution for all subsequent analyses was matched to the fishnet grid at 250m. References GADM database of Global Administrative Areas (2012). Global Administrative Areas, version 2.0. (accessed 2 December 2020). www.gadm.org Greyson, P (2021) Land boundary file for Eastern Canada, the Canadian Arctic, the New England States and Saint Pierre and Miquelon. [shapefile]. Unpublished data. Hijmans, R. and University of California, Berkeley, Museum of Vertebrate Zoology. (2015). First-level Administrative Divisions, Saint Pierre and Miquelon, 2015. UC Berkeley, Museum of Vertebrate Zoology. Available at: http://purl.stanford.edu/bz573nv9230 Natural Resources Canada (2017) Administrative Boundaries in Canada - CanVec Series - Administrative Features - Open Government Portal. (accessed 2 December 2020). https://open.canada.ca/data/en/dataset/306e5004-534b-4110-9feb-58e3a5c3fd97.
-

“Terra Nova National Park - Total Ecosystem Forest Carbon Density” is the annual carbon density (tonnes carbon per hectare) within Terra Nova’s forested ecosystems over a 31-year period from 1990 to 2020. Total Ecosystem Forest Carbon Density includes aboveground and belowground biomass, soil carbon, and dead organic matter. Total Ecosystem Forest Carbon Density was estimated for 31 national parks using the Generic Carbon Budget Model (GCBM), a spatially explicit carbon budget model developed by Canadian Forest Service which uses forest inventory, disturbance, and mean annual temperature data along with yield data to estimate growth and merchantable volume for dominant tree species. Species- and Ecozone-specific equations are then used to convert merchantable volume to aboveground and belowground biomass carbon. Ecozones were classified according to Canada Ecological Land Classification Level 1. The GCBM simulates carbon dynamics to produce spatially explicit estimations of carbon stocks and fluxes. The model simulates and tracks carbon stocks, transfers between Intergovernmental Panel on Climate Change-defined pools, and other metrics including net ecosystem production, net biome production, and emissions of carbon dioxide (CO2), methane (CH4), and nitrous oxide (N2O) in annual time steps. The stocks and fluxes are also tracked by disturbance event (e.g., forest fires, insect outbreaks). Total Ecosystem Forest Carbon Density accounts for the effects of natural and anthropogenic disturbances, including wildfires, prescribed burns, and insect outbreaks. These products have a spatial resolution of 30m. This information is part of the Parks Canada Carbon Atlas Series. To obtain a copy of this report, please contact changementclimatique-climatechange@pc.gc.ca. When using this data, please cite as follows: Sharma, T., Kurz, W.A., Fellows, M., MacDonald, A.L., Richards, J., Chisholm, C., Seutin, G., Richardson, K., Keenleyside, K. (2023). Parks Canada Carbon Atlas Series: Carbon Dynamics in the Forests of Canada’s National Parks. Scientific Report. Parks Canada Agency, Gatineau, QC, Canada, 104 p.
-
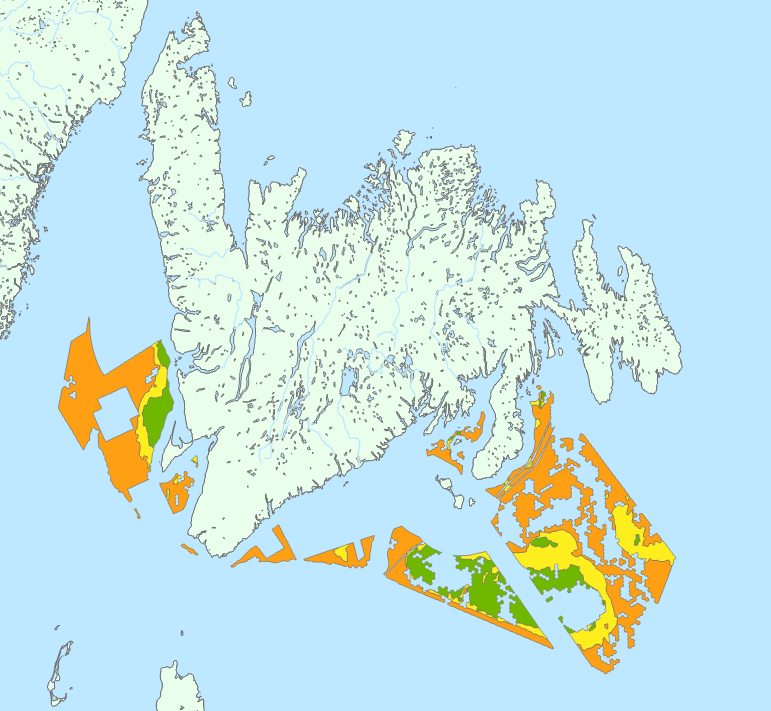
This geospatial data depicts preliminary offshore wind licencing areas recommended by the Committee for the Regional Assessment of Offshore Wind Development in Newfoundland and Labrador (Committee). These areas were identified as an interim product during the Regional Assessment process. The Committee is tasked to complete its Regional Assessment Report by January 2025. As part of the terms of amended agreement set out by the Governments of Canada and Newfoundland and Labrador, the Committee submitted an interim report to Ministers on March 22, 2024. This report included a preliminary map of recommended areas for offshore wind. Based on work completed to date, the Committee has found these areas are where offshore wind development is most likely feasible and will have the least impact within offshore Newfoundland and Labrador. These areas are preliminary and will be refined throughout the remainder of the Regional Assessment. Through the Regional Assessment process, the Committee is providing federal and provincial Ministers with information, knowledge, and analysis regarding future offshore wind development. Their work is intended to inform and improve future planning, licencing, and impact assessment processes. Any offshore wind areas identified by the Committee do not reflect official offshore wind licencing areas. The Committee is providing these areas to Ministers for their consideration, as the offshore wind regulatory process is being established.
-

Fisheries and Oceans Canada’s (DFO) Coastal Environmental Baseline Program supports the collection of ecological information on the current state of key coastal ecosystems across Canada. This initiative aims to acquire environmental baseline data (physical, chemical and biological) contributing to the characterization of important coastal areas and to support evidence-based assessments and management decisions for preserving marine ecosystems. From this page, you will find links to the data from projects undertaken from 2018-2022 at six coastal sites across Canada.
-

“Terra Nova National Park - Total GHG Emissions” datasets consist of estimates of GHG emissions (carbon dioxide (CO2), methane (CH4), and nitrous oxide (N2O)) in carbon dioxide equivalents (CO2e) from forested ecosystems in Terra Nova National Park from 1990 to 2020 (tonnes carbon dioxide equivalent per hectare). Total GHG emissions for 31 national parks were estimated using the Generic Carbon Budget Model (GCBM), a spatially explicit carbon budget model developed by Canadian Forest Service which uses forest inventory, disturbance, and mean annual temperature data along with yield data to estimate growth and merchantable volume for dominant tree species. Species- and Ecozone-specific equations are then used to convert merchantable volume to aboveground and belowground biomass carbon. The GCBM simulates carbon dynamics to produce spatially explicit estimations of carbon stocks and fluxes. The model simulates and tracks carbon stocks, transfers between Intergovernmental Panel on Climate Change (IPCC)-defined pools, and other metrics including net ecosystem production, net biome production, and emissions of carbon dioxide (CO2), methane (CH4), and nitrous oxide (N2O) in annual time steps. The stocks and fluxes are also tracked by disturbance event (e.g., forest fires). Total GHG emissions include those from natural processes like respiration and decomposition and those due to natural and anthropogenic disturbances, including wildfires, prescribed burns, and insect outbreaks. These were calculated as the sum of CO2, CH4, and N2O emission estimates in tonnes carbon (tonnes C) generated by the GCBM. Emissions estimates were then converted to carbon dioxide equivalents (CO2e) using the 100-year Global Warming Potential (IPCC Fourth Assessment Report) factors for CH4 (25) and N2O (298). These products have a spatial resolution of 30m. This information is part of the Parks Canada Carbon Atlas Series. To obtain a copy of this report, please contact changementclimatique-climatechange@pc.gc.ca. When using this data, please cite as follows: Sharma, T., Kurz, W.A., Fellows, M., MacDonald, A.L., Richards, J., Chisholm, C., Seutin, G., Richardson, K., Keenleyside, K. (2023). Parks Canada Carbon Atlas Series: Carbon Dynamics in the Forests of Canada’s National Parks. Scientific Report. Parks Canada Agency, Gatineau, QC, Canada, 104 p.
-

Cold-water corals are conspicuous in the waters off Eastern Canada. Despite that, there are few DNA sequence records from specimens collected in the region available in GenBank, and not all species recorded in the region have sequence data regardless of geographic origin. This can limit the use of eDNA techniques to detect and identify corals. Our objective was to sequence and publish sequences for two octocoral DNA barcoding markers: CO1 and MutS. We sequenced and deposited 36 sequences to GenBank from 19 specimens representing three sea pen taxa (Octocorallia: Pennatuloidea): Distichoptilum gracile, Pennatula aculeata, and Protoptilum carpenteri. Identification of all specimens was confirmed by B. M. Neves before submission. Specimens and DNA tissues were donated to the Canadian Museum of Nature, where they are currently stored. This publication is part 1 of a series of GenBank submissions by our lab. Specimens were collected from across the Northwest Atlantic and originate from depths ranging between 200-1924 meters. Specimens were collected as part of research vessel multispecies trawl surveys or remotely operated vehicle (ROV ROPOS) surveys. DNA was isolated and purified using the QIAgen DNeasy Blood and Tissue kit, with an initial overnight incubation with Proteinase K. Two commonly used octocoral barcoding regions were amplified using previously described primers: 1) COII8068F (McFadden et al., 2004) and COIOCTR (France and Hoover, 2002) for the CO1 gene, and 2) ND42599F (France and Hoover, 2002) and mut3458R (Sánchez et al., 2003) for the MutS gene. Amplifications were conducted using 12.5 µl of Green DreamTaq Master Mix (Thermo Fisher Scientific), 1 µl of template DNA, 0.5 µl of each 10 µM forward and reverse primers, 0.5 µl of 10 µM reverse primer, and 10.5 µl of water. Thermocycling was run as follows: 3 min of initial denaturation at 95 °C, followed by 40 cycles at 95 °C for 30 s, 30 s at annealing temperature of 48 °C, then 65 s at an extension temperature of 72 °C, and a final elongation at 72 °C for 4 min. PCR products were cleaned using Agencourt AMPure XP Beads (Beckman Coulter) and sent to The Center for Advanced Genomics, Toronto, Canada for Sanger sequencing. Sequences were visualized and aligned using Geneious Prime 2022.0.2. Obtained sequences have been deposited in GenBank under accession numbers OQ569768- OQ569784 and OQ420359- OQ420377. This work was funded by Fisheries and Oceans Canada under an Enhanced Regional Capacity grant (2020-2021) and the Marine Conservation Targets (MCT) program (2021-2024), Newfoundland and Labrador Region.
-

“Gros Morne National Park – Total GHG Emissions” datasets consist of estimates of GHG emissions (carbon dioxide (CO2), methane (CH4), and nitrous oxide (N2O)) in carbon dioxide equivalents (CO2e) from forested ecosystems in Gros Morne National Park from 1990 to 2020 (tonnes carbon dioxide equivalent per hectare). Total GHG emissions for 31 national parks were estimated using the Generic Carbon Budget Model (GCBM), a spatially explicit carbon budget model developed by Canadian Forest Service which uses forest inventory, disturbance, and mean annual temperature data along with yield data to estimate growth and merchantable volume for dominant tree species. Species- and Ecozone-specific equations are then used to convert merchantable volume to aboveground and belowground biomass carbon. The GCBM simulates carbon dynamics to produce spatially explicit estimations of carbon stocks and fluxes. The model simulates and tracks carbon stocks, transfers between Intergovernmental Panel on Climate Change (IPCC)-defined pools, and other metrics including net ecosystem production, net biome production, and emissions of carbon dioxide (CO2), methane (CH4), and nitrous oxide (N2O) in annual time steps. The stocks and fluxes are also tracked by disturbance event (e.g., forest fires). Total GHG emissions include those from natural processes like respiration and decomposition and those due to natural and anthropogenic disturbances, including wildfires, prescribed burns, and insect outbreaks. These were calculated as the sum of CO2, CH4, and N2O emission estimates in tonnes carbon (tonnes C) generated by the GCBM. Emissions estimates were then converted to carbon dioxide equivalents (CO2e) using the 100-year Global Warming Potential (IPCC Fourth Assessment Report) factors for CH4 (25) and N2O (298). These products have a spatial resolution of 30m. This information is part of the Parks Canada Carbon Atlas Series. To obtain a copy of this report, please contact changementclimatique-climatechange@pc.gc.ca. When using this data, please cite as follows: Sharma, T., Kurz, W.A., Fellows, M., MacDonald, A.L., Richards, J., Chisholm, C., Seutin, G., Richardson, K., Keenleyside, K. (2023). Parks Canada Carbon Atlas Series: Carbon Dynamics in the Forests of Canada’s National Parks. Scientific Report. Parks Canada Agency, Gatineau, QC, Canada, 104 p.
-

Exposure to wind-driven waves manifests an important physical gradient in the coastal zone that influences a variety of physical and biological processes (i.e., species distribution). Fetch, the unobstructed distance over which wind-driven waves can build, is a popular proxy for wave exposure at a given location commonly used for site-specific evaluations. Here, we provide two measures of fetch (unweighted fetch, effective fetch) and three fetch-derived indices of wave exposure (sum fetch, minimum fetch, and a relative exposure index) covering the coastal zones of two Canadian bioregions (Scotian Shelf-Bay of Fundy, Newfoundland-Labrador Shelves). For each region, we calculated fetch and exposure indices for input points in an evenly spaced fishnet grid (see linked records below for datasets by region). We provide unweighted fetch lengths (m) for 32 compass headings per input point (11.25° intervals), and effective fetch lengths for 8 headings per point (45° intervals). Effective fetch is a weighted average of multiple fetch measures around a given heading that reduces the influence of irregular coastline shape on exposure estimates. We also include calculations of the summed and minimum unweighted fetch lengths for each point that provide coarse proxies of exposure and distance to land, respectively. The relative exposure index (REI), provided as regional spatial layers in raster format, provides a more accurate metric of exposure by combining effective fetch with modelled wind speeds (m s-1) and frequency data. Users may also use fetch calculations to derive their own exposure layers using alternative sources of wind data, indices, or formulations. Detailed methodology on the calculations for fetch, effective fetch and REI are outlined in the Supplementary Information below. Citation information and differences in data pre-processing methods and spatial resolution of the regional analyses are described in their respective data records. The broad spatial coverage and high resolution offered by these indices are suitable to support regional-scale modelling and planning exercises. In particular, these indices will be of value to ongoing Marine Spatial Planning efforts, which includes regional conservation planning, that seek to evaluate the distribution of coastal species and overlap with human activities.