 Arctic SDI catalogue
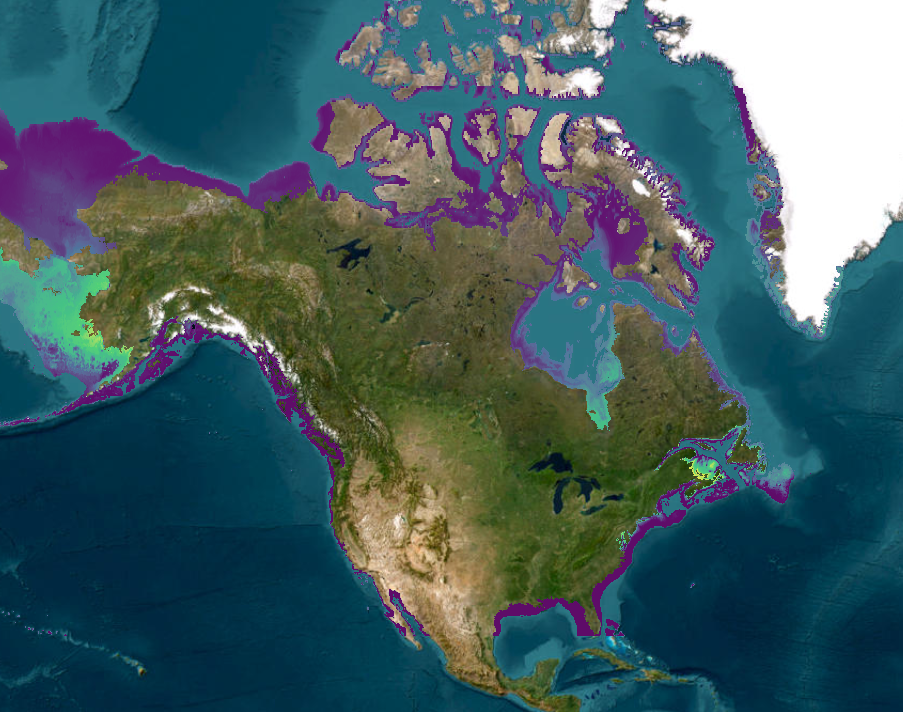
Aquatic Invasive Species
Type of resources
Topics
Keywords
Contact for the resource
Provided by
Formats
Representation types
Update frequencies
status
-
Monitoring data from DFO invasive species monitoring programs, along with occurrence information from online databases and the scientific literature, have been paired with high resolution environmental data and oceanographic models in species distribution models that predict present-day and project future distributions of 24 non-indigenous species (NIS) on North America`s east coast, and 31 NIS on its west coast. Future distributions were predicted for 2100, under Representative Concentration Pathway 8.5 from the Intergovernmental Panel on Climate Change’s fifth Assessment Report. Present-day and future richness of these species (i.e., hotspots) have been estimated by summing the occurrence probabilities of NIS. This data set includes the present-day and year 2100 species distribution modeling results for each species, and the estimated species richness. Cite this data as: Lyons DA., Lowen JB, Therriault TW., Brickman D., Guo L., Moore AM., Peña MA., Wang Z., DiBacco C. Data of: Updated species distribution models for marine invasive species hotspot identification. Published: November 2023. Coastal Ecosystems Science Division, Fisheries and Oceans Canada, Dartmouth, N.S. https://open.canada.ca/data/en/dataset/1439dcb3-82a6-40fd-a9a4-8f045b20ff5b
-

Since 2005, Fisheries and Oceans Canada has been collecting monitoring data for aquatic invasive species (e.g. https://open.canada.ca/data/en/dataset/8d87f574-0661-40a0-822f-e9eabc35780d, https://open.canada.ca/data/en/dataset/503a957e-7d6b-11e9-aef3-f48c505b2a29, https://open.canada.ca/data/en/dataset/8661edcf-f525-4758-a051-cb3fc8c74423). This monitoring data, as well additional occurrence information from online databases and the scientific literature, have been paired with high resolution environmental data and oceanographic models in species distribution models that predict the present-day and future potential distributions of 12 moderate to high risk invasive species on Canada’s east and west coasts. Future distributions were predicted for 2075, under Representative Concentration Pathway 8.5 from the Intergovernmental Panel on Climate Change’s fifth Assessment Report. Present-day and future richness of these species (i.e., hotspots) has also been estimated by summing their occurrence probabilities. This data set includes the occurrence locations of each species, the present-day and future species distribution modeling results for each species, and the estimated species richness. This research has been published in the scientific literature(Lyons et al. 2020). Lyons DA, Lowen JB, Therriault TW, Brickman D, Guo L, Moore AM, Peña MA, Wang Z, DiBacco C. (In Press) Identifying Marine Invasion Hotspots Using Stacked Species Distribution Models. Biological Invasions Cite this data as: Lyons DA., Lowen JB, Therriault TW., Brickman D., Guo L., Moore AM., Peña MA., Wang Z., DiBacco C. Data of: Species distribution models and occurrence data for marine invasive species hotspot identification. Published: November 2020. Coastal Ecosystems Science Division, Fisheries and Oceans Canada, Dartmouth, N.S. https://open.canada.ca/data/en/dataset/1bbd5131-8b34-4245-b999-3b4c4259d74f
-

Fisheries and Oceans Canada’s (DFO) National Biofouling Monitoring Program (BMP) has conducted annual field surveys to monitor the introduction, establishment, spread, species richness, and relative abundance of native and non-indigenous species (NIS) since 2006. Standardized monitoring protocols employed by DFO-Maritimes, -Gulf, and -Quebec Regions include biofouling collector plates deployed from May to October at intertidal and shallow subtidal, geo-referenced sites, including public and private docks, aquaculture lease sites, public and private marinas and yacht clubs. Initially in the Maritimes Region (2006-2017) collectors consisted of 3, 10 cm by 10cm PVC plates deployed in a vertical array and spaced approximately 40-cm apart with the shallowest plate hung at least 1 m below the surface to sample shallow subtidal and intertidal species (Sephton et al. 2011, 2017). Two replicate arrays were deployed at least 5 m apart per site. Since 2018, collector arrays were modified to enhance statistical replication, including 10 individual collectors deployed per site at 1 m depth and at least 5 m apart (as above) from May to October. The percent cover of AIS on all collectors was determined by visual examination and scored as follows; (i) ‘0’ = absent, (ii) ‘1’ = ≤25 % cover, (iii) ‘2’ = 25 to ≤50 %, (iv) ‘3’ = 50–75% , and (v) ‘4’ = >75%. Average percent cover is provided for all NIS observed annually per site. Presence-absence indicates that an NIS was observed on at least one collector plate. One additional rocky intertidal species (Asian shore crab; Hemigrapsus sanguineus) was assessed via beach surveys as permitted by time and resources following its initial siting in St Mary’s Bay (Nova Scotia) in April 2020. Rapid assessment surveys conducted in the Fall of 2020 and 2021 were employed to delineate H. sanguineus’ distribution and relative abundance. Areas deemed suitable and at high risk for spread were targeted, including exposed rocky intertidal habitat in southwest regions of Nova Scotia and New Brunswick. Each rapid assessment consisted of 30-minute beach surveys per site conducted by 2 or 3 people (modified from Stephenson et al. 2011). During each survey, crabs were collected under rocks and seaweed in preferred cobble/boulder habitat (Lohrer et al. 2000). Count data was standardized for each site as the number of crabs collected per 30-min search per person. Cite as: DFO-Maritimes Biofouling Monitoring Program. Published October 2018, Updated December 2023. Coastal Ecosystems Science Division, Fisheries and Oceans Canada, Dartmouth, NS Citations: Sephton D, B Vercaemer, JM Nicolas, J Keays (2011) Monitoring for invasive tunicates in Nova Scotia, Canada (2006-2009) Aquatic Invasions 6: 391-403. Sephton D, B Vercaemer, A Silva, L Stiles, M Harris, K Godin (2017) Biofouling monitoring for aquatic invasive species (AIS) in DFO Maritimes Regions (Atlantic shore of Nova Scotia and southwest New Brunswick): May-November, 2012-2015. Canadian Technical Report of Fisheries and Aquatic Sciences 3158: 72 pp. Stephenson EH, RS Steneck, RH Seeley (2009) Possible temperature limits to range expansion of non-native Asian shore crabs in Maine. Journal of Experimental Marine Biology and Ecology 375: 21–31. doi:10.1016/j.jembe.2009.04.020
-

This point feature layer contains both general and detailed information on waterbodies in Manitoba which are associated with the Lake Information for Anglers program. The point data contained within this layer represent the centroids of waterbodies in Manitoba. The layer describes a number of different attributes about a waterbody including, where available: average depth, aquatic invasive species information, regulatory links, presence of contours, waterbody specific PDF, fish assessment information, species information and coordinates. The waterbody data layer, along with related information, can be found at the Manitoba Lake Information For Anglers app. The project was initiated by Manitoba Wildlife and Fisheries Branch with funding from the Fish and Wildlife Enhancement Fund. Data is provided by Manitoba Wildlife and Fisheries Branch, Swan Valley Sport Fishing and Manitoba Watershed Districts. For additional information visit Manitoba Fisheries. The dataset includes the following fields (Alias (Name): Description) Waterbody ID (WATERBODY_ID): Unique identifier for an individual waterbody. Waterbody Name (WATERBODY_NAME): Name of the waterbody. Surface Area (km2) (SURFACE_AREA): Surface area of the waterbody in square kilometres. Average Depth (m) (AVERAGE_DEPTH_M): Average depth of a waterbody, if bathymetric data is available. Secchi (SECCHI): Indicates whether data exists for secchi depth in the waterbody (YES/NO). Secchi Depth (m) (SECCHI_DEPTH): Depth in meters of the visibility of a secchi disk. Fishing Division (FISHING_DIVISION): Indicates which fishing division the waterbody centroid is within. Fishing Division Special Area (SPECIAL_AREA): Indicates if the waterbody is within the special walleye areas (A or B). Please refer to the Angling Guide for details. UTM Zone (ZONE): Indicates which UTM zone the waterbody is in. Aquatic Invasive Species (AIS): Indicates the known or unknown presence of aquatic invasive species. Aquatic Invasive Species Control Zone (AIS_CONTROL_ZONE): Indicates which aquatic invasive species control zone a waterbody is within. High Quality Management (HIGH_QUALITY_MANAGEMENT): Indicates whether the waterbody falls under the high quality management angling regulations in Manitoba (TRUE/FALSE). HQM Description (HQM_DESCRIPTION): Indicates the high quality management provisions based on the fishing division the waterbody is in (only applies if the waterbody is a High Quality Management waterbody). Angling Regulations (SPECIAL_REGS): A note to see Manitoba Anglers’ Guide. Anglers' Guide (ANGLING_GUIDE): Contains a link (URL) to the Manitoba Anglers’ Guide. Waterbody Link (PRINTABLE_MAP): Contains a link to a PDF of waterbody contours and lake specific information for waterbodies that have bathymetric data. Boat Launch (BOAT_LAUNCH): Indicates whether the waterbody has a known boat launch (YES/NO). Launch Photo (LAUNCH_PHOTO): Indicates whether there is a launch photo for the waterbody (YES/NO). Boat Launch Photo (BOAT_LAUNCH_PHOTO): Contains a link (URL) that directs users to a photo of the launch. Stocked (STOCKED): Indicates whether the lake has been stocked with fish in the past (TRUE/FALSE). Species (SPECIES): A list of gamefish species that are known to have existed in the waterbody historically. Currently contains no info. Assessment (ASSESSMENT): Indicates whether an assessment PDF is available for the waterbody (YES/NO). Fisheries Assessment Link (FISHERIES_ASSESSMENT_LINK): Contains a link that directs users to a PDF document that contains information about species, fish age demographics, and master angler records. Contours (CONTOURS): Indicates whether contour data exists for the waterbody (YES/NO). Lat (DD) (LAT_DD): Latitudinal coordinates of the representative centroid of the waterbody in decimal degrees. Long (DD) (LONG_DD): Longitudinal coordinates of the representative centroid of the waterbody in decimal degrees.