 Arctic SDI catalogue
Environmental monitoring facilities
Type of resources
Categories
Available actions
Topics
Keywords
Contact for the resource
Provided by
Years
Formats
Representation types
Update frequencies
status
Service types
Scale
Resolution
-
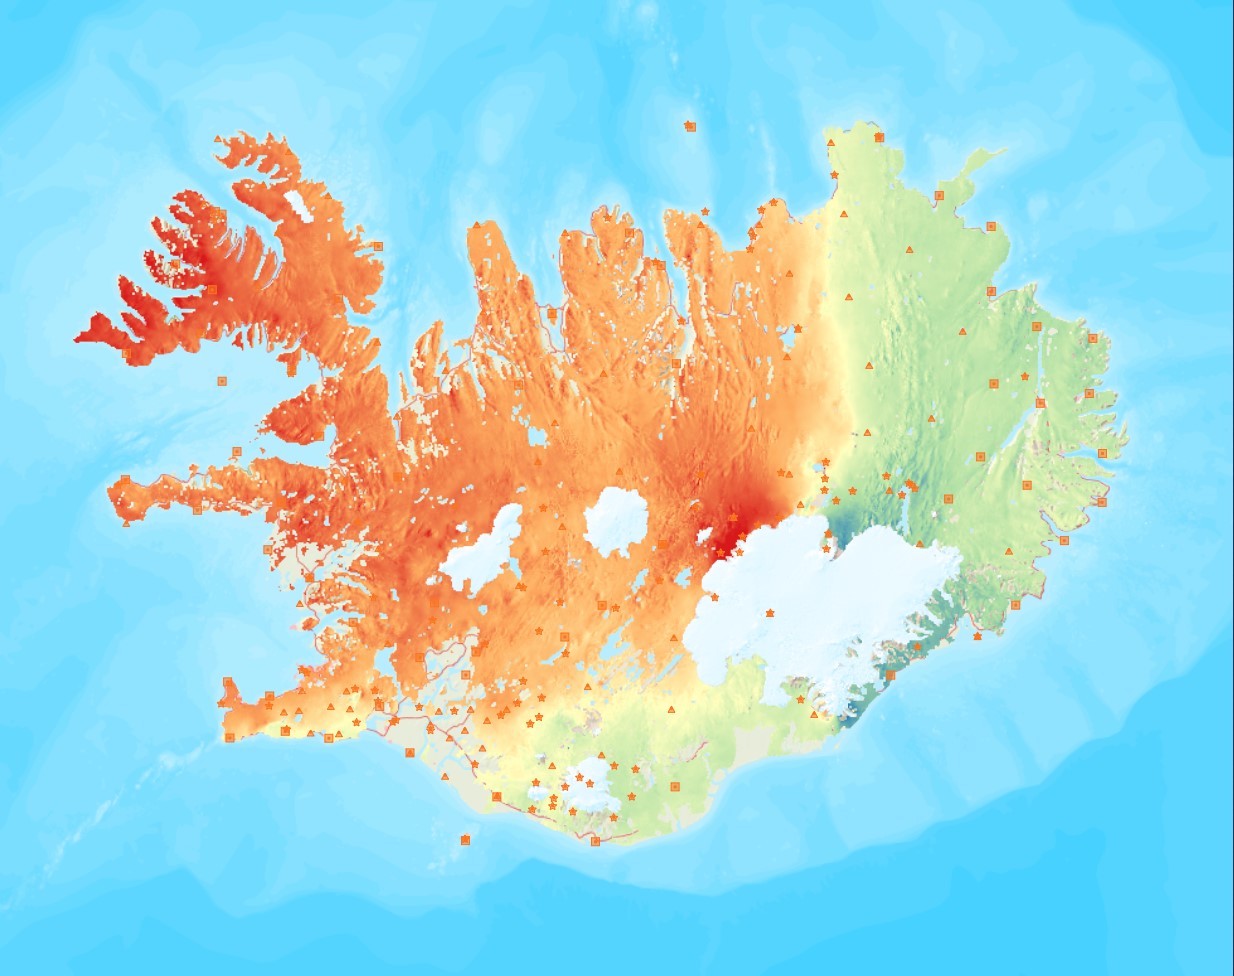
Average near-East crustal velocities between summer 2015 and summer 2018. These velocities indicate velocities in the East direction. However, they could be slightly influence by velocities along the North and Up directions and are therefore called near-East. Near-East velocities were derived by decomposing the line-of-sight velocities of six Sentinel-1 interferometric time-series covering Iceland. These time-series used a single master approach and Sentinel-1 images from the following summers (mid-June to end of September): 2015, 2016, 2017, and 2018. The near-East velocity grid has a 50 m resolution.
-
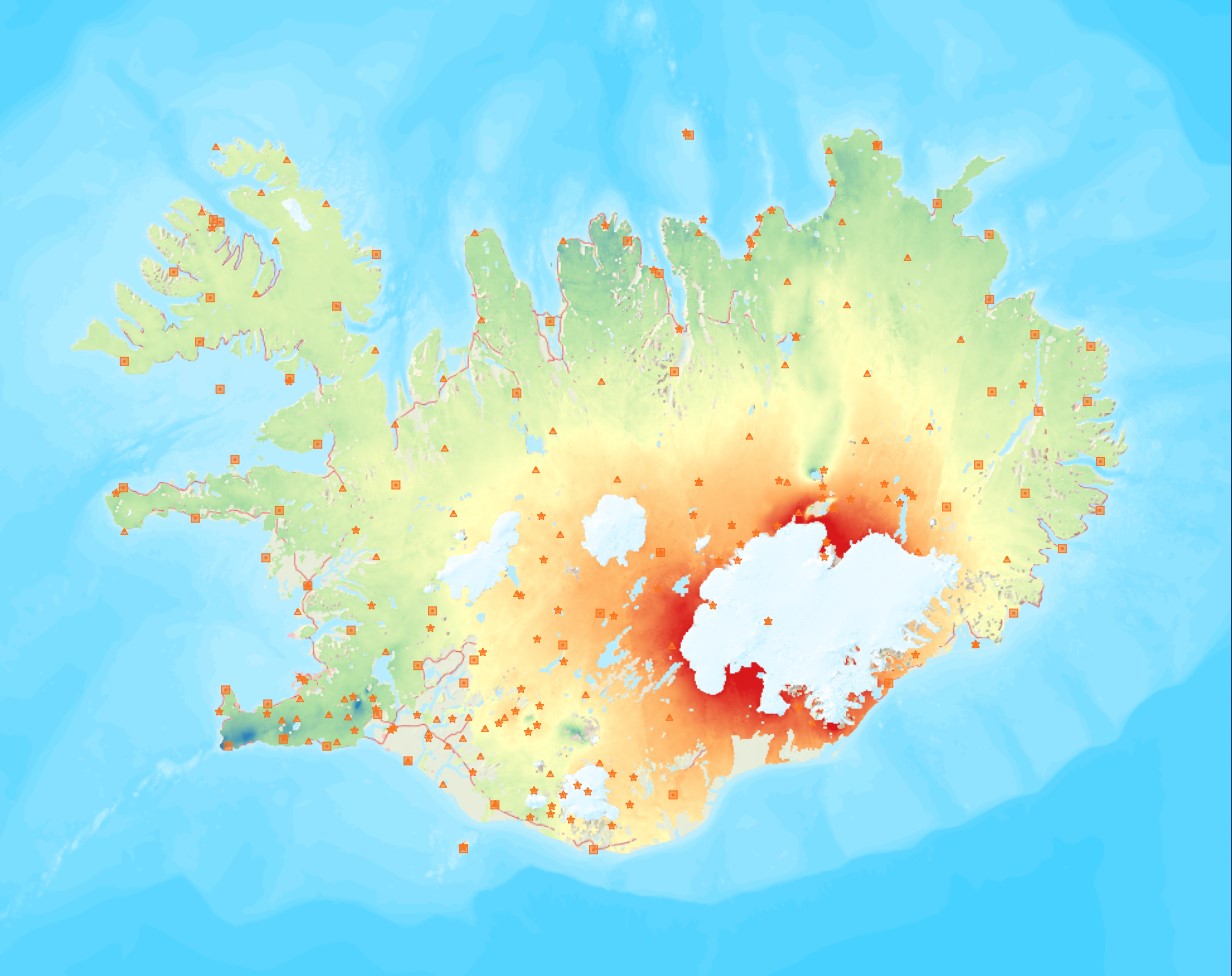
Average near-Up crustal velocities between summer 2015 and summer 2018. These velocities indicate velocities in the Up direction. However, they could be slightly influence by velocities along the East and North directions and are therefore called near-Up. Near-Up velocities were derived by decomposing the line-of-sight velocities of six Sentinel-1 interferometric time-series covering Iceland. These time-series used a single master approach and Sentinel-1 images from the following summers (mid-June to end of September): 2015, 2016, 2017, and 2018. The near-Up velocity grid has a 50 m resolution.
-

Niðurhalsþjónustur fyrir INSPIRE tilskipunina og grunngerð landupplýsinga. Vefþjónn fyrir landfræðileg gögn Umhverfisstofnunar. Vefþjónnin er byggður á opnum staðli OGC og hægt er að nálgast gögnin á vefþjóninum í gegnum ýmsar tegundir þjónusta, s.s. WFS, WMS.
-

Skoðunarþjónustur fyrir INSPIRE tilskipunina
-
Niðurhalsþjónustur í samræmi við INSPIRE tilskipunina og grunngerð landupplýsinga
-
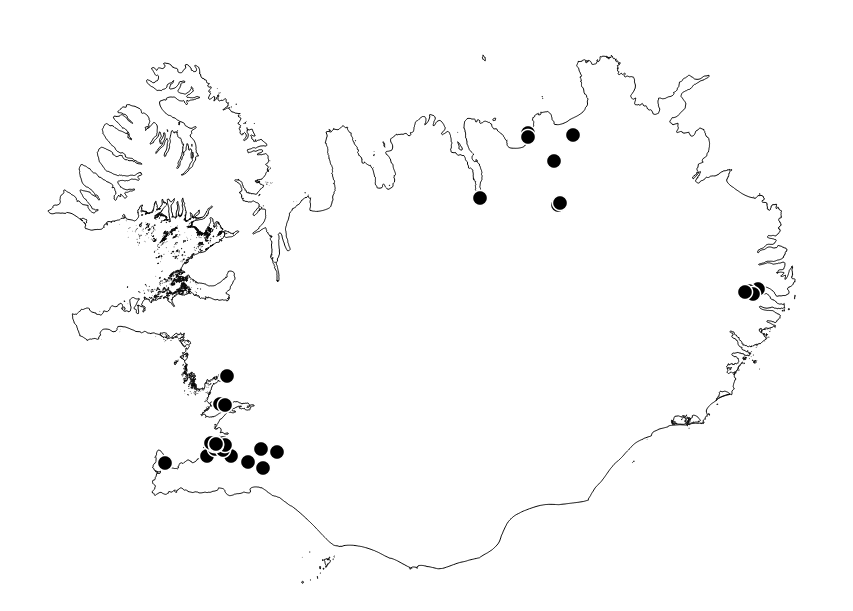
Staðsetningar loftmælistöðva á Íslandi. Umhverfisstofnun skilar árlega loftgæðaskýrslum til Evrópsku umhverfisstofnunarinnar (EEA) og uppfylla þau gögn INSPIRE-tilskipanir varðandi flokkun stöðva. Rekstraraðilar geta breytt gögnum stöðva.
-
Results from laboratory analyses of related to monitoring the quality of water wells and drinking water taps in household. This dataset is part of GEUS' nation-wide database for shallow boreholes, the common public database and is part of Denmarks Environmental Portal. The database is publicly available and is continually updated.
-
The National well database (Jupiter) among other things contains water level measurements from Danish wells. The database contains water level measurements from the municipalities, the groundwater-monitoring program, the regions soil pollution investigations and from the establishment of new wells.
-
Skoðunarþjónustur í samræmi við INSPIRE tilskipunina og lög um grunngerð fyrir stafrænar landupplýsingar
-

The Season Length (LENGTH), one of the Vegetation Phenology and Productivity (VPP) parameters, is a product of the pan-European High Resolution Vegetation Phenology and Productivity (HR-VPP) component of the Copernicus Land Monitoring Service (CLMS). The Season Length is the number of days between the start and end dates of the vegetation growing season in the time profile of the Plant Phenology Index (PPI). The Plant Phenology Index (PPI) is a physically based vegetation index, developed for improving the monitoring of the vegetation growth cycle. The PPI index values, with 5-day satellite revisit cycle, are first used in a function fitting to derive the PPI Seasonal Trajectories, which is a filtered time series with regular 10-day time step. From these Seasonal Trajectories, a suite of 13 Vegetation Phenology and Productivity (VPP) parameters are then computed and provided, for up to two seasons each year. The Season Length is one of the 13 parameters. The full list is available in the table 3 of the Product User Manual in the below link section. A complementary quality indicator (QFLAG) provides a confidence level, that is described in table 4 of the same manual. The LENGTH dataset is made available as raster files with 10 x 10m and 100 x 100m resolutions, in ETRS89-LAEA projection corresponding to the HRL grid, for those tiles that cover the EEA38 countries and the United Kingdom and for two seasons in each year from 2017 onwards. It is updated in the first quarter of each year.