 Arctic SDI catalogue
Satellite
Type of resources
Available actions
Topics
Keywords
Contact for the resource
Provided by
Years
Formats
Representation types
Update frequencies
status
Service types
Scale
-

The 2000 AAFC Land Use is a culmination and curated metaanalysis of several high-quality spatial datasets produced between 1990 and 2021 using a variety of methods by teams of researchers as techniques and capabilities have evolved. The information from the input datasets was consolidated and embedded within each 30m x 30m pixel to create consolidated pixel histories, resulting in thousands of unique combinations of evidence ready for careful consideration. Informed by many sources of high-quality evidence and visual observation of imagery in Google Earth, we apply an incremental strategy to develop a coherent best current understanding of what has happened in each pixel through the time series.
-

The 2005 AAFC Land Use is a culmination and curated metaanalysis of several high-quality spatial datasets produced between 1990 and 2021 using a variety of methods by teams of researchers as techniques and capabilities have evolved. The information from the input datasets was consolidated and embedded within each 30m x 30m pixel to create consolidated pixel histories, resulting in thousands of unique combinations of evidence ready for careful consideration. Informed by many sources of high-quality evidence and visual observation of imagery in Google Earth, we apply an incremental strategy to develop a coherent best current understanding of what has happened in each pixel through the time series.
-
The 2020 AAFC Land Use is a culmination and curated metaanalysis of several high-quality spatial datasets produced between 1990 and 2021 using a variety of methods by teams of researchers as techniques and capabilities have evolved. The information from the input datasets was consolidated and embedded within each 30m x 30m pixel to create consolidated pixel histories, resulting in thousands of unique combinations of evidence ready for careful consideration. Informed by many sources of high-quality evidence and visual observation of imagery in Google Earth, we apply an incremental strategy to develop a coherent best current understanding of what has happened in each pixel through the time series.
-

The AAFC Land Use Time Series is a culmination and curated meta-analysis of several high-quality spatial datasets produced between 2000 and 2021 using a variety of methods by teams of researchers as techniques and capabilities have evolved. The information from the input datasets was consolidated and embedded within each 30m x 30m pixel to create consolidated pixel histories, resulting in thousands of unique combinations of evidence ready for careful consideration. Informed by many sources of high-quality evidence and visual observation of imagery in Google Earth, we apply an incremental strategy to develop a coherent best current understanding of what has happened in each pixel through the time series.
-

The 2010 AAFC Land Use is a culmination and curated metaanalysis of several high-quality spatial datasets produced between 1990 and 2021 using a variety of methods by teams of researchers as techniques and capabilities have evolved. The information from the input datasets was consolidated and embedded within each 30m x 30m pixel to create consolidated pixel histories, resulting in thousands of unique combinations of evidence ready for careful consideration. Informed by many sources of high-quality evidence and visual observation of imagery in Google Earth, we apply an incremental strategy to develop a coherent best current understanding of what has happened in each pixel through the time series.
-

The 2015 AAFC Land Use is a culmination and curated metaanalysis of several high-quality spatial datasets produced between 1990 and 2021 using a variety of methods by teams of researchers as techniques and capabilities have evolved. The information from the input datasets was consolidated and embedded within each 30m x 30m pixel to create consolidated pixel histories, resulting in thousands of unique combinations of evidence ready for careful consideration. Informed by many sources of high-quality evidence and visual observation of imagery in Google Earth, we apply an incremental strategy to develop a coherent best current understanding of what has happened in each pixel through the time series.
-
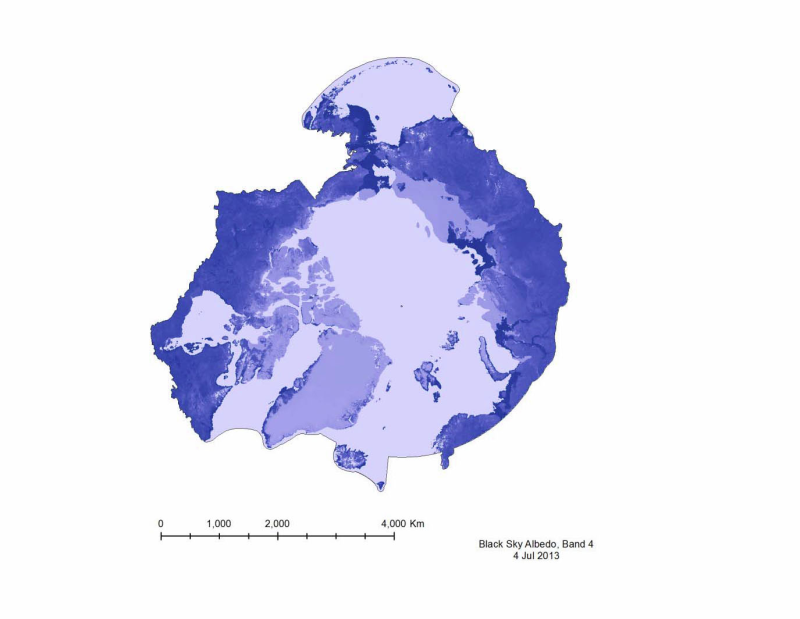
Albedo is a reflection coefficient that describes the reflecting power of a surface. Data compiled for CAFFs Land Cover Change Initiative with dataset for the firs of very month during 2001- 20112. - <a href="http://www.caff.is/indices-and-indicators/land-cover-change-index" target="_blank"> Land Cover Change Initiative (LCC)</a>
-

In 2012, the Earth Observation Team of the Science and Technology Branch (STB) at Agriculture and Agri-Food Canada (AAFC) repeated the process of generating annual crop inventory digital maps using satellite imagery to for all of Canada (except Newfoundland), in support of a national crop inventory. A Decision Tree (DT) based methodology was applied using optical (DMC, SPOT) and radar (RADARSAT-2) based satellite images, and having a final spatial resolution of 30m. In conjunction with satellite acquisitions, ground-truth information was provided by provincial crop insurance companies and point observations from our regional AAFC colleagues.
-
The Agriculture and Agri-Food Canada (AAFC) Annual Crop Inventory (ACI) is produced at a national scale, covering Canada’s entire agricultural extent. It has been generated operationally since 2011 for the entire country (2009 for the Prairie Provinces). This product is spatially continuous and maps the most probable crop type for every field in Canada, along with the land cover of non-agricultural lands (e.g. wetlands, forest, urban, etc.). It allows AAFC to study and model crop rotation patterns at the field level. To develop the Quantitative Crop Rotation Characteristics of Canada, historical ACI data representing the time series of crops at agricultural field level with annual intervals were applied. They provided the time series of categories of crops for statistical analyses. The results of this work included spatial data sets with several calculated attributes representing crop rotation statistical characteristics. Specifically, a crop sequence turbulence index was shown to be an efficient quantitative measure of mapping the spatial distribution of the sustainability of crop rotation in regions where dominantly annual crops were the active crop rotation. In addition, based on characteristics of observed crops in their time series sequence and the quantitative sequence dynamics represented by the turbulence index, major spatial clusters of crop rotation styles were calculated. To analyze the turbulence index, crop rotation cluster class representing the general style of crop rotation must also be considered. The crop rotation quantitative attributes calculated in this project which are at the field level, can be converted into useful information directing us towards the health and sustainability of crop rotations.
-

In 2022, the Earth Observation Team of the Science and Technology Branch (STB) at Agriculture and Agri-Food Canada (AAFC) repeated the process of generating annual crop inventory digital maps using satellite imagery for all Canadian provinces, in support of a national crop inventory. New this year, a map of the agricultural regions in the Yukon Territory was also produced. A Decision Tree (DT) based methodology was applied using optical (Landsat-8, Landsat-9, Sentinel-2), and radar (RCM) based satellite images, and having a final spatial resolution of 30m. In conjunction with satellite acquisitions, ground-truth information was provided by: provincial crop insurance companies in Alberta, Saskatchewan, Manitoba, & Quebec; point observations from the PEI Department of Environment, Water and Climate Change; Ontario Ministry of Agriculture, Food and Rural Affairs; University of Guelph - Ridgetown campus; British Columbia Ministry of Agriculture; and data collection supported by our regional AAFC Research and Development Centres in St. John's, Kentville, Fredericton, Guelph, Summerland and Whitehorse.