 Arctic SDI catalogue
History
Type of resources
Available actions
Topics
Keywords
Contact for the resource
Provided by
Years
Formats
Representation types
Update frequencies
status
Service types
-

This data layer comes from information recorded to the Operations Directorate of the Ministry of Public Security (MSP) during winter heat or spring flooding. The compilation was carried out using digital documents, papers, event reports or situation reports. The database also contains field observations made by municipal stakeholders grouped into river monitoring committees. These committees are set up and coordinated by the regional directorates of the MSP. Field observation is the collection of qualitative or quantitative data on the state of the river at a specific time. The level of the river can, when the situation applies, be measured using a limnimetric scale or evaluated using a geographic coordinate system as well as its trend (increasing, stable, or decreasing). General information characterizing the ice cover may also be recorded by the observer. The information in the database is consistent with the Canadian Common Alert Protocol Profile (PC-PAC). The PC-PAC is a set of rules and controlled values that support the translation and composition of a message to facilitate its sending by different means and from different sources. The PC-PAC formats used are as follows: SEVERITY LEVEL The severity level of the event based on the harm to life of persons or damage to property. The severity of observations on past events can therefore be estimated from the consequences recorded at the time of the events. For field observations by river committees, the degree of severity is generally estimated directly by the observer. The definitions are as follows: Extreme: Extraordinary threat to life or property. Significant: a significant threat to life or property. Moderate: possible threat to life or property. Minor: low threat to life or property. Normal: there is no threat to life or property. Unknown: severity unknown. EMERGENCY The emergency level is determined based on the reactive measures that need to be taken in response to the current situation. The definitions are as follows: Immediate: reactive action must be taken immediately. Expected: Reactive action should be taken soon (within the next hour). Future: reactive action needs to be taken in the near future. Past: reactive action is no longer necessary. Unknown: emergency unknown. STATE The state refers to the context of the observation, real or simulated. Current: information about a real event or situation. Purpose: To obtain an overall picture of the situation concerning ice jam flooding problems in order to estimate the risk of flooding along river sections subject to this problem. Geographically locate the ice jams listed on Quebec waterways. Characterize each case listed according to the severity level as defined in the PC-CAP common alert protocol.**This third party metadata element was translated using an automated translation tool (Amazon Translate).**
-
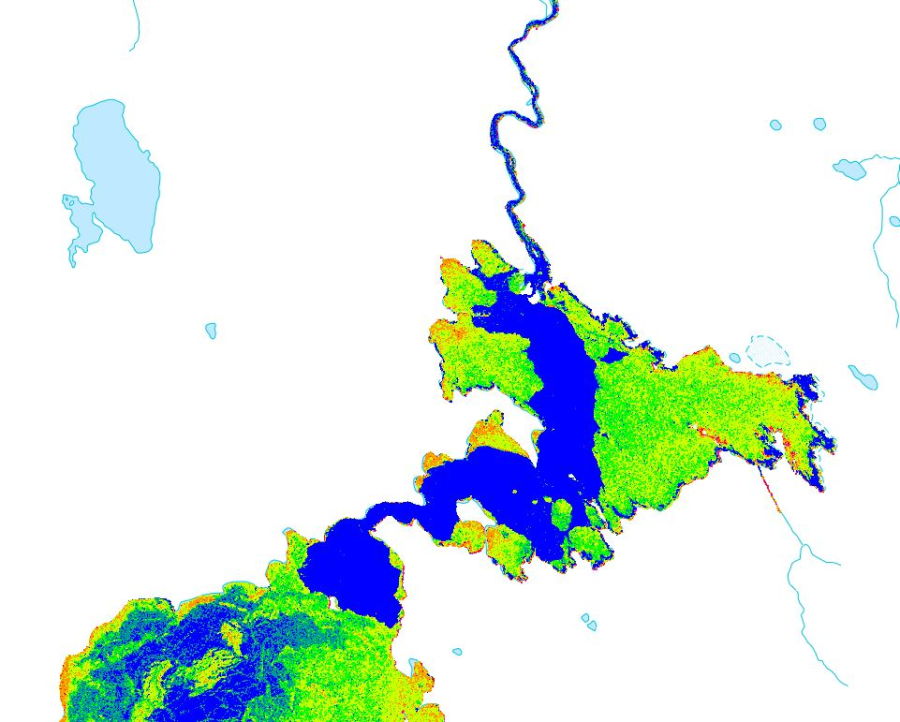
Collection of monitoring products of river ice roughness from current and past winter seasons throughout Canada as monitored by Natural Resources Canada using satellite imagery. This collection of cartographic products regroups river ice state monitoring products and their associated footprints. Three visualization timeframes are available: - **[Active Monitoring of River Ice in Canada](https://open.canada.ca/data/en/dataset/7b210c58-2fc7-47c5-8b8a-2605c77d725c)** - **[River Ice in Canada - Current](https://open.canada.ca/data/en/dataset/8ca6f047-ddef-43d7-81c2-47654f4c69bd)** - **[River Ice in Canada - Archive](https://open.canada.ca/data/en/dataset/5e6b40bf-299f-4e05-87c8-d10b9c8210f9)**
-

The geobase is the spatial representation of the road network in the form of a filamentary network composed of lines called sections. The update operations are recorded in a log with the identifiers of the sections, the dates and types of the operations, and the version numbers. The geometry of the edges affected by the update operations is not recorded in the log and as a result **_this data set does not contain geospatial information_**. Only operations performed after **_25 October 2017_**, starting with version **_618_**, are included in the __Géobase - section management__ data set. Related data sets: - [Geobase - road network] (http://donnees.montreal.ca/dataset/geobase) - [Geobase double - street sides of the road network] (http://donnees.montreal.ca/dataset/geobase-double) - [Geobase - poles] (http://donnees.montreal.ca/dataset/geobase-pole) - [Geobase - destroyed sections] (http://donnees.montreal.ca/dataset/geobase-troncon-detruit) - [Geobase - nodes] (http://donnees.montreal.ca/dataset/geobase-noeud) __Warnings__ - The data disseminated (Géobase - section management) must be used in accordance with the City of Montreal's open data policy and license. - The data disseminated (Géobase - section management) are those that are in our possession and are not necessarily up to date throughout the country. - The data disseminated (Géobase - section management) is provided for information purposes only and should not be used for the purposes of designing or carrying out the work, nor for the purpose of locating assets. - The City of Montreal and the Geomatics Division cannot be held responsible for the inaccuracies or inaccuracies of the data disseminated (Géobase - section management).**This third party metadata element was translated using an automated translation tool (Amazon Translate).**
-

River ice roughness products from past years in selected Canadian regions that have been designated for observation, monitored by Natural Resources Canada using satellite imagery for emergency response. Coverage is not comprehensive nationwide. In order to mitigate ice jam induced floods risks, Natural Resources Canada emergency geomatics service (EGS) may be activated by Canada’s emergency management authorities. As new satellite imagery becomes available, NRCan will produce river ice roughness maps and update the dataset in near real time (4 hours). This item contains the complete record of the river ice roughness products generated in past years. For any data to the current year, please refer to the [River Ice in Canada - Seasonal](https://open.canada.ca/data/en/dataset/8ca6f047-ddef-43d7-81c2-47654f4c69bd) entry. The river ice product is generated and validated on a best effort basis. Various factors may affect the quality of the river ice roughness maps. Those factors include but are not limited to: sensor type, image resolution or the limitations of the methodology used. To view a specific product in Web Services, filter the data by date (UTC Date) and area of interest (AOI). A link to download specific EGS products is available in the Resources section. Disclaimer: Emergency response authorities are the primary users of these satellite-derived river ice roughness map products. These products are generated to provide analysis and emergency response situational awareness and to facilitate decision-making during major flood events. The river ice roughness products are generated rapidly and limited time is available for editing and validation. The river ice roughness products reflect the river ice surface roughness conditions at the date/time of acquisition. While efforts are made to produce high quality products, near-real time products may contain errors due to the limited time available for validation and the limited availability of ground truthing data. Limitation of Liability: Accordingly, the information contained on this website is provided on an “as is” basis and Natural Resources Canada makes no representations or warranties respecting the information, either expressed or implied, arising by law or otherwise, including but not limited to, effectiveness, completeness, accuracy or fitness for a particular purpose. Natural Resources Canada does not assume any liability in respect of any damage or loss based on the use of this website. In no event shall Natural Resources Canada be liable in any way for any direct, indirect, special, incidental, consequential, or other damages based on any use of this website or any other website to which this site is linked, including, without limitation, any lost profits or revenue or business interruption. Parent Collection: - **[River Ice State in Canada - Cartographic Product Collection](https://open.canada.ca/data/en/dataset/d1fcb44f-5f86-4957-bdb4-e6fd1aa69283)**
-
The geobase is the spatial representation of the road network in the form of a filamentary network composed of lines called sections. A section represents a portion of road with homogeneous characteristics, including attributes such as official place names, address ranges, functional hierarchy classes, traffic directions, and other information. During the upgrade operations, some sections are destroyed, as the roads they represented were closed. Also, when sections need to be segmented or merged, the old sections are destroyed and new sections are created. This data set includes the destroyed sections that were part of the [Geobase - road network] data set (http://donnees.montreal.ca/dataset/geobase). Only sections destroyed after ** _October 25, 2017_ ** are included in this __Geobase - destroyed tracks__ data set. Related data sets: - [Geobase - road network] (http://donnees.montreal.ca/dataset/geobase) - [Geobase double - street sides of the road network] (http://donnees.montreal.ca/dataset/geobase-double) - [Geobase - poles] (http://donnees.montreal.ca/dataset/geobase-pole) - [Geobase - section management] (http://donnees.montreal.ca/dataset/geobase-gestion-troncon) - [Geobase - nodes] (http://donnees.montreal.ca/dataset/geobase-noeud) __Warnings__ - The data released (Geobase - destroyed sections) must be used in accordance with the City of Montreal's open data policy and license. - The data disseminated (Géobase - destroyed sections) are those that are in our possession and are not necessarily up to date throughout the country. - The data disseminated (Géobase - destroyed sections) is provided for information purposes only and should not be used for the purposes of designing or carrying out the works, nor for the purpose of locating assets. - The City of Montreal and the Geomatics Division cannot be held responsible for the inaccuracies or inaccuracies of the data disseminated (Geobase - destroyed sections). **This third party metadata element was translated using an automated translation tool (Amazon Translate).**
-

Inventory carried out in order to increase knowledge about built heritage. Starting with the 2015 pre-inventory, 608 heritage properties were selected. The selection of these properties was carried out in order to target properties with exceptional (7), superior (183) and good (418) heritage values. To these were added some of the properties that were already protected by a PIIA regulation and the properties built before 1900, as well as all the wayside crosses and calvaries, representing 181 additional properties, for a total of 789 heritage assets that are the subject of the inventory.**This third party metadata element was translated using an automated translation tool (Amazon Translate).**
-
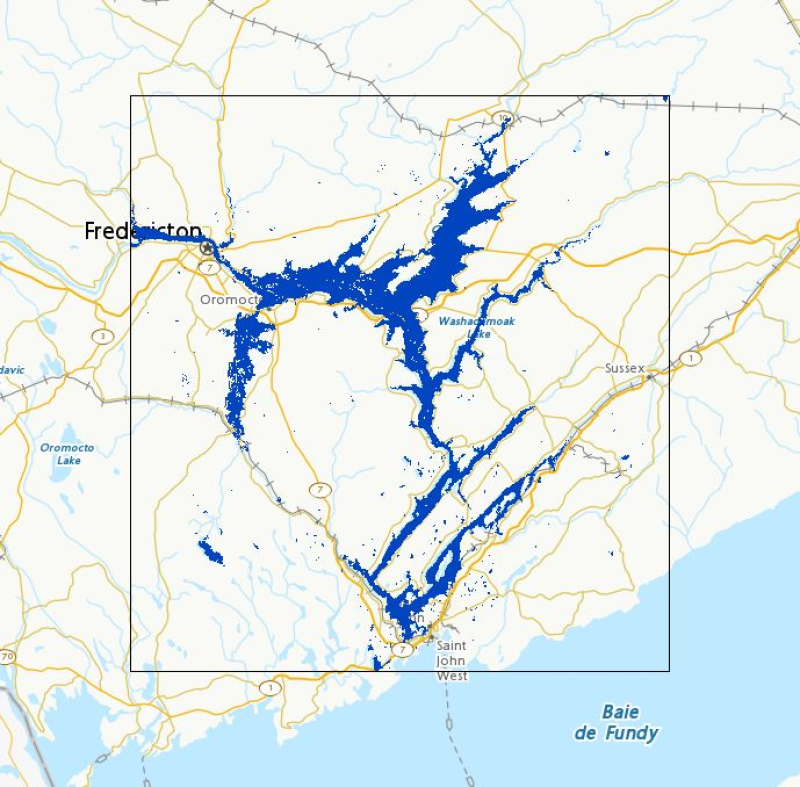
Collection of flood products for active and past floods throughout Canada as monitored by Natural Resources Canada using satellite imagery for emergency response. This collection of cartographic products regroups flood extent polygons and their associated footprints. Three visualization timeframes are available : - **[Active Floods in Canada](https://open.canada.ca/data/en/dataset/9cad712a-5ac5-4248-b7d7-2db1a3892509)** - **[Floods in Canada - Current Year](https://open.canada.ca/data/en/dataset/b1afd8d2-6e14-4ec4-9a09-652221a6cb71)** - **[Floods in Canada - Archive](https://open.canada.ca/data/en/dataset/74144824-206e-4cea-9fb9-72925a128189)**
-
This time-enabled map shows the expansion of Canadian Railways, higlighting the rapid expansion of the CPR in the late nineteenth century.
-

Flood extent polygons from past years in selected Canadian regions that have been designated for observation, monitored by Natural Resources Canada using satellite imagery for emergency response. Coverage is not comprehensive nationwide. In response to large flood events, Natural Resources Canada (NRCan), for the provision of emergency geomatics services, may be activated by Canada’s emergency management protocols. As new satellite imagery becomes available, NRCan will extract flood extent polygons and update the dataset in near real time (4 hours). This item contains the complete archive of all flood products generated since 2005, by NRCan's emergency geomatics services. For any data to the current year, please refer to the catalogue entry entitled: [Floods in Canada – Current]( https://open.canada.ca/data/en/dataset/b1afd8d2-6e14-4ec4-9a09-652221a6cb71). The flood products generated are validated on a best effort basis. Various factors may affect the quality of the flood polygons. These factors include, but are not limited to, sensor type, image resolution, cloud cover or limitations of the flood polygon extraction method. In this layer, where possible, a symbology is applied to the flood polygons based on the underlying land use classification, or is simply unclassified and shows the raw flood extent. When using Web mapping services, to display a specific product, filter by date (UTC Date) and area of interest (AOI). Also, a link to download each product directly from the FTP site is available in the Resources section. This prepackaged and compressed product contains a Shape file, a PDF file and a KMZ file. For more information on past flooding events, please refer to the catalog entry entitled: [Historical Flood Events (HFE)](https://geo.ca/flood-mapping/flood-map-gallery/historical-flood-events/) Disclaimer: Emergency response authorities are the primary users of these satellite-derived open water flood extent map products. These products are generated to provide analysis and emergency response situational awareness and to facilitate decision-making during major flood events. The open water flood extent products are generated rapidly and limited time is available for editing and validation. The flood products reflect the open water flood conditions at the date/time of acquisition. While efforts are made to produce high quality products, near-real time products may contain errors due to the limited time available for vector editing and validation. Please note that current algorithms do not map flooded areas under the forest canopy and are not optimized for urban flood mapping. Limitation of Liability: Accordingly, the information contained on this website is provided on an “as is” basis and Natural Resources Canada makes no representations or warranties respecting the information, either expressed or implied, arising by law or otherwise, including but not limited to, effectiveness, completeness, accuracy or fitness for a particular purpose. Natural Resources Canada does not assume any liability in respect of any damage or loss based on the use of this website. In no event shall Natural Resources Canada be liable in any way for any direct, indirect, special, incidental, consequential, or other damages based on any use of this website or any other website to which this site is linked, including, without limitation, any lost profits or revenue or business interruption. Parent Collection: - **[Floods in Canada - Cartographic Product Collection](https://open.canada.ca/data/en/dataset/08b810c2-7c81-40f1-adb1-c32c8a2c9f50)**
-
Following the spring floods at the end of April 2017 on Lake of Two Mountains, Lake Saint-Pierre and the Rivières des Prairies and Mille-Îles that affected the regions of Montérégie, Laurentides, Mauricie, Montréal and Laval, geomatic data (e.g. satellite images) were captured to document these floods, which exceeded the recurrence of 100 years. At the peak of the flood, on May 8, Lac des Deux Montagnes reached a level of 24.78m at station 043108 of the Ministry of Sustainable Development, Environment and the Fight against Climate Change (MDDELCC), the Rivière des Prairies reached a flow of 3400 m3/s at station 0433/s at station 043301 of the MDDELCC and the Rivière des Mille-Îles reached 1081 m3/s at station 02OA0S 13 from Environment and Climate Change Canada (ECCC). on the Ottawa River, the flow at Carillon reached a peak of 8900 m3/s**This third party metadata element was translated using an automated translation tool (Amazon Translate).**