 Arctic SDI catalogue
Planning
Type of resources
Available actions
Topics
Keywords
Contact for the resource
Provided by
Formats
Representation types
Update frequencies
status
-

The Social Vulnerability component of the National Human Settlement Layer (NHSL) includes information about broad spatial patterns of social vulnerability at the neighbourhood scale, and indicators about the capacities for a community to withstand and recover from disaster events based on intrinsic characteristics of housing, family structure, individual autonomy and financial agency. Information in the model provides a means of comparing relative levels of social vulnerability from one region to another across Canada and helps to identify specific dimensions within a community that contributes to their relative levels of social vulnerability. This information is not intended for site-specific study, but instead to understand broad patterns of social characteristics and vulnerability across multiple census dissemination areas.
-

The Physical Exposure component of the National Human Settlement Layer (NHSL), defined here as the ‘Physical Exposure Model’, includes a delineation of settled areas and related land use across Canada, as well as information about buildings, persons, and building replacement values (structure and contents) within those areas. Buildings within the inventory are classified using a combination of occupancy types, engineering-based construction types adopted for Canada, and design levels representing the approximate building code requirements at the time of construction. The inventory is derived from detailed housing statistics provided at the dissemination area level as part of the 2016 national census and from georeferenced business listings. Building populations at different times of day are estimated for standard daytime hours (9am-5pm); for morning and evening commute hours (7am-9am; 5pm-7pm), and; for nighttime hours when the majority of people are home (7pm-7am). Replacement values are provided for structural, nonstructural, and contents components of buildings, based on industry replacement costs for representative regions across Canada. The physical exposure model is provided in two formats: (1) According to settled areas (i.e., polygons), which are areas that approximately delineate clusters of buildings across Canada. Summary statistics about buildings and populations within each settled area boundary are provided. (2) According to building archetypes (i.e., points) within settled areas. These are represented as point locations at the centroid of the corresponding settled area, and each settled area can have multiple point features corresponding to different building archetypes present within that area. In total, the model characterizes 35.2 million people in 9.7 million buildings across 390,000 locations with a total approximate replacement value of $8.2 trillion (2019 CAD) including contents.
-

Three marine spatial planning areas are delineated in Eastern Canada to define the spatial extents of marine spatial plans being led by Fisheries and Oceans Canada (DFO): the Estuary and Gulf of St. Lawrence (EGSL), the Newfoundland and Labrador (NL) Shelves, and the Scotian Shelf and Bay of Fundy. The EGSL planning area includes the St. Lawrence River estuary from northeast of Île d’Orléans, Quebec, the Saguenay River estuary, and the entire Gulf of St. Lawrence as far north as the Strait of Belle Isle (NAFO Divisions 4RST). The NL Shelves planning area includes areas off southern, eastern and northern Newfoundland, part of the Churchill River and Lake Melville, as well as off the Labrador coast to the extent of the exclusive economic zone (EEZ) (NAFO Divisions 2GHJ and 3KLNOP). The Scotian Shelf and Bay of Fundy planning area includes DFO Maritimes’ administrative region off the Atlantic coast of Nova Scotia to the extent of the EEZ, the Bay of Fundy and the Canadian portion of the Gulf of Maine (NAFO Divisions 4VWX, 5Ze, and the Canadian portion of 5Y). The French EEZ for St. Pierre et Miquelon is excluded from the three planning areas. These planning areas are derived from Federal Marine Bioregions (https://open.canada.ca/data/en/dataset/23eb8b56-dac8-4efc-be7c-b8fa11ba62e9) that were developed by a Canadian Science Advisory Secretariat process using ecosystem-based management principles to define 13 ecological bioregions that have informed but not directed DFO implementation of marine spatial planning.
-
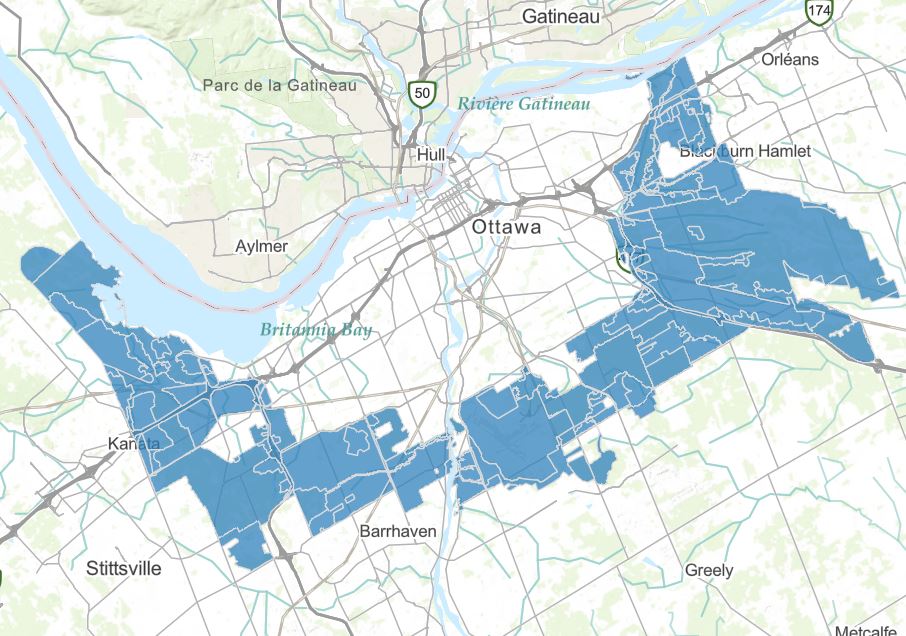
In the Greenbelt Master Plan (2013), the proposed land designations are a “classification” which assigns desired landscape character and uses to defined land areas across the Greenbelt. Areas are classified according to their desired role, whether to protect biodiversity, maintain agricultural resources, or accommodate permanent facilities. https://ncc-ccn.gc.ca/our-plans/greenbelt-master-plan https://ncc-website-2.s3.amazonaws.com/documents/final-2013-greenbelt-master-plan-en.pdf#page=69
-
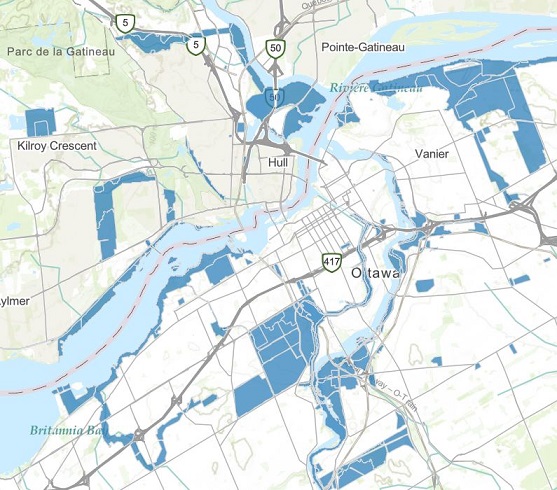
In the Capital Urban Lands Plan (2015), Land designations identify the desired uses for federal urban lands in relation to the role they play for the Capital in a given location. Each land designation provides policy direction for an ensemble of sites that serve similar functions. https://ncc-ccn.gc.ca/our-plans/capital-urban-lands-plan https://ncc-website-2.s3.amazonaws.com/documents/Capital-Urban-Lands-plan.pdf#page=45
-
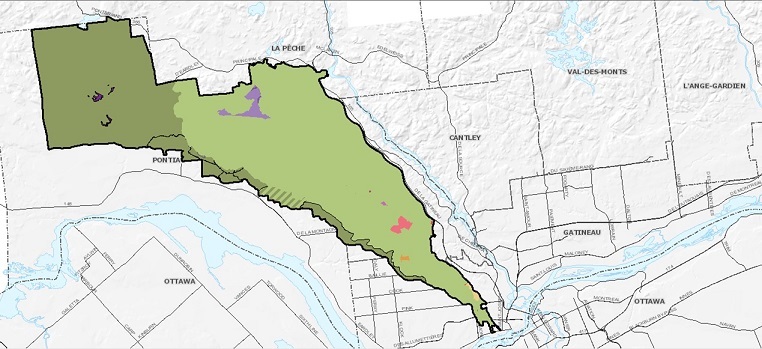
Described in the Gatineau Park Master plan (2021), the land use designations are the authorized activities or uses in a given area. They support the implementation of the park’s vision and goals. They also ensure that interventions and activities are spatially and functionally consistent. https://ncc-ccn.gc.ca/our-plans/gatineau-park-master-plan https://ncc-website-2.s3.amazonaws.com/documents/GPMP_ENG_2021_02_26_Single_Page.pdf#page=65
-
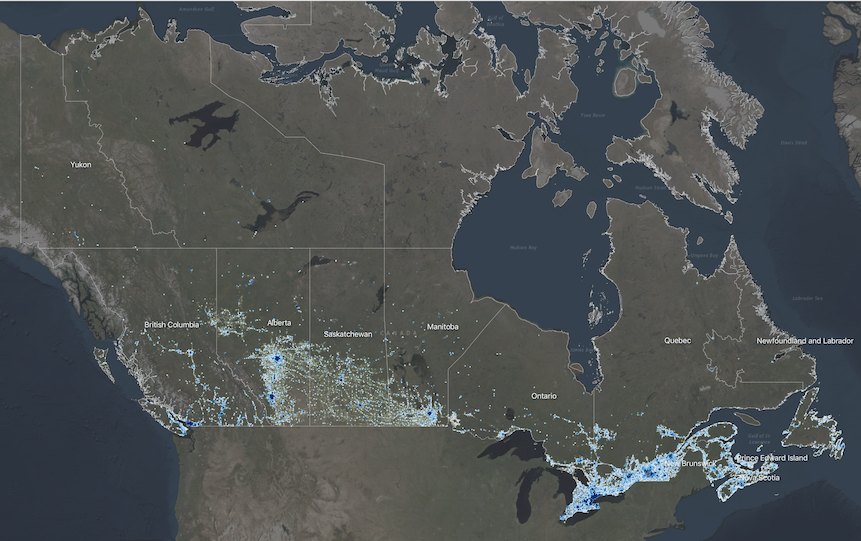
The National Human Settlement Layer (NHSL) is a collection of thematic datasets that describe the physical, social and economic characteristics of urban centres and rural/remote communities across Canada, and their vulnerability to natural hazards of concern. Detailed information on land use, buildings, people and capital assets are provided at the Census Dissemination Area administrative level for more than 454,000 settled areas across Canada. The Physical Exposure Layer includes a delineation of human settlement areas and related functional land use classes across Canada, and provides detailed information on construction type, occupancy and design level of more than 9.1 million buildings; population dynamics at different times of day for 35.1 million people, and; capital asset valuation of buildings and contents totaling more than 8.3 trillion CAD$. The Social Fabric Layer utilizes Census demographic data to evaluate broad spatial patterns of vulnerability, and neighbourhood-level capacities to withstand and recover from disaster events based on intrinsic characteristics of housing, family structure, individual autonomy and financial agency. Although developed to support quantitative risk assessments and implementation of the Sendai Framework for Disaster Risk Reduction at local and regional scales in Canada, the NHSL is also suitable for use in other integrated landscape modeling applications, including climate change adaptation and sustainable land use planning.
-

These datasets show commercial fisheries catch weight landings of directed fisheries and bycatch from the Scotian Shelf, the Bay of Fundy, and Georges Bank from NAFO Divisions 4VWX and the Canadian portions of 5Y and 5Z. Five-year composite maps (2019–2023) that aggregate catches for each map series are publicly available. The maps aggregate catch weight (kg) per 10 km2 hexagon grid cell for selected species, species groupings and gear types to identify important fishing areas. These maps can support decision making in coastal and oceans management, including marine spatial planning, environmental emergency response operations and protocols, Marine Stewardship Council certification processes, marine protected area networks, and ecological risk assessment. Reported catch locations may have rounded coordinates or contain errors. Although some errors have been corrected, it is assumed that additional errors remain in the data. These datasets have been filtered to comply with the Government of Canada's privacy policy. Privacy assessments were conducted to identify DFO unit areas containing data with less than five vessel IDs, licence IDs or fisher IDs. If this threshold was not met, catch weight locations were withheld from these unit areas to protect the identity or activity of individual vessels or companies. Maps were created for the following species, species groupings and gear types: 1. Groundfish (all species) 2. Groundfish Bottom Trawl 3. Groundfish Bottom Longline 4. Groundfish Gillnet 5. Groundfish (seasonal composites) 6. Atlantic Cod 7. Atlantic Cod, Haddock and Pollock 8. Flatfish 9. Atlantic Halibut 10. Greenland Halibut (Turbot) 11. Hagfish 12. Cusk 13. Dogfish 14. Redfish 15. Red Hake 16. Silver Hake 17. White Hake 18. Monkfish 19. Sculpin 20. Skate 21. Wolffish 22. Squid 23. Herring 24. Mackerel 25. Herring and Mackerel Gillnet 26. Purse Seine 27. Large Pelagics 28. Bluefin Tuna 29. Other Tuna 30. Swordfish 31. Snow Crab 32. Other Crab 33. Scallop 34. Scallop (seasonal composites) 35. Offshore Clam 36. Shrimp Trawl 37. Shrimp Trap 38. Offshore Lobster 39. Disputed Zone Area 38B Lobster 40. Whelk
-

The purpose of this layer is to provide end users with a spatial representation of the Designated Areas in adopted Development Plans and their consolidated amendments in Manitoba. It also allows users of the data to undertake a variety of land use planning analyses based on Development Plan Designations. This layer is intended to be a source of data delivery as well as usage in situ. This dataset is comprised of boundary geometry representing the Development Plan Designations for all of the Development Plan bylaws (as defined in The Planning Act) in force and effect within the Province of Manitoba. Spatial referencing of the designations is based on the best available land parcel data for each municipality. Where available, land parcel data based on registered survey plans and ground control coordinates was used. Otherwise, the reference grid maintained by Manitoba Sustainable Development was used. The delineation of the boundaries is set by the bylaw establishing or amending the boundary of each designation. Dataset content is subject to: Ongoing changes in designated areas which are determined by amendments to adopted Development Plans or the adoption of new Development Plans. Ongoing development and maintenance of the land parcel datasets. Improvements to the land parcel data are used to improve the positional accuracy of the Development Plan designation polygons. As of the publication date of this dataset, the following known issues remain: For designation boundaries that include water boundaries, the water boundary that best reflects the intended designation boundary was used. In some instances, road allowances on a municipal boundary are included in both of the adjoining municipalities. Please visit the Manitoba Municipal Relations website for more information at www.gov.mb.ca/mr. The Development Plan Designations data reflects the most current designations at the time of export and was uploaded to Manitoba Maps as a feature layer. Fields Included: OBJECTID: Sequential unique whole numbers that are automatically generated DP_BYLAW: Number assigned by planning authority to identify a specific bylaw DPA_BYLAW: Number assigned to a bylaw that amends an existing development plan bylaw PLANNINGDISTRICT: Name of the Planning District establishing the bylaws PLANNINGREGION: Area of responsibility for a Community and Regional Planning Branch (In the Department of Municipal Relations) office ACRES: Area of each polygon expressed in acres DES_NAME: Name of Designation as stated in the Development Plan bylaw DES_CATEGORY: Designation category as interpreted by Municipal Relations RES_MIN_ACRES_PER_LOT: Minimum acreage for a residential lot as defined by the Development Plan bylaw RES_MAX_ACRES_PER_LOT: Maximum acreage for a residential lot as defined by the Development Plan bylaw MUNI_NO: Manitoba municipality identifier number MUNI_NAME: Name of municipality AU_LIMIT: Animal Unit limit as set by the Development Plan Policy
-
To identify the overall reach and configuration of the Capital Pathway, show the location of existing pathways (as of 2020) and proposed pathway segments, and distinguish between discovery routes and feeder links. Capital Pathway Strategic Plan, October 2020 https://ncc-website-2.s3.amazonaws.com/documents/Pathways-BOOK-10-15-2020-EN_Final_Compressed.pdf