 Arctic SDI catalogue
QGIS
Type of resources
Available actions
Topics
Keywords
Contact for the resource
Provided by
Formats
Representation types
Update frequencies
status
Scale
-
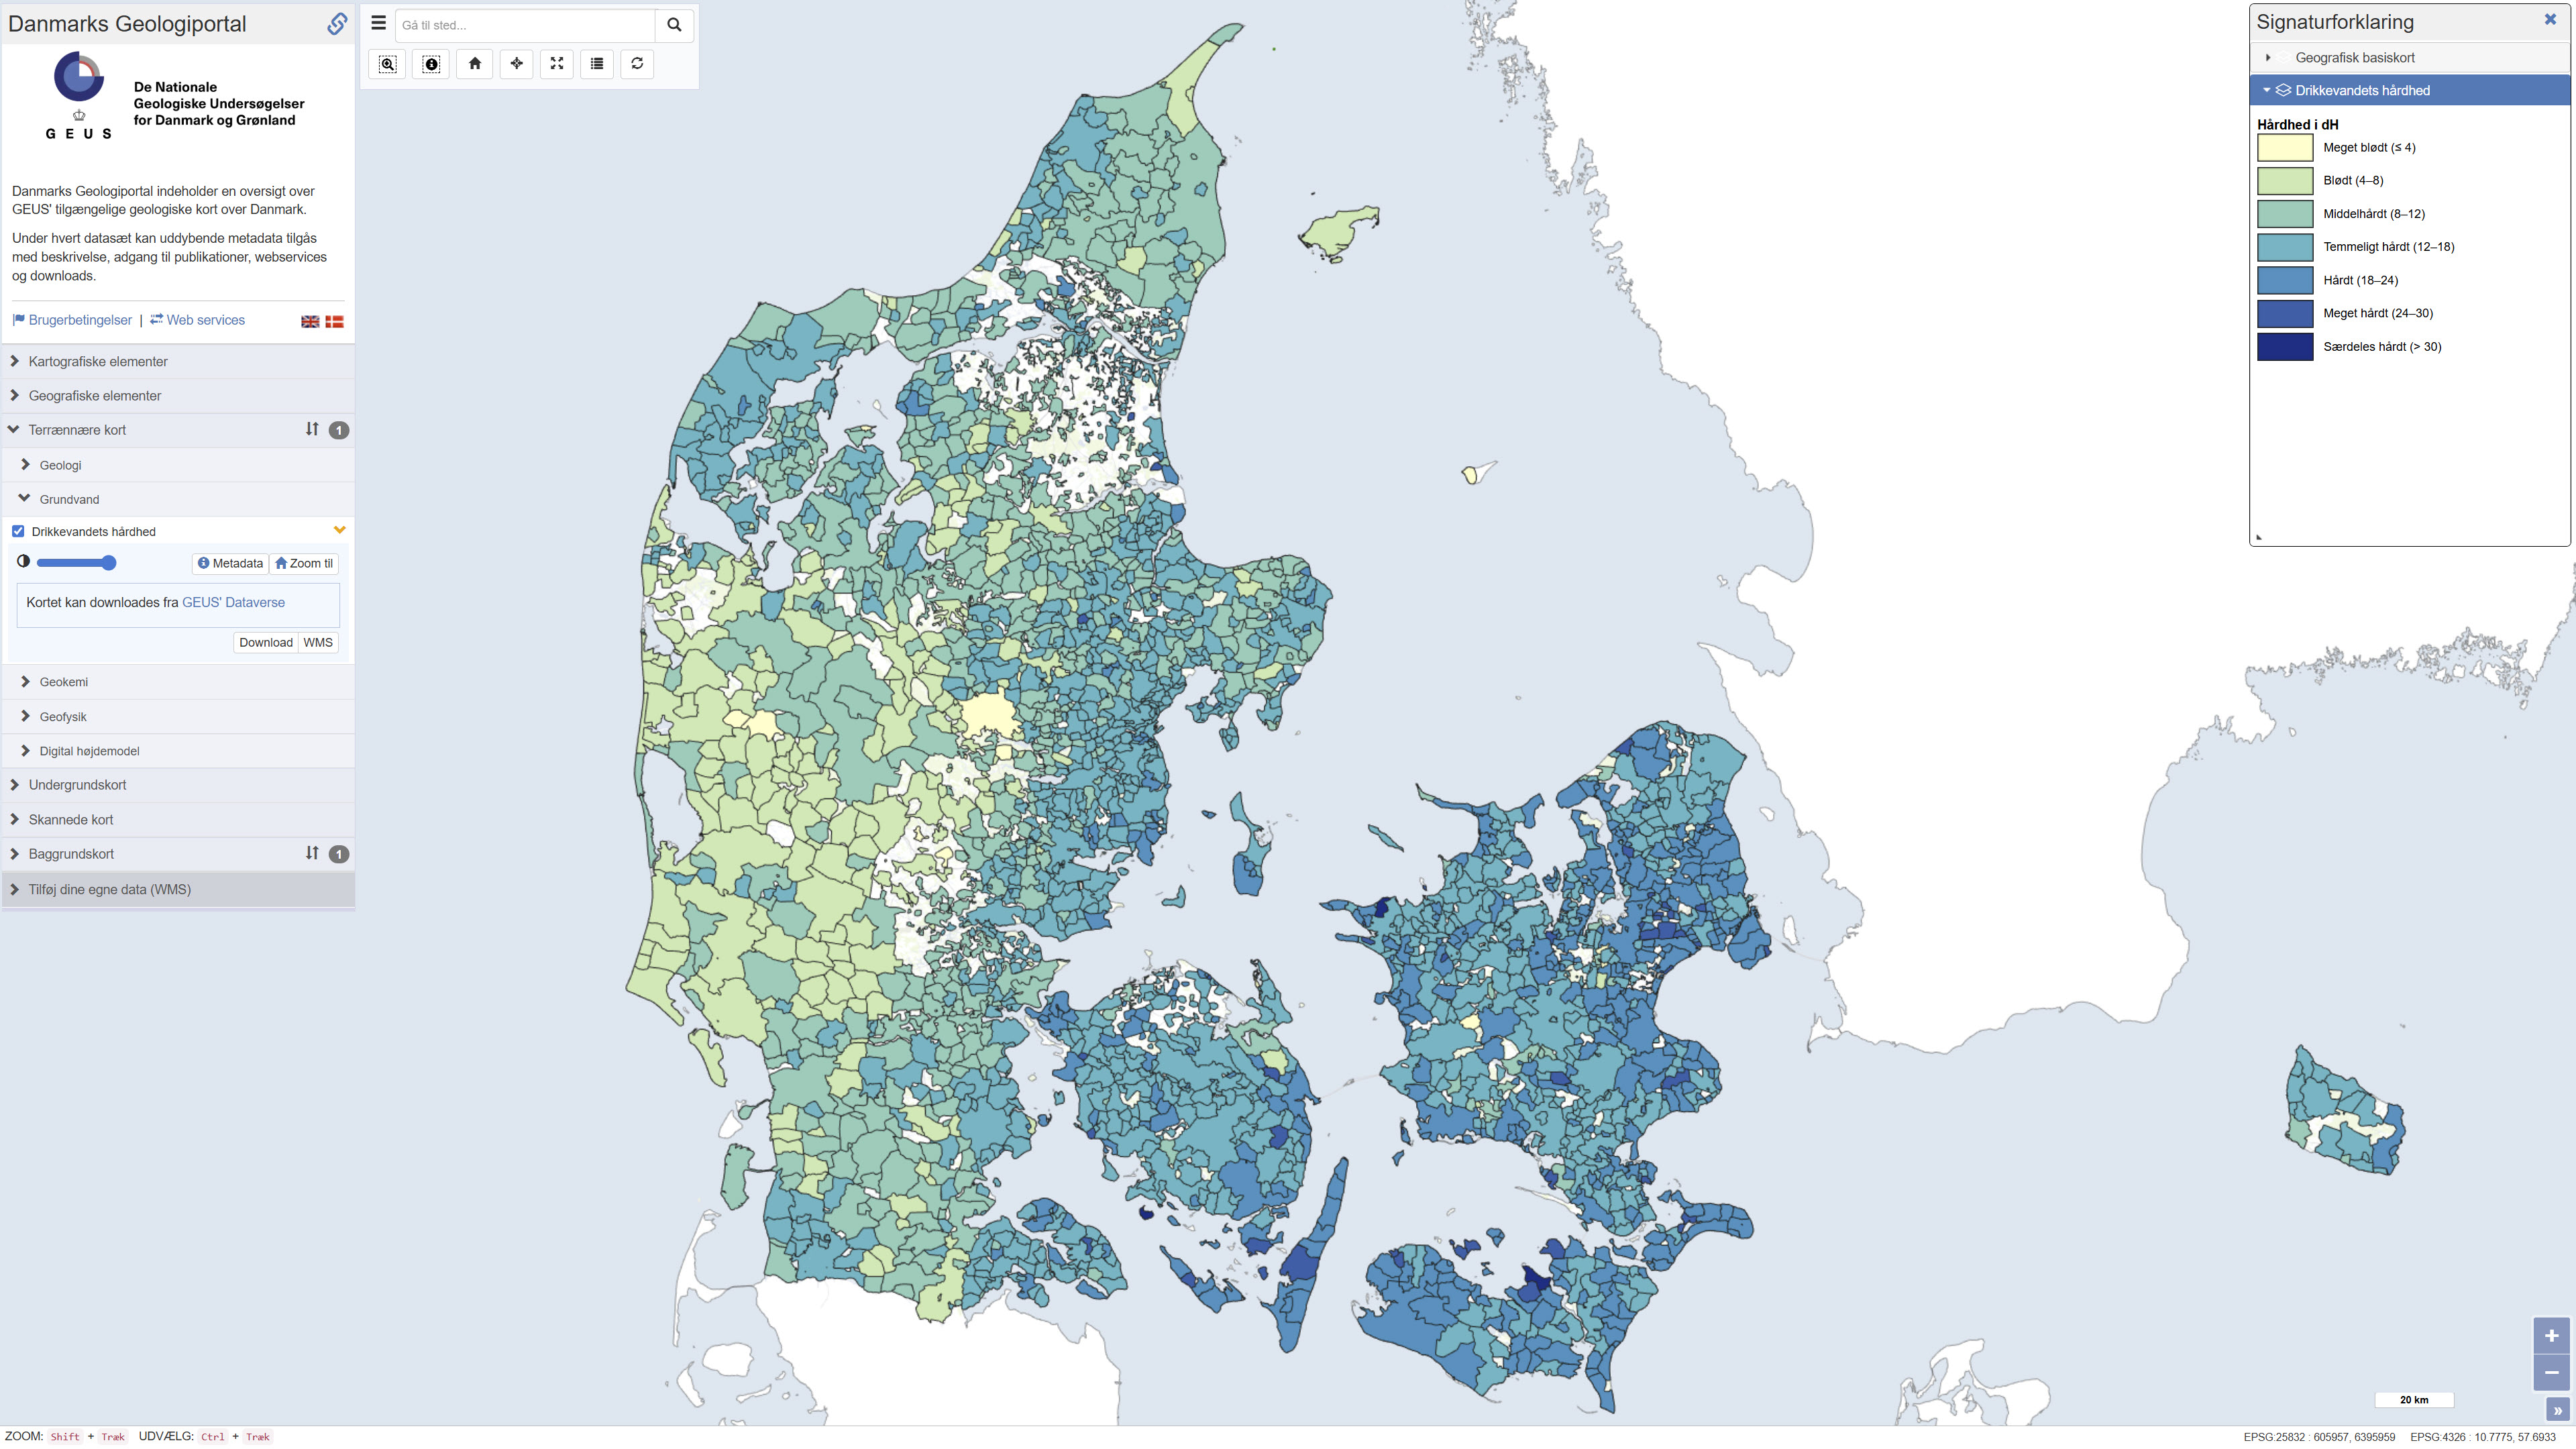
Map showing information about drinking water hardness (dH) at the level of water supply areas of public waterworks in Denmark based on quality-assured data, extracted from the national well-database Jupiter in September 2023. The hardness degree is based on the concentration of calcium and magnesium in the drinking water and has importance, for example, for the soap dosage when washing clothes: hard water requires more soap than soft water. Drinking water hardness may vary considerably from location to location and in time. Contact your water utility company to get the updated and precise figures.
-
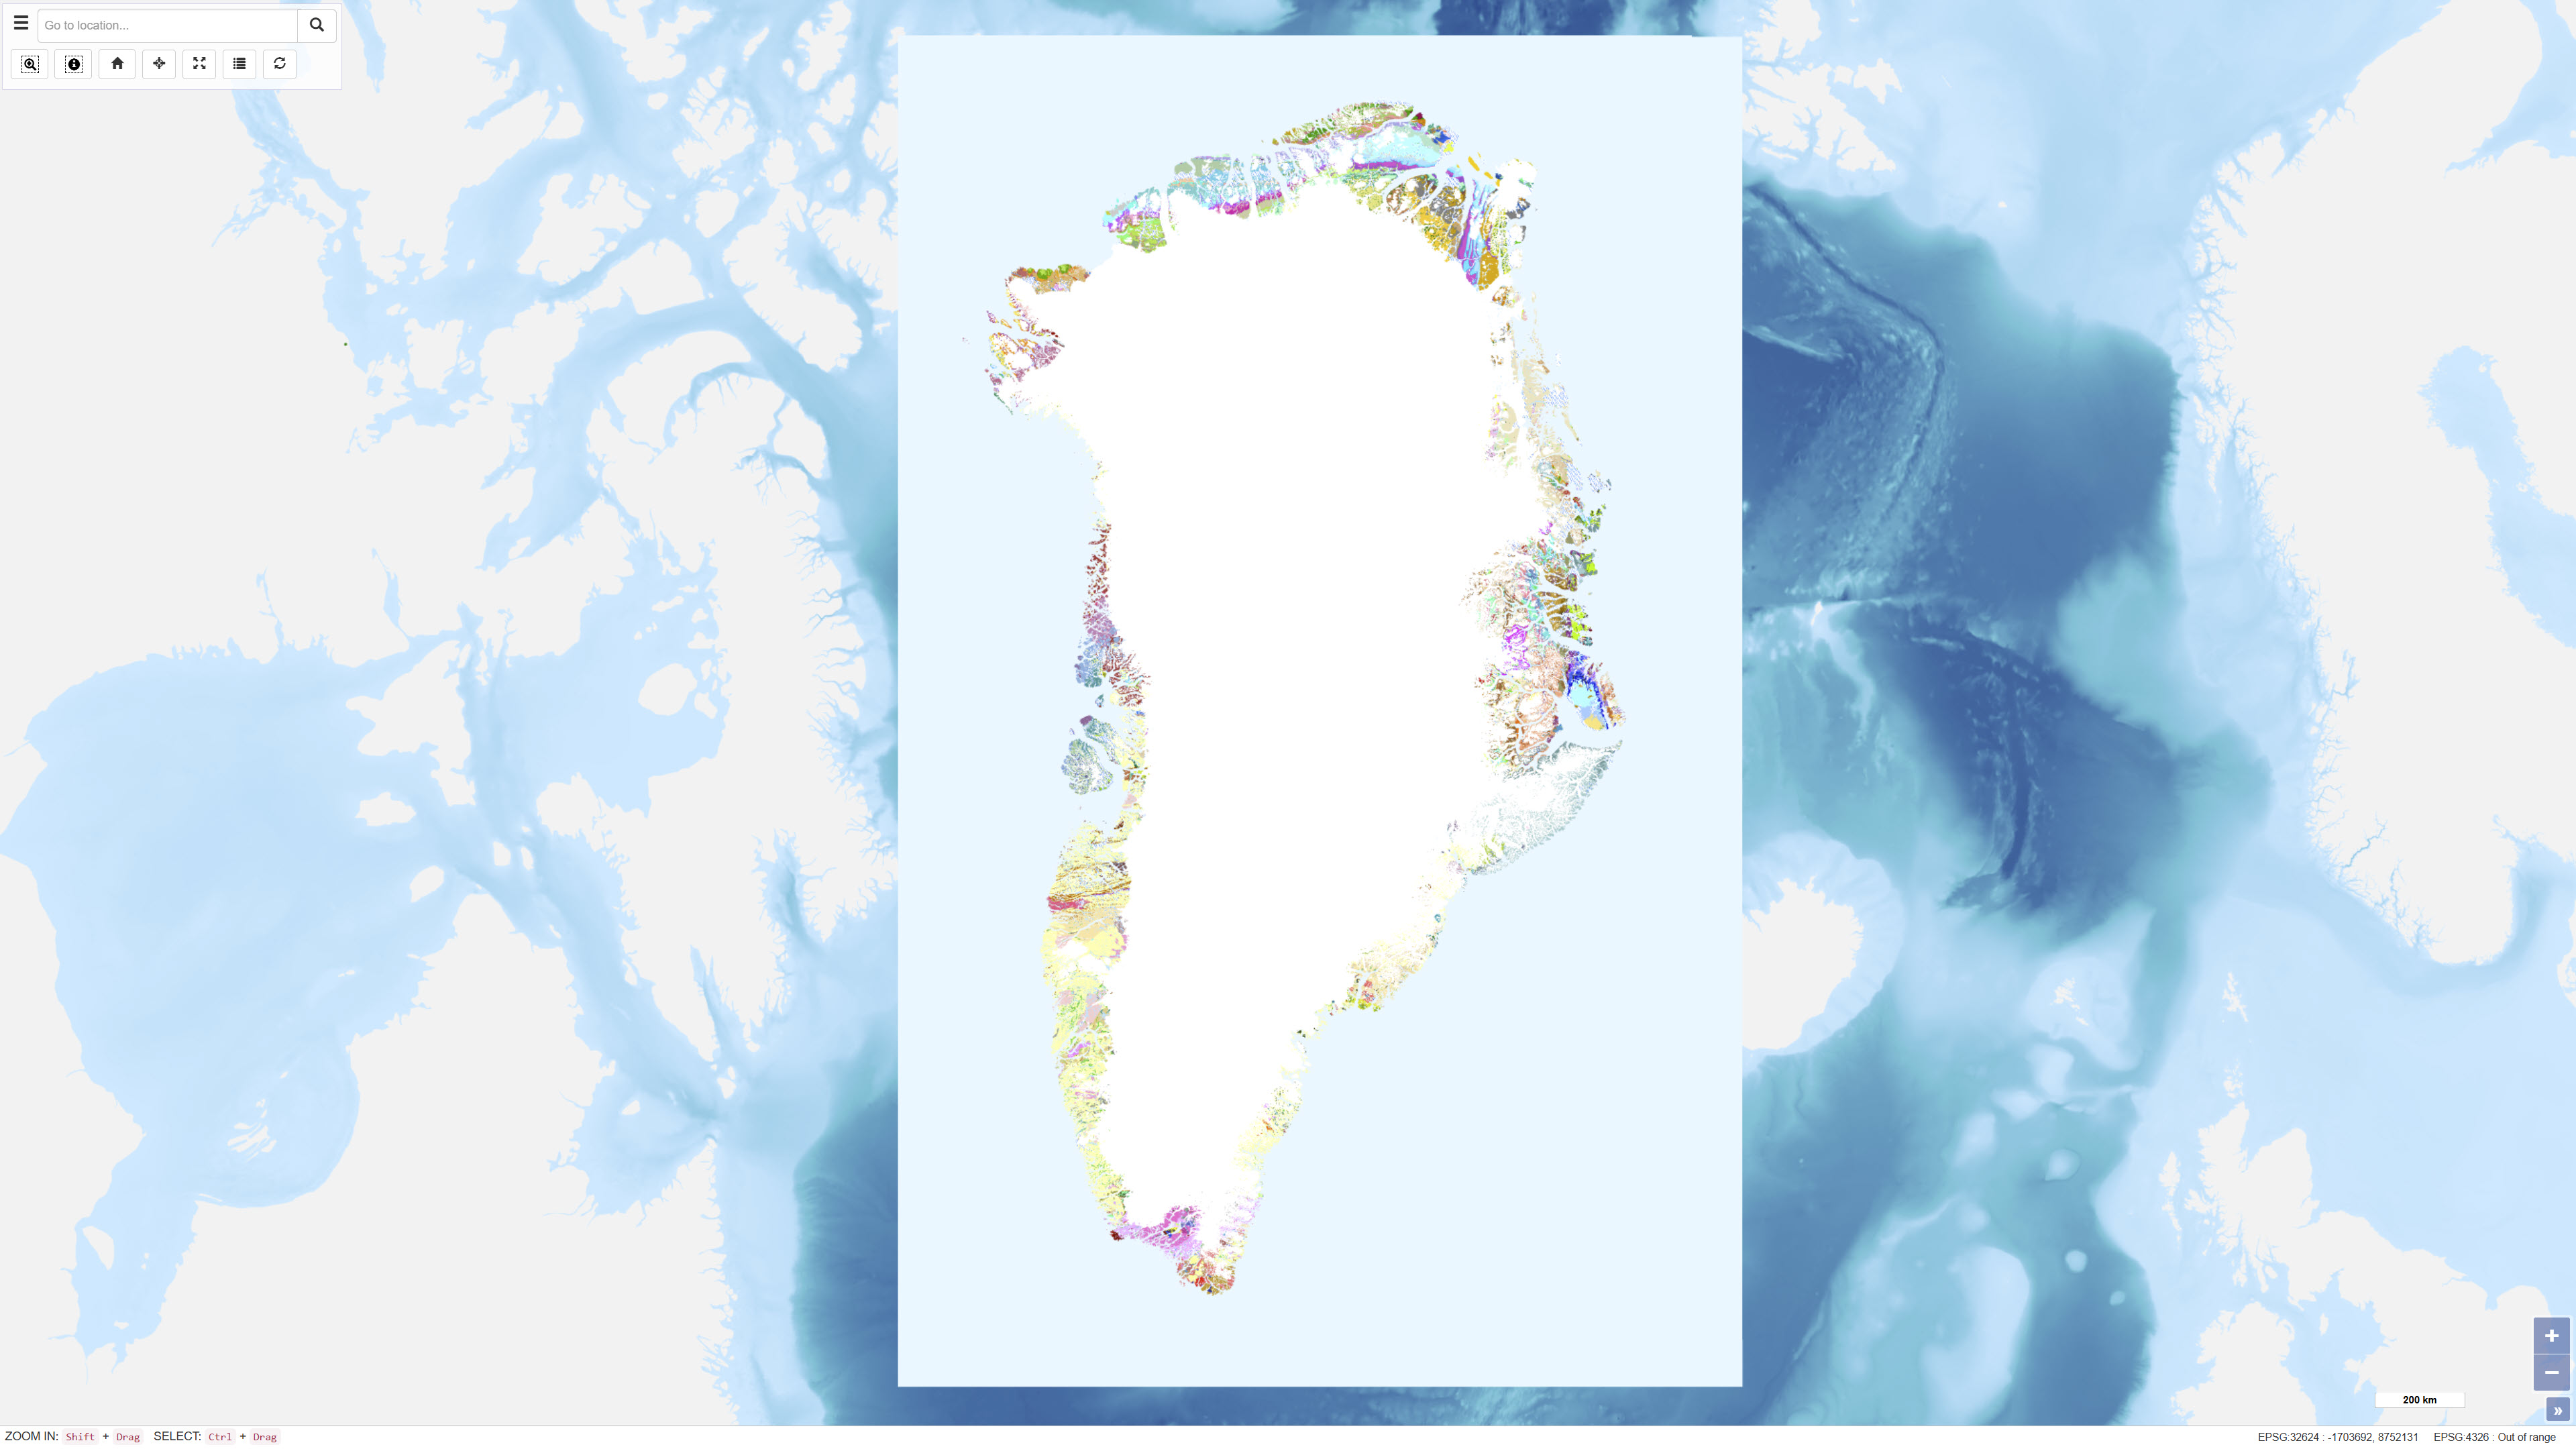
The geological map of Greenland at a scale of 1:500 000 is based on 14 digitised map sheets covering the whole of Greenland, with amendments in specific areas (Pedersen et al. 2013, GEUS Bulletin, DOI: 10.34194/geusb.v28.4727). The original digital version of the map was released through the Greenland Portal in 2012. Continued advances in geological knowledge have necessitated successive revisions in order to keep the map up to date. During the most recent update, a number of geographical areas were revised based on new geological data and interpretations, including parts of West Greenland, North Greenland, North-East Greenland, East Greenland and South-East Greenland. The updated map incorporates revised stratigraphic interpretations and improved representation of geological units and structures. The map has undergone extensive quality control, including complete harmonisation of lineaments and structural elements across map-sheet boundaries. The geological legend is dynamic and reflects the content of the current map view. Geological units are supported by descriptive information, and for most map polygons links are provided to a geological unit database containing further descriptions.
-
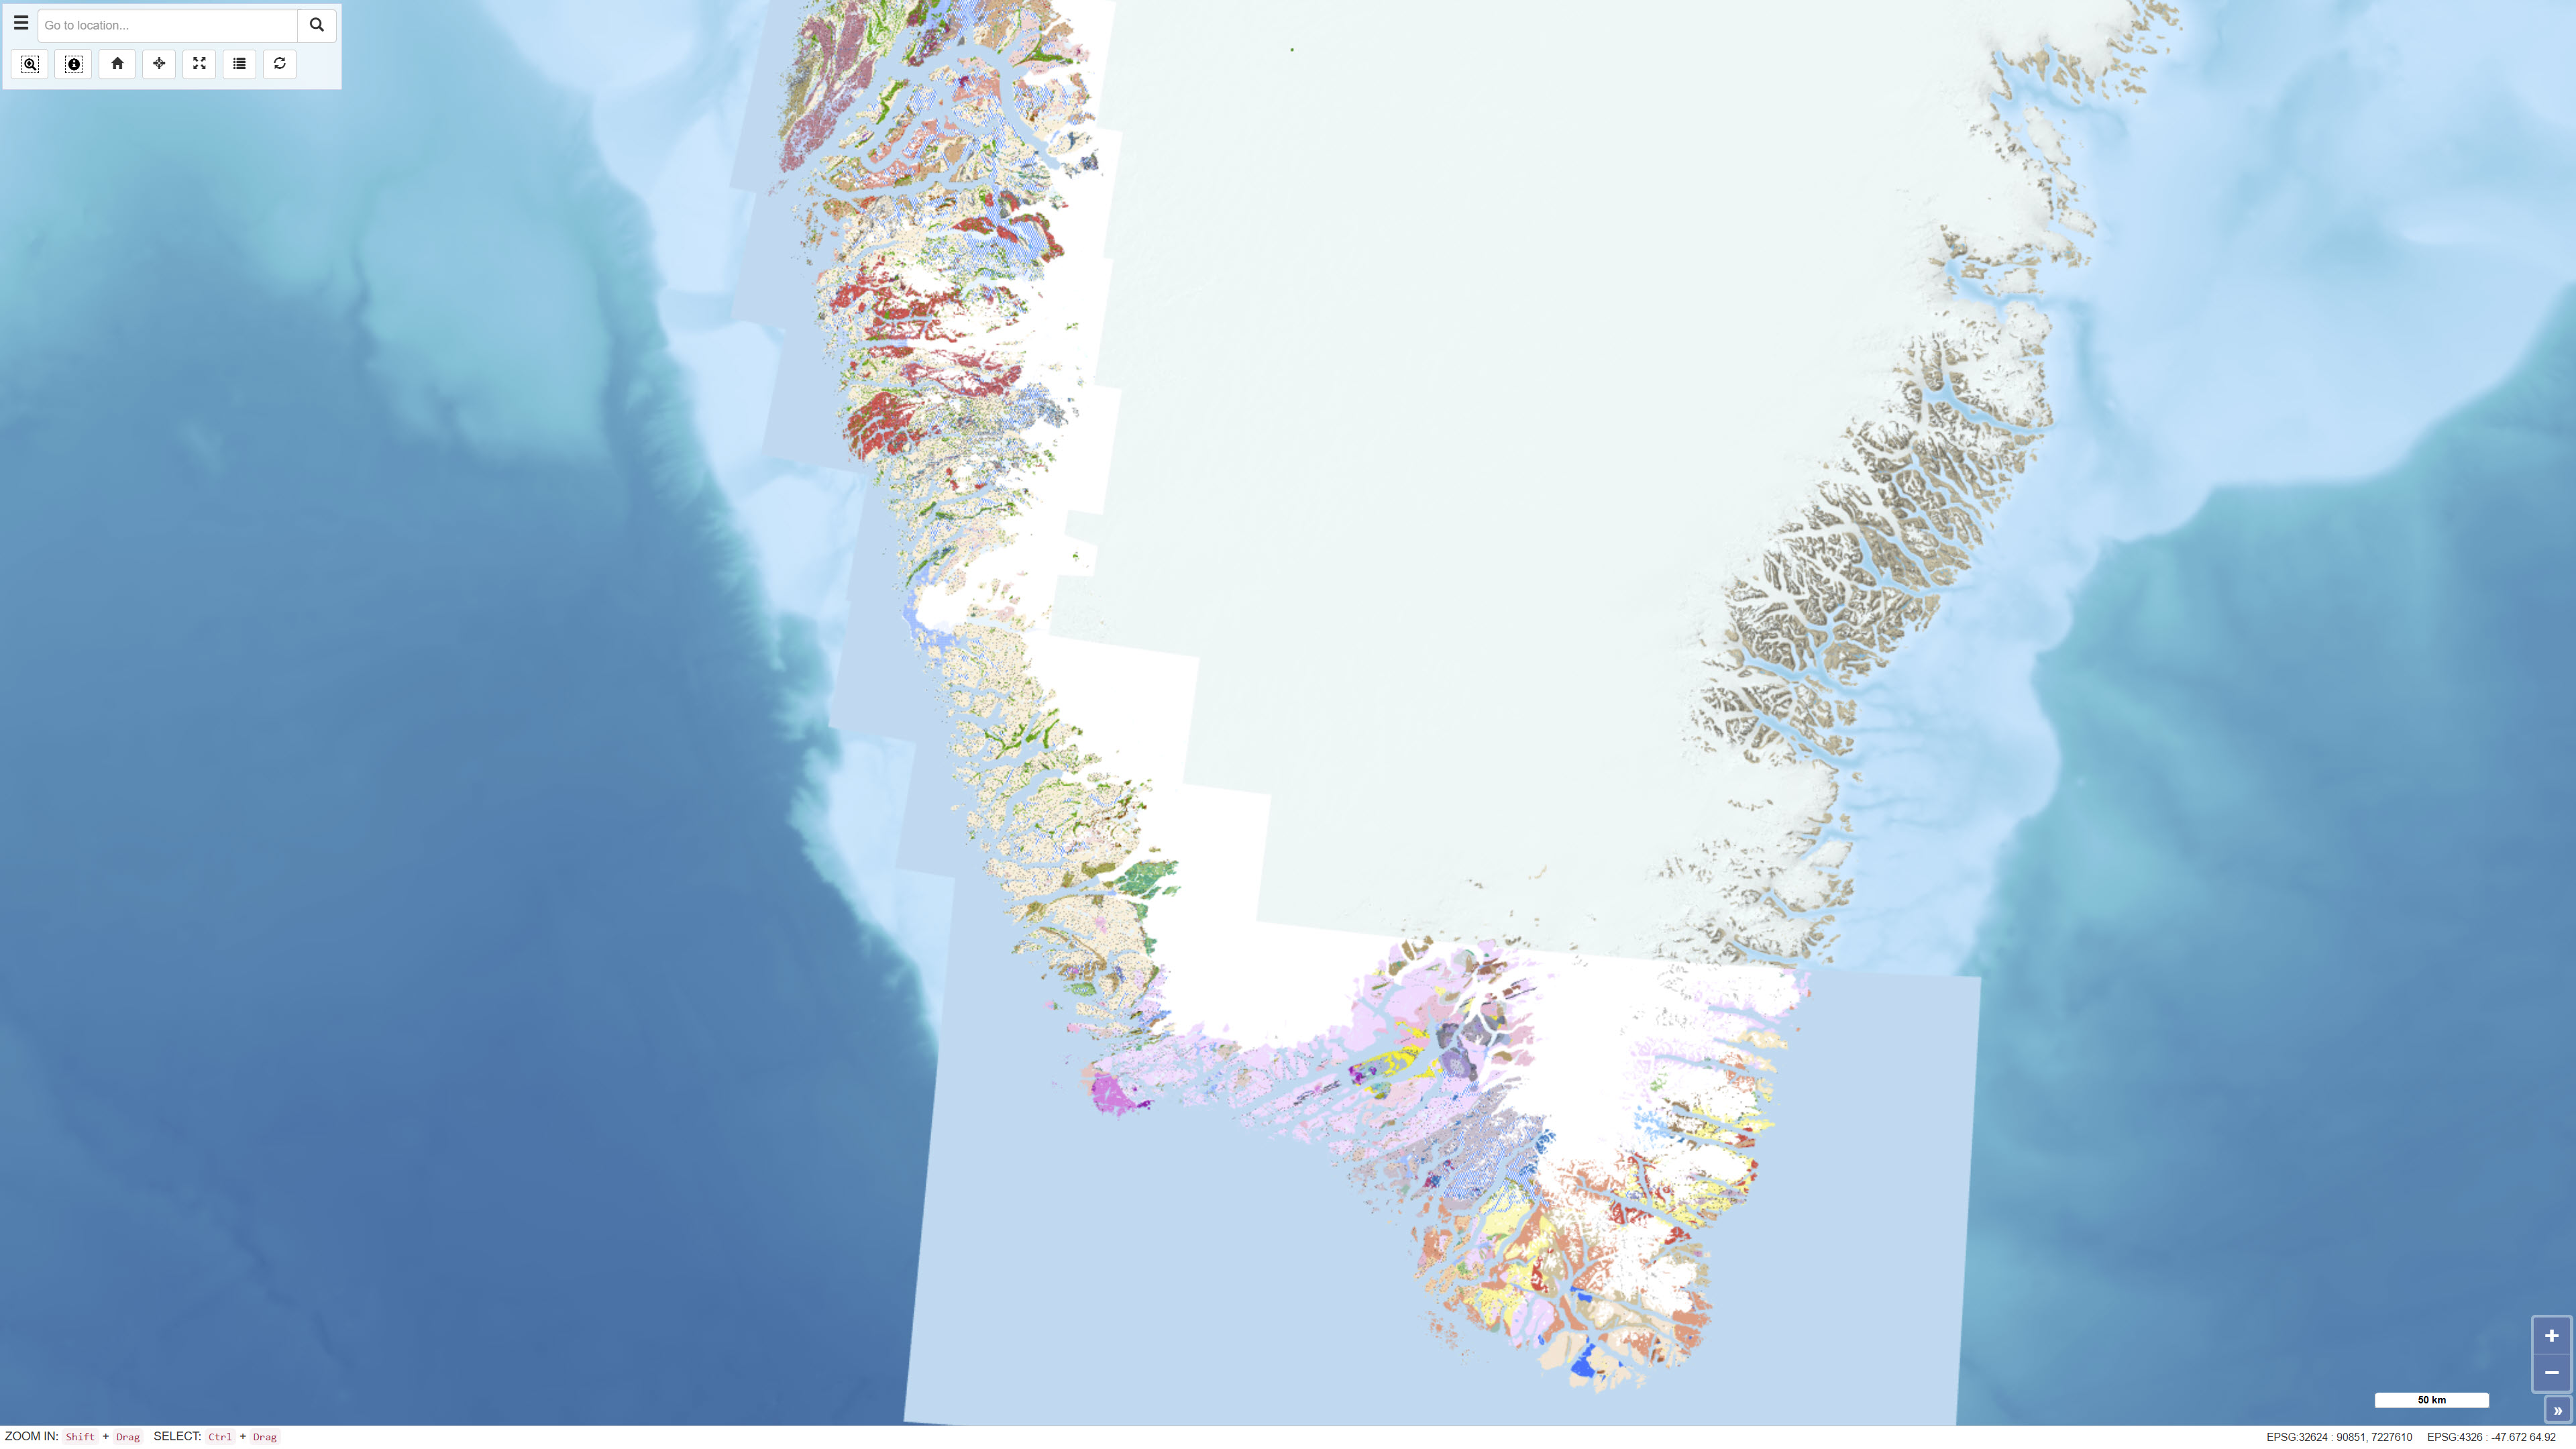
The seamless digital geological map is based on the digitisation and harmonisation of 21 geological map sheets at 1:100 000 scale, originally published by GGU/GEUS between 1966 and 2011. This edition updates and expands the 2019 version, which included 16 sheets, by integrating five additional 1:100 000 sheets and selected information from 1:500 000 scale maps in areas lacking detailed coverage. The map also incorporates a simplified geological interpretation of Bjørneøen and Storeø in Godthåbsfjorden based on detailed mapping by Claus Østergaard (2005). The dataset provides a consistent, seamless geological framework optimised for digital display at the 1:100 000 scale.
-
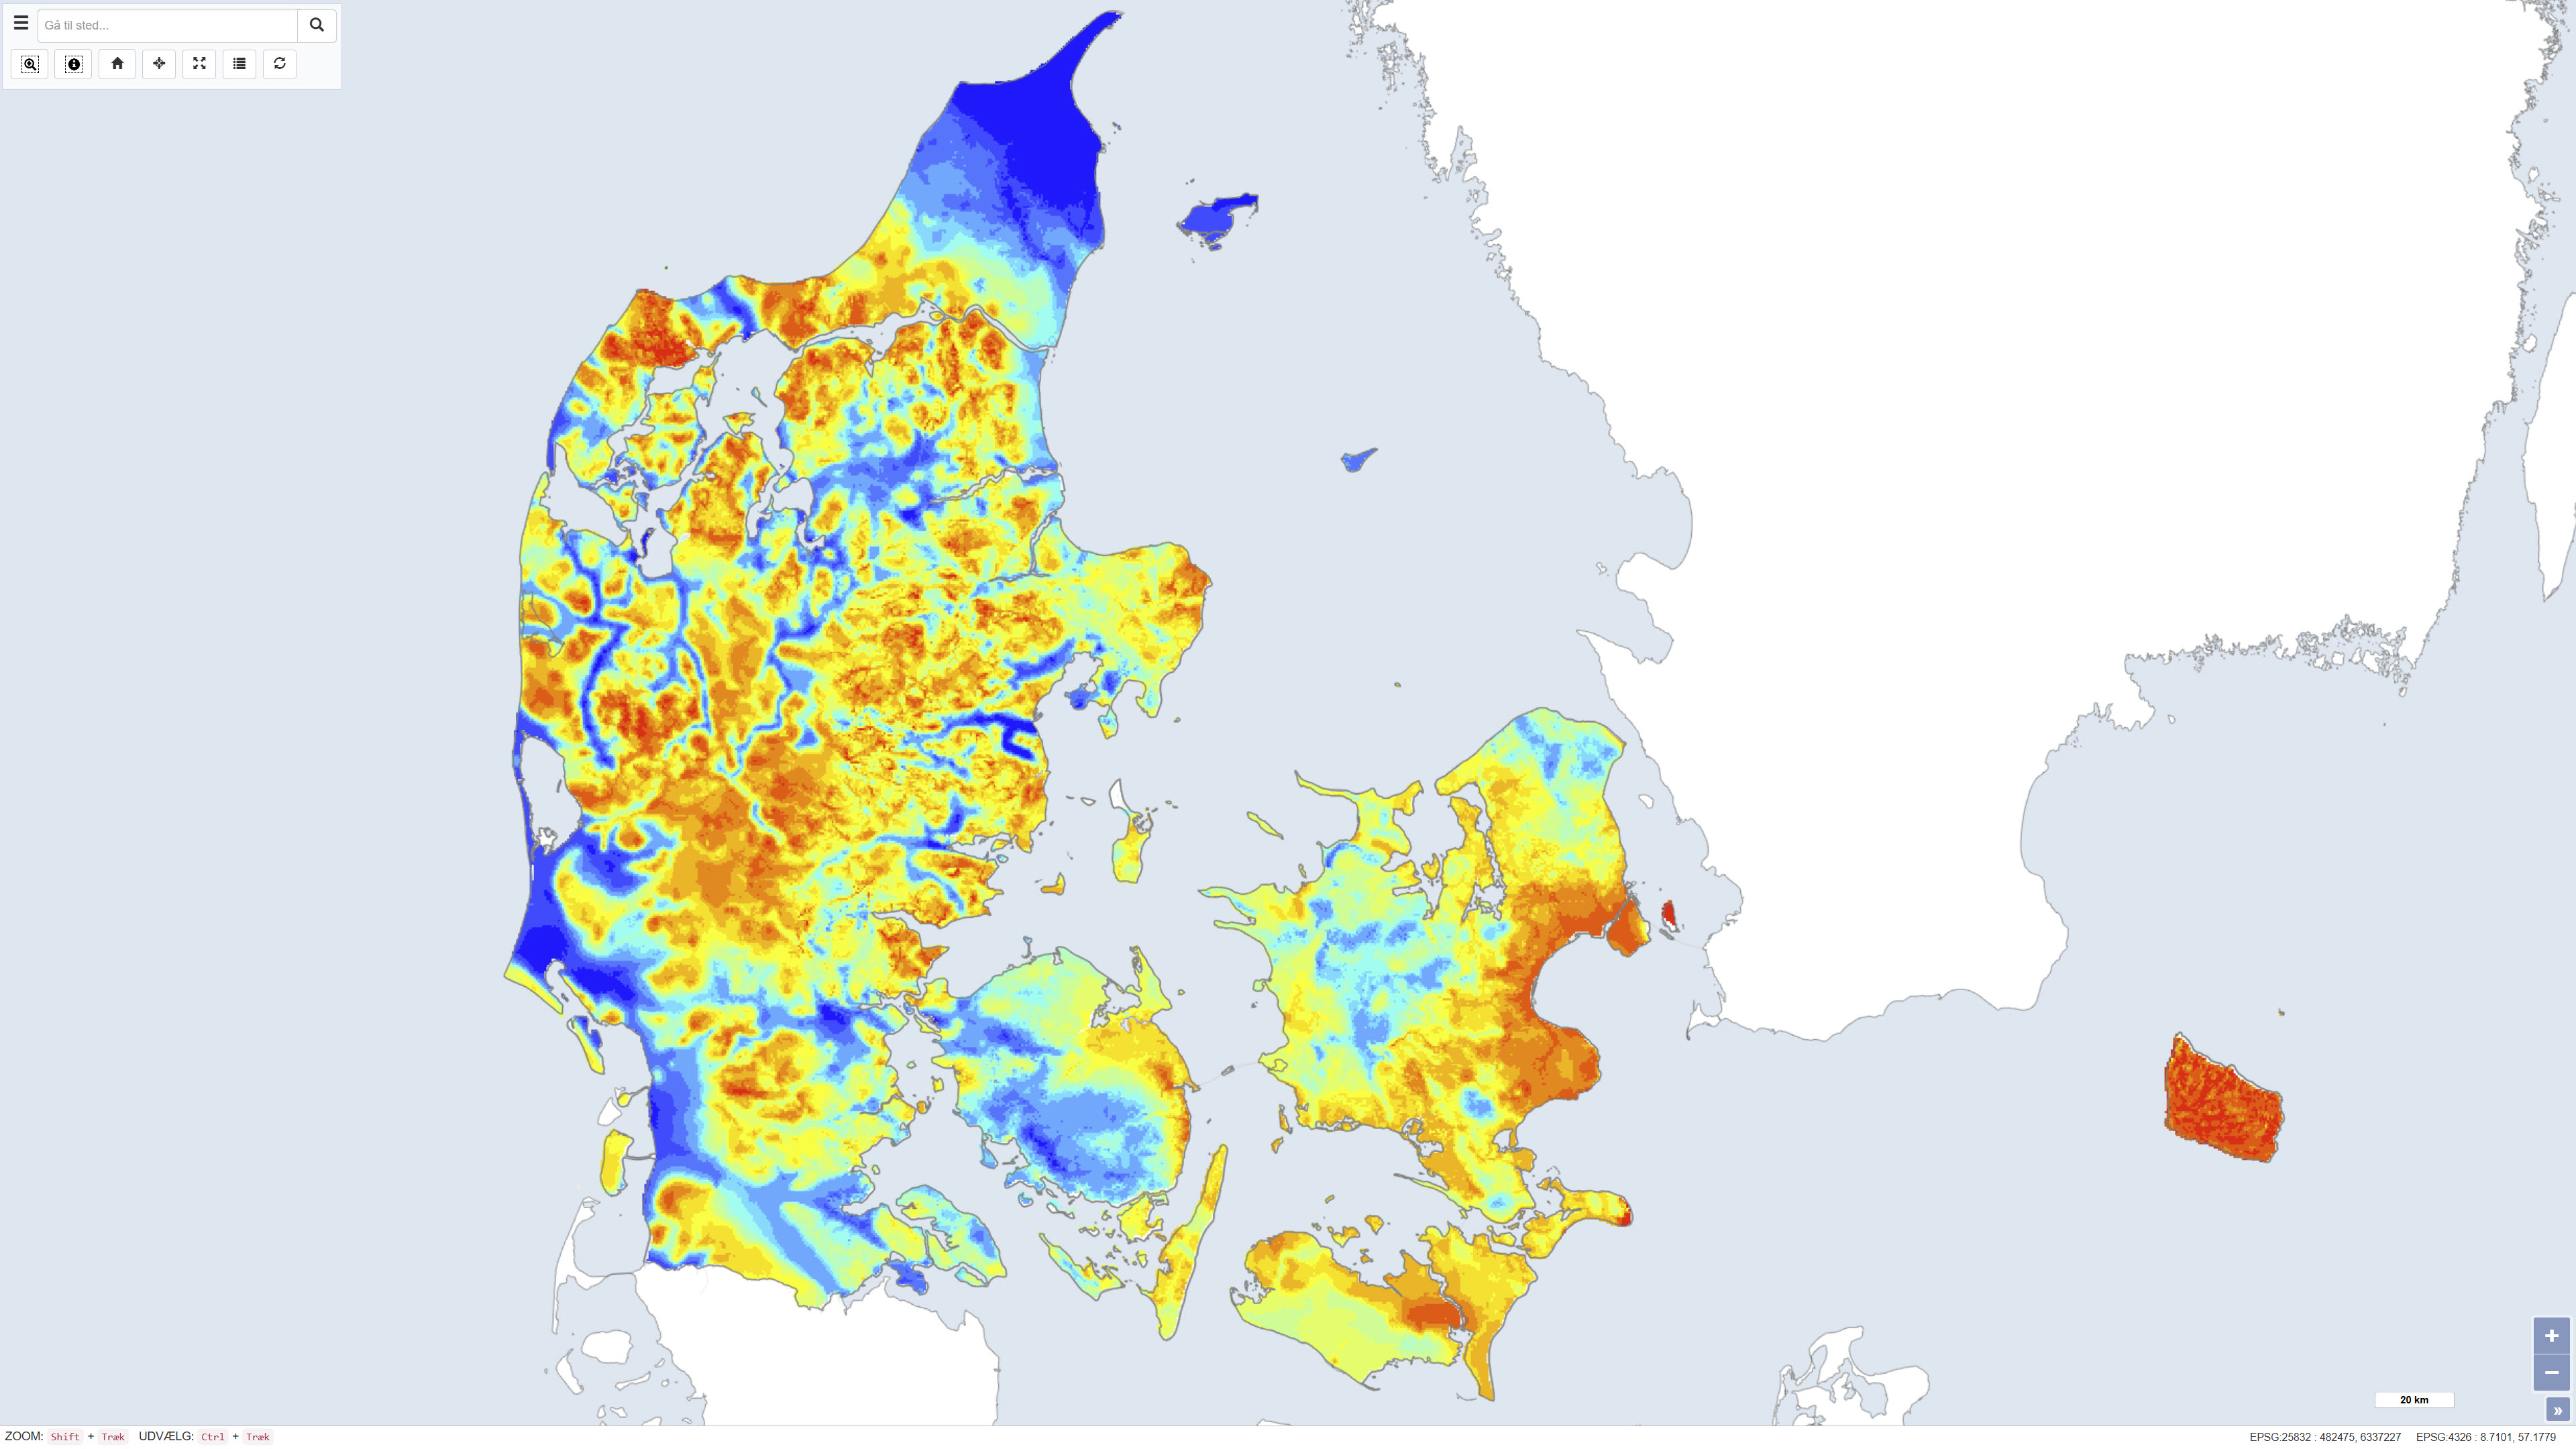
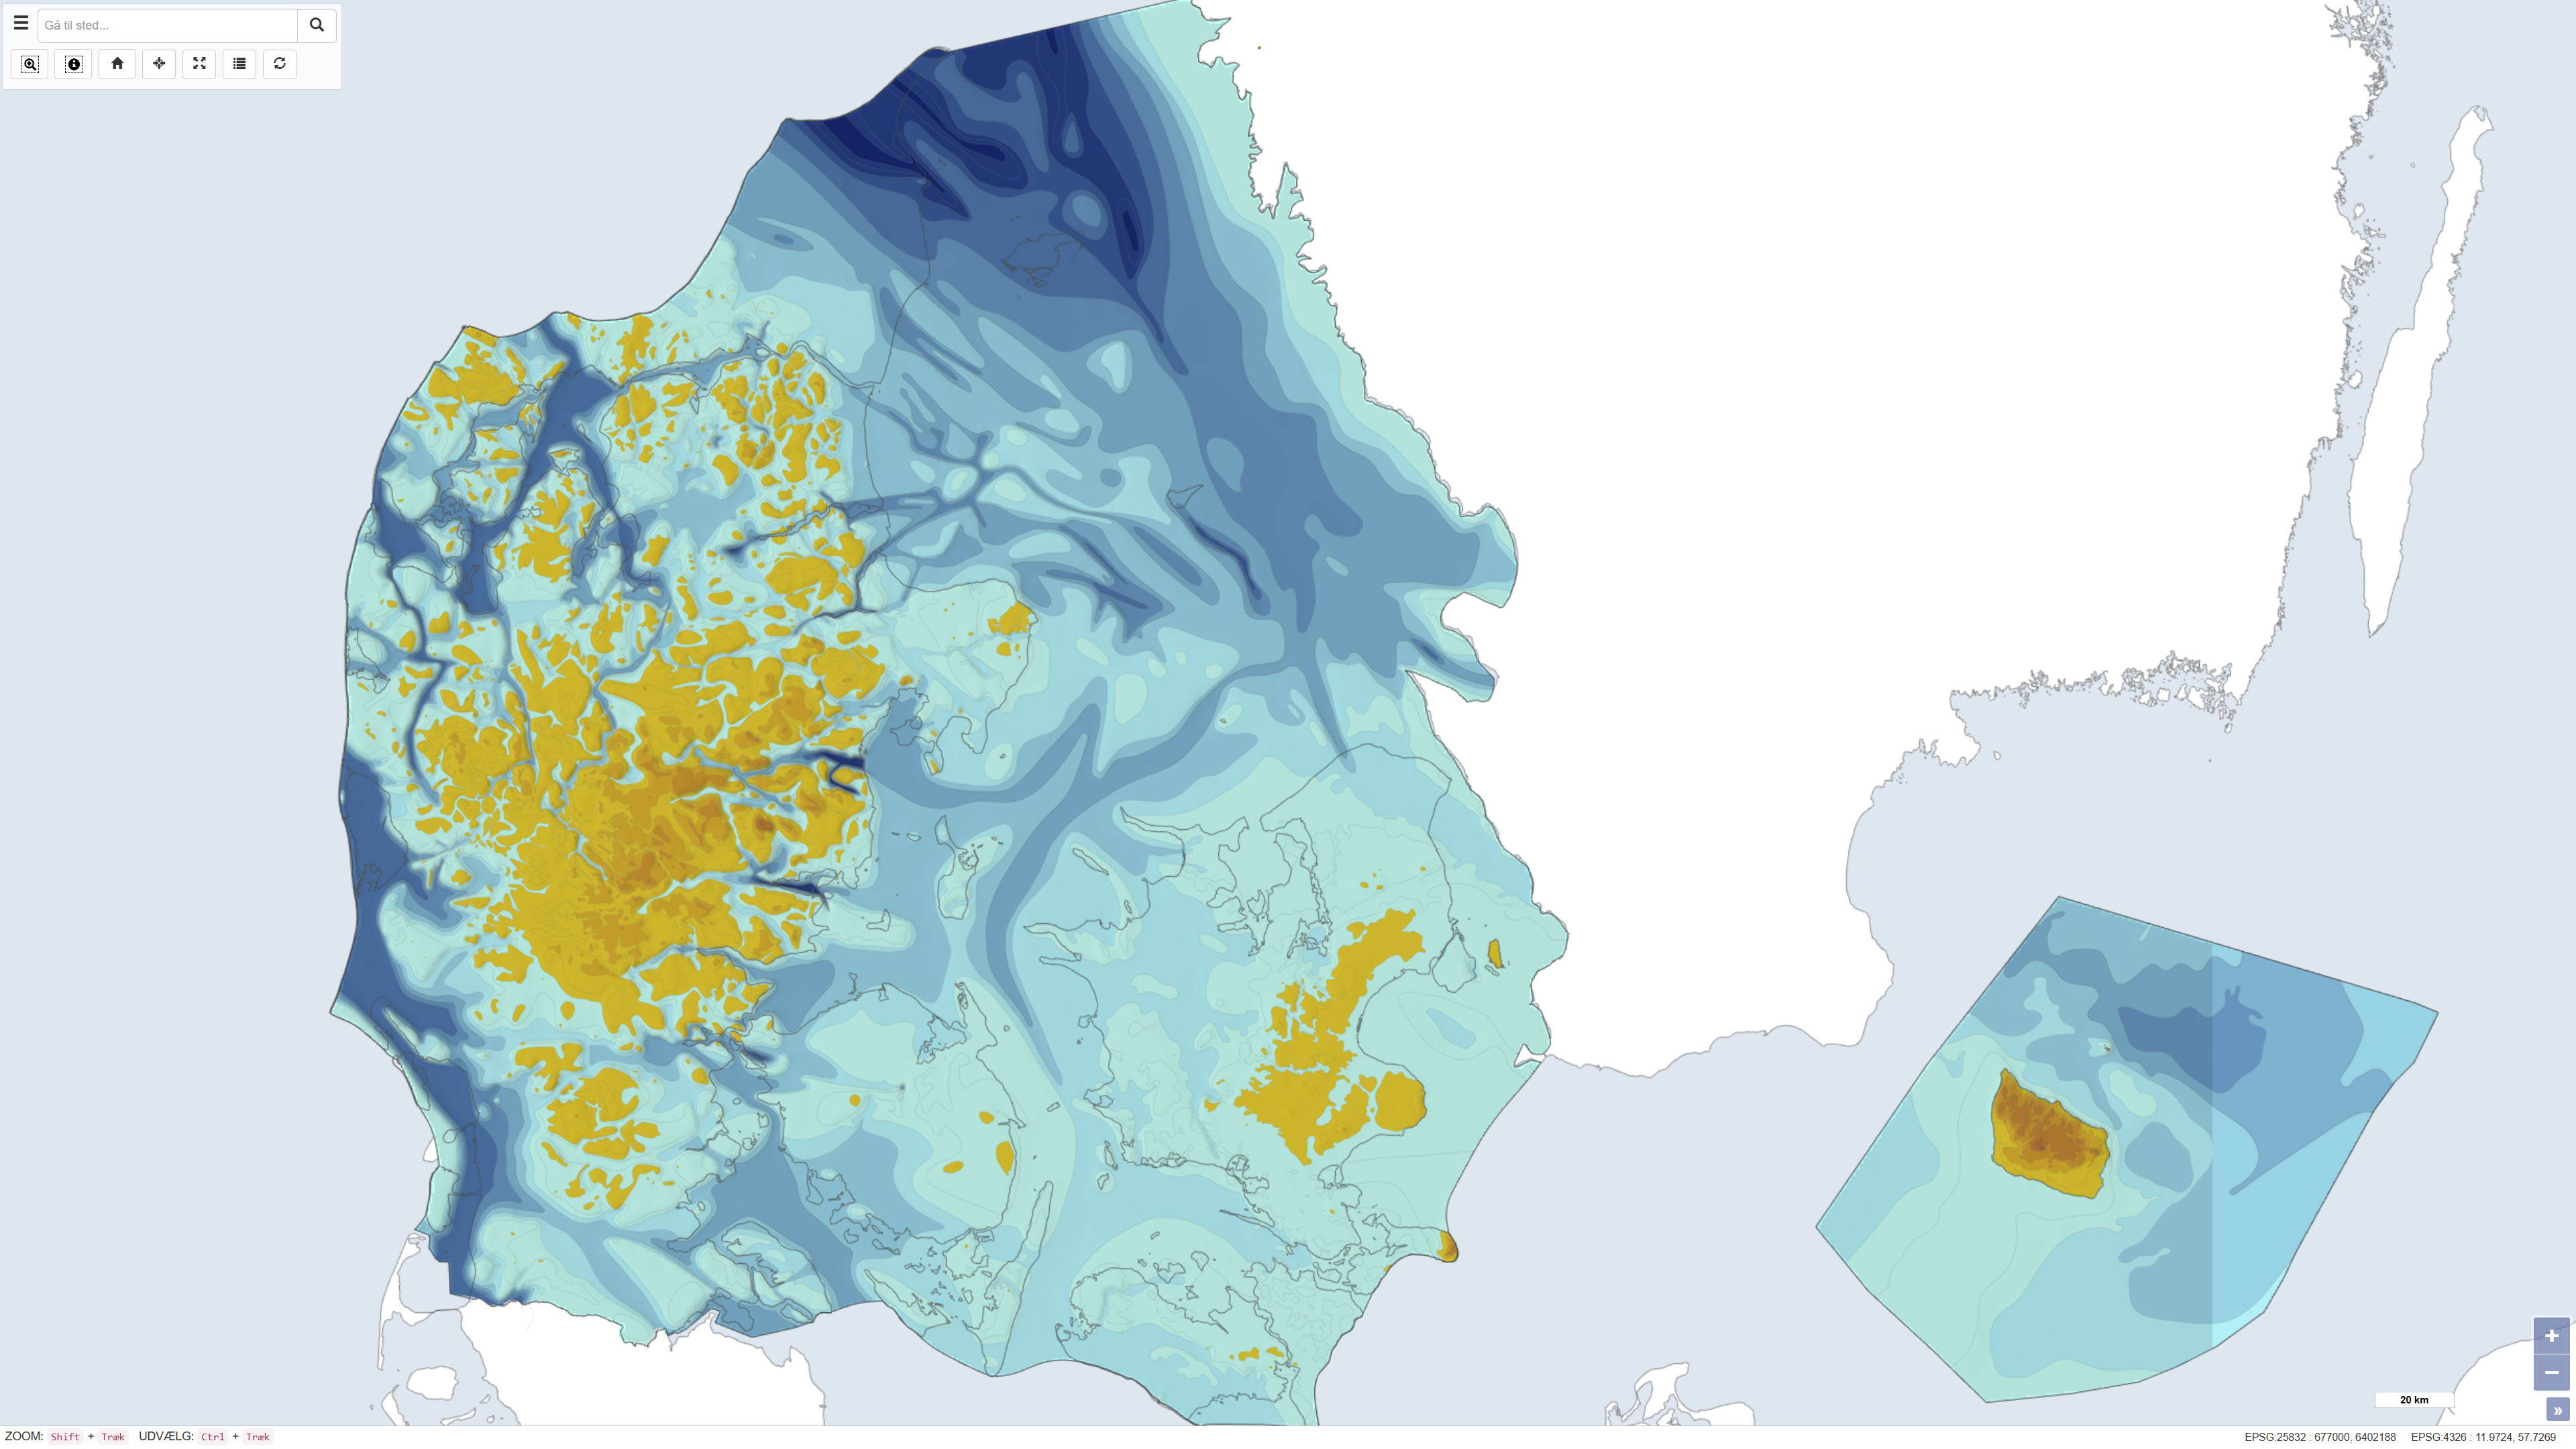
The dataset shows the thickness of Quaternary deposits in Denmark. The thickness has been calculated as the difference between surface elevation and the depth to the top of the pre-Quaternary deposits. The map provides a nationwide overview of variations in Quaternary thickness and is used in geological, hydrogeological and planning-related contexts.
-
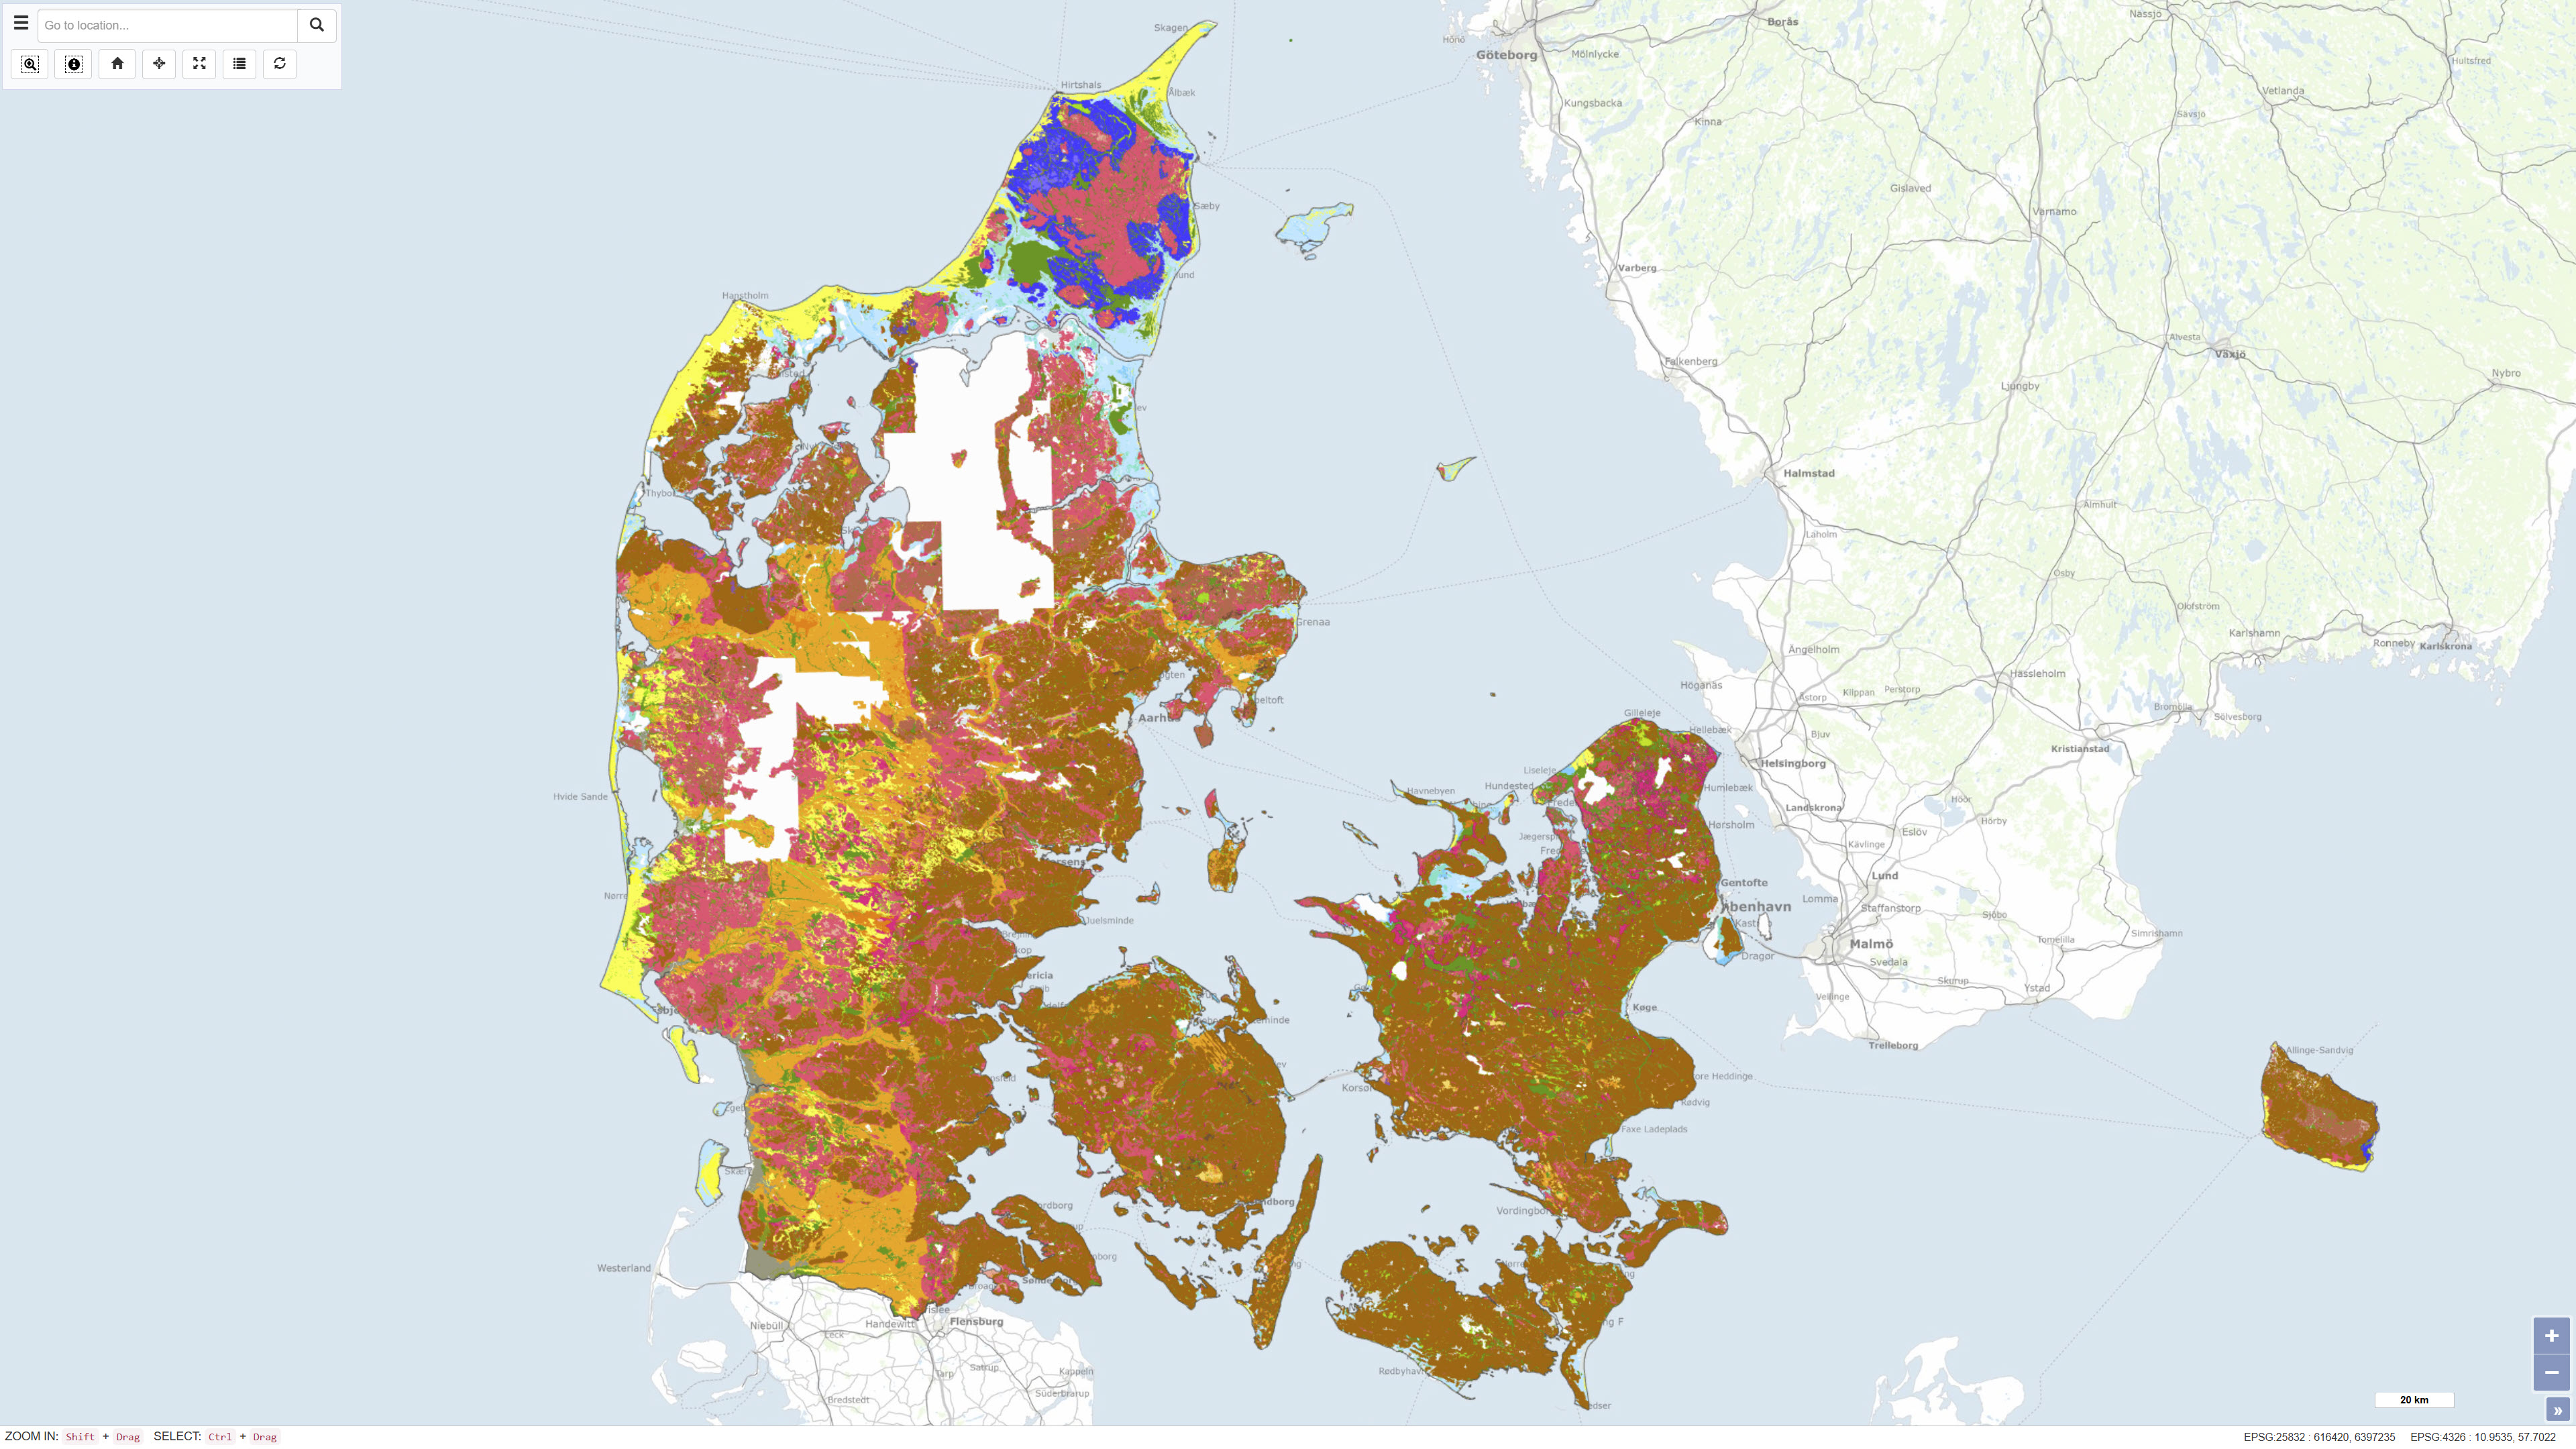
The Digital Geological Map of Denmark 1:25,000, version 7.0, is a nationwide geological dataset describing the distribution of near-surface soil and sediment types across Denmark. The dataset is produced and maintained by the Geological Survey of Denmark and Greenland (GEUS) and represents the latest version of the digital soil and sediment map at a scale of 1:25,000. The map is based on an integrated interpretation of geological field observations, borehole data, historical analogue maps, and more recent digital datasets. Soil and sediment units are classified according to their lithological and genetic characteristics and represent the dominant materials in the uppermost geological layers. The dataset is continuously updated, and version 7.0 includes both revisions of previously mapped areas and newly mapped regions. The dataset is widely used as a foundation for geological analysis, land-use planning, environmental assessment, groundwater protection, raw material management, research, and education. In version 7 from 2023, 93% of Denmark's land area is classified, and the map is continuously supplemented. The map and sediment type description are published in GEUS report 2023/29, where further information is available.
-
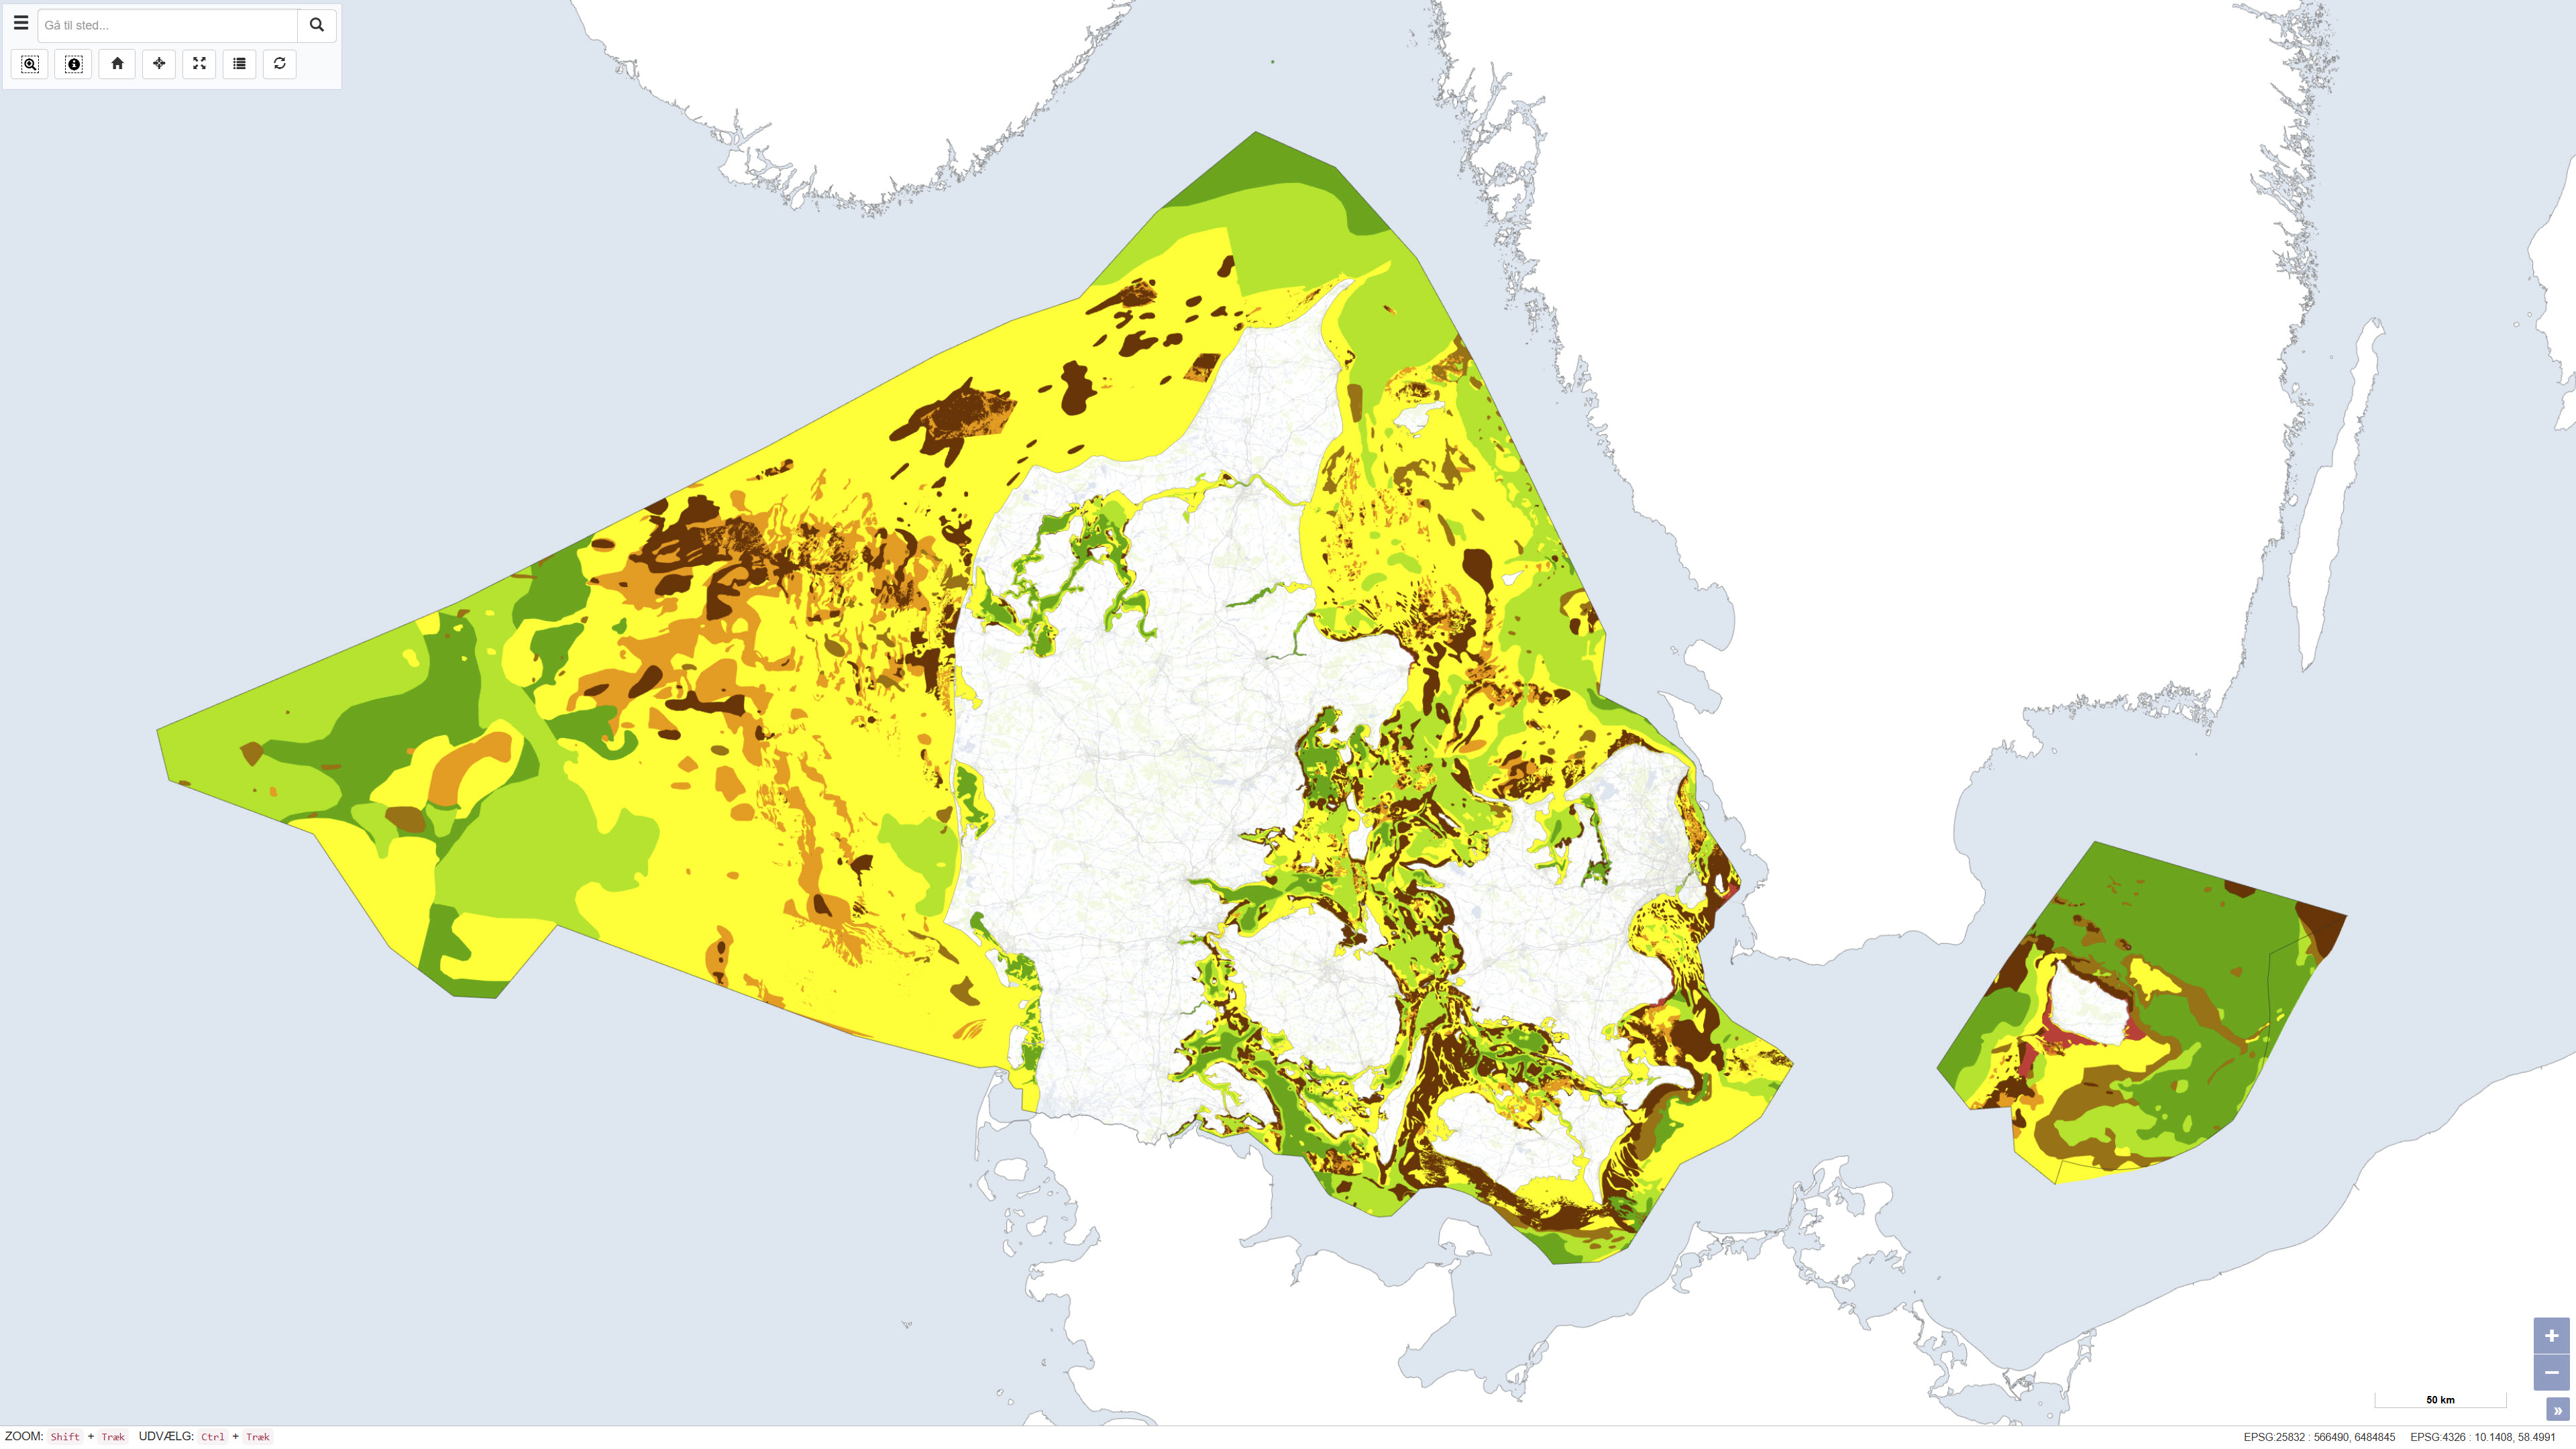
The seabed sediment map shows the distribution of seabed sediments in Danish waters and represents an integrated interpretation of sediment types within the upper approximately 0.5 metres of the seabed. Sediment classes are defined based on grain-size composition and reflect an average of the surface sediments. Glacial till is classified as a mixed sediment, while sedimentary bedrock indicates areas where deposits several million years old are exposed on the seabed. The map was updated in 2020 and builds upon the previous version from 2014, with newly mapped areas added at full level of detail. The dataset provides a nationwide overview of seabed sedimentary conditions and is used, among other purposes, for raw material mapping, marine spatial planning, and environmental assessments.
-
This dataset represents the pre-Quaternary surface topography of Denmark, including Kattegat, internal waters and the sea around Bornholm. The map provides a paleotopographic relief of the surface that existed prior to deposition of Quaternary sediments, compiled from geological borehole data, seismic surveys and topographic sources. It includes polygons with 25 m contour intervals, a 500 m grid and boundary delineations, usable in combination with a standard elevation model to determine Quaternary cover thickness. The base map was hand-drawn at 1:250,000 scale and forms a nationwide thematic map product. The map is described in DGU map series no. 44, 1994.