 Arctic SDI catalogue
Stratigraphy
Type of resources
Available actions
Topics
Keywords
Contact for the resource
Provided by
Formats
Representation types
Update frequencies
status
Scale
-
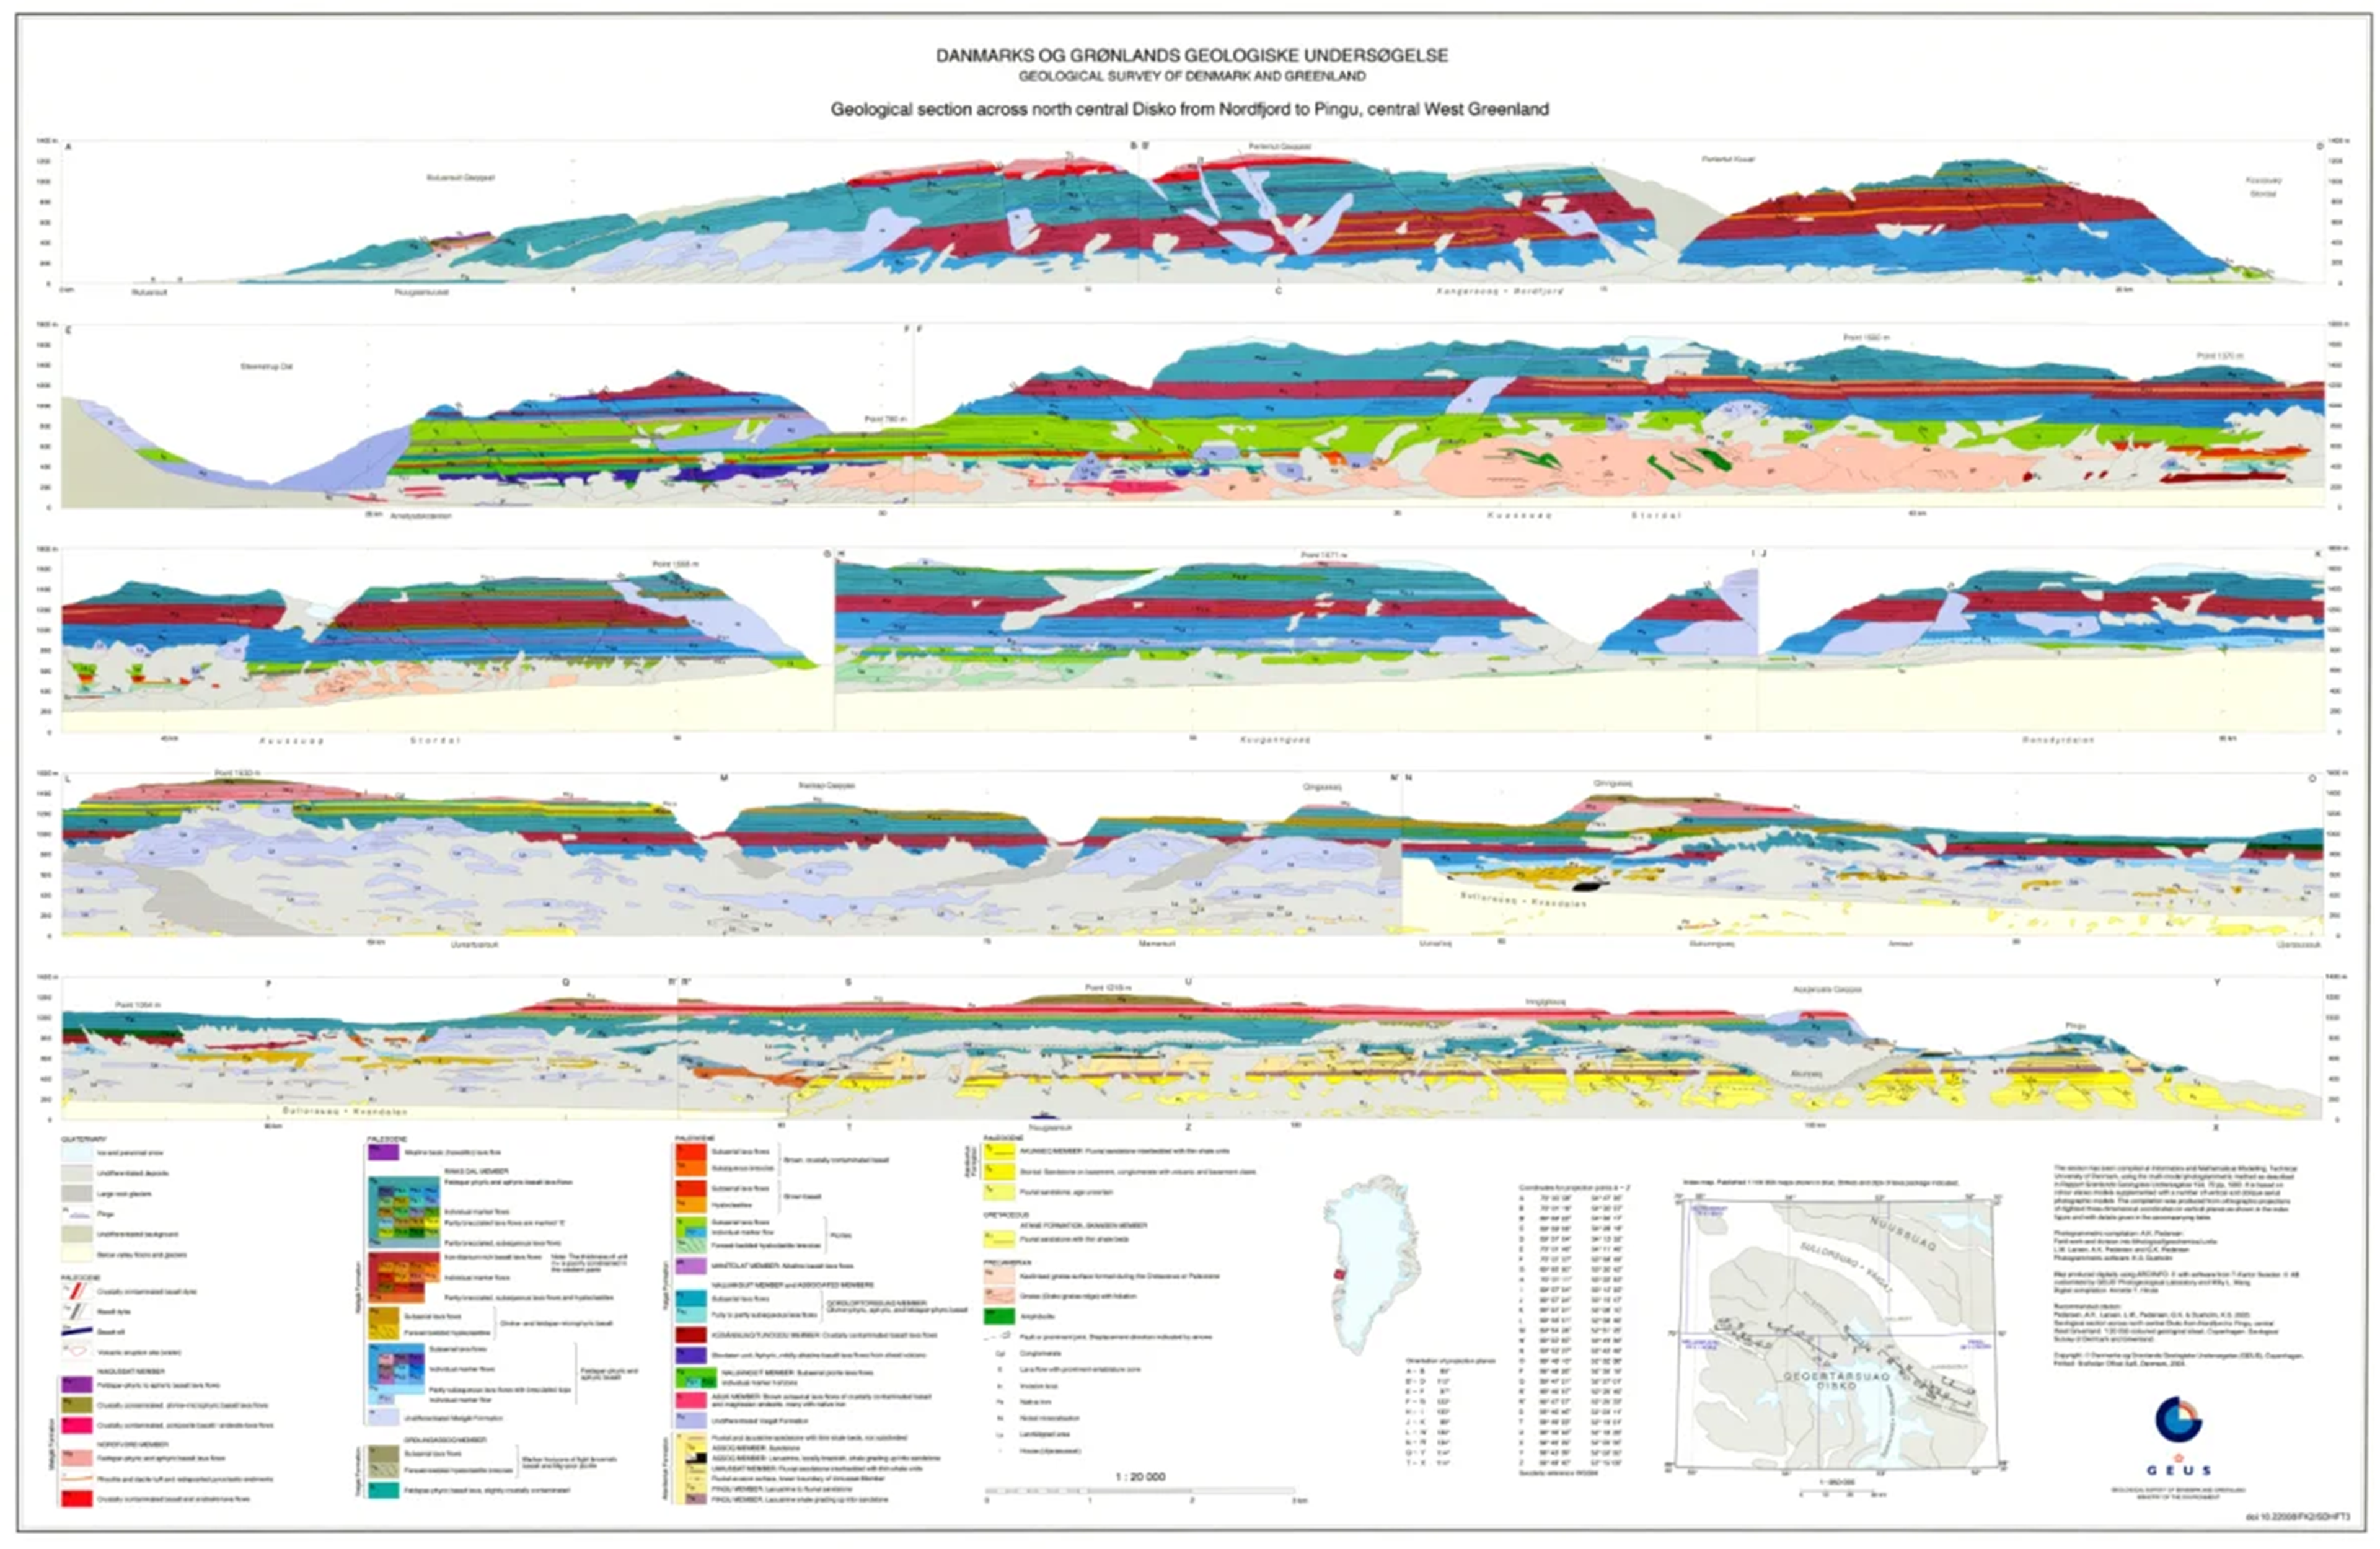
The dataset comprises a collection of geological cross sections from Greenland derived from multiple geological mapping projects and publications. The cross sections represent interpretations of subsurface geological structures and stratigraphy across selected regions and are associated with published geological maps and reports. Profile lines have been georeferenced, and the corresponding cross-section images have been digitised and stored as separate PDF files. Each profile is linked to the geological map or publication from which it originates. Due to the diverse origins of the profiles, the level of detail, scale and geological interpretation vary between individual cross sections.
-
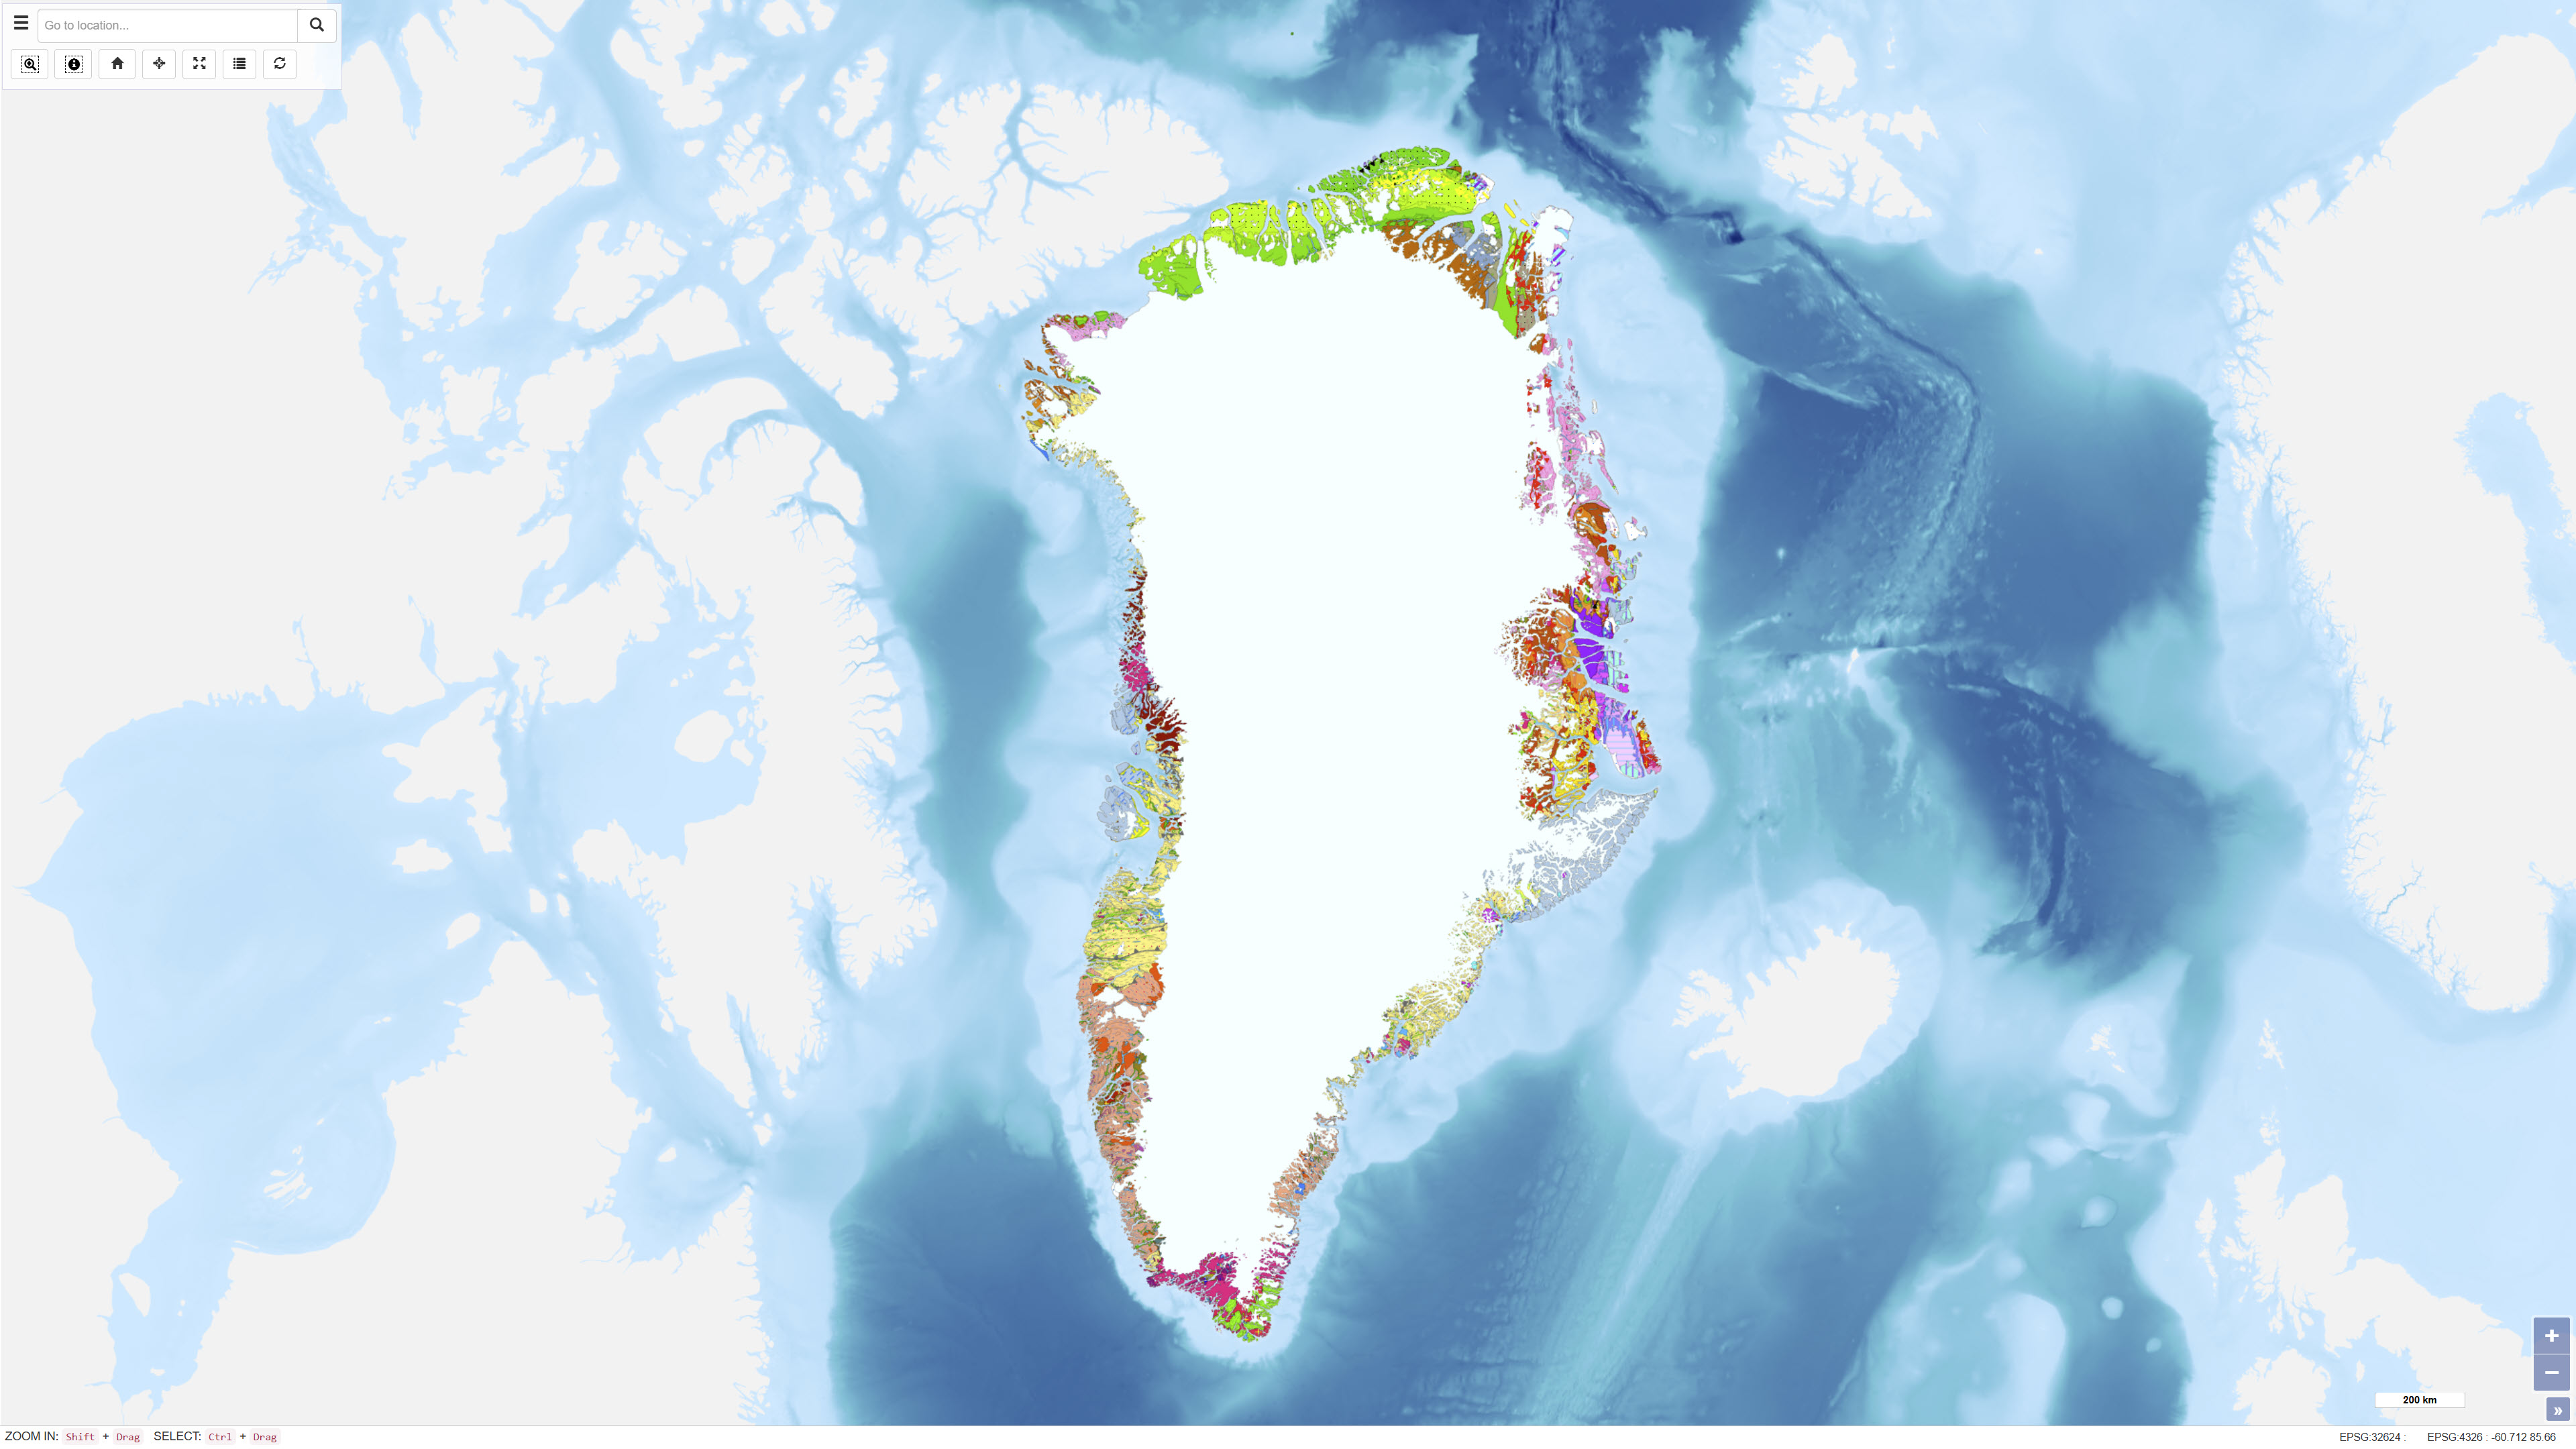
The Geological Map of Greenland at scale 1:2.500.000 provides a comprehensive regional synthesis of the geological evolution of Greenland from the earliest Archaean to the Quaternary. The map presents an integrated overview of Greenland’s geological framework, including Precambrian crystalline basement provinces, major orogenic belts, Phanerozoic sedimentary basins and widespread volcanic provinces. Greenland is characterised by large exposures of continental crust dominated by Archaean and early Proterozoic shield rocks that stabilised as part of the Laurentian shield. Younger geological elements are mainly developed along the margins of the shield, where sedimentation, deformation and magmatic activity reflect successive tectonic regimes through time. The map illustrates the distribution and relationships of these geological units and highlights the structural and stratigraphic architecture of Greenland and adjacent offshore areas. The map integrates onshore and offshore geological information and serves as a regional reference for geological interpretation, research, education and resource-related studies in Greenland.
-
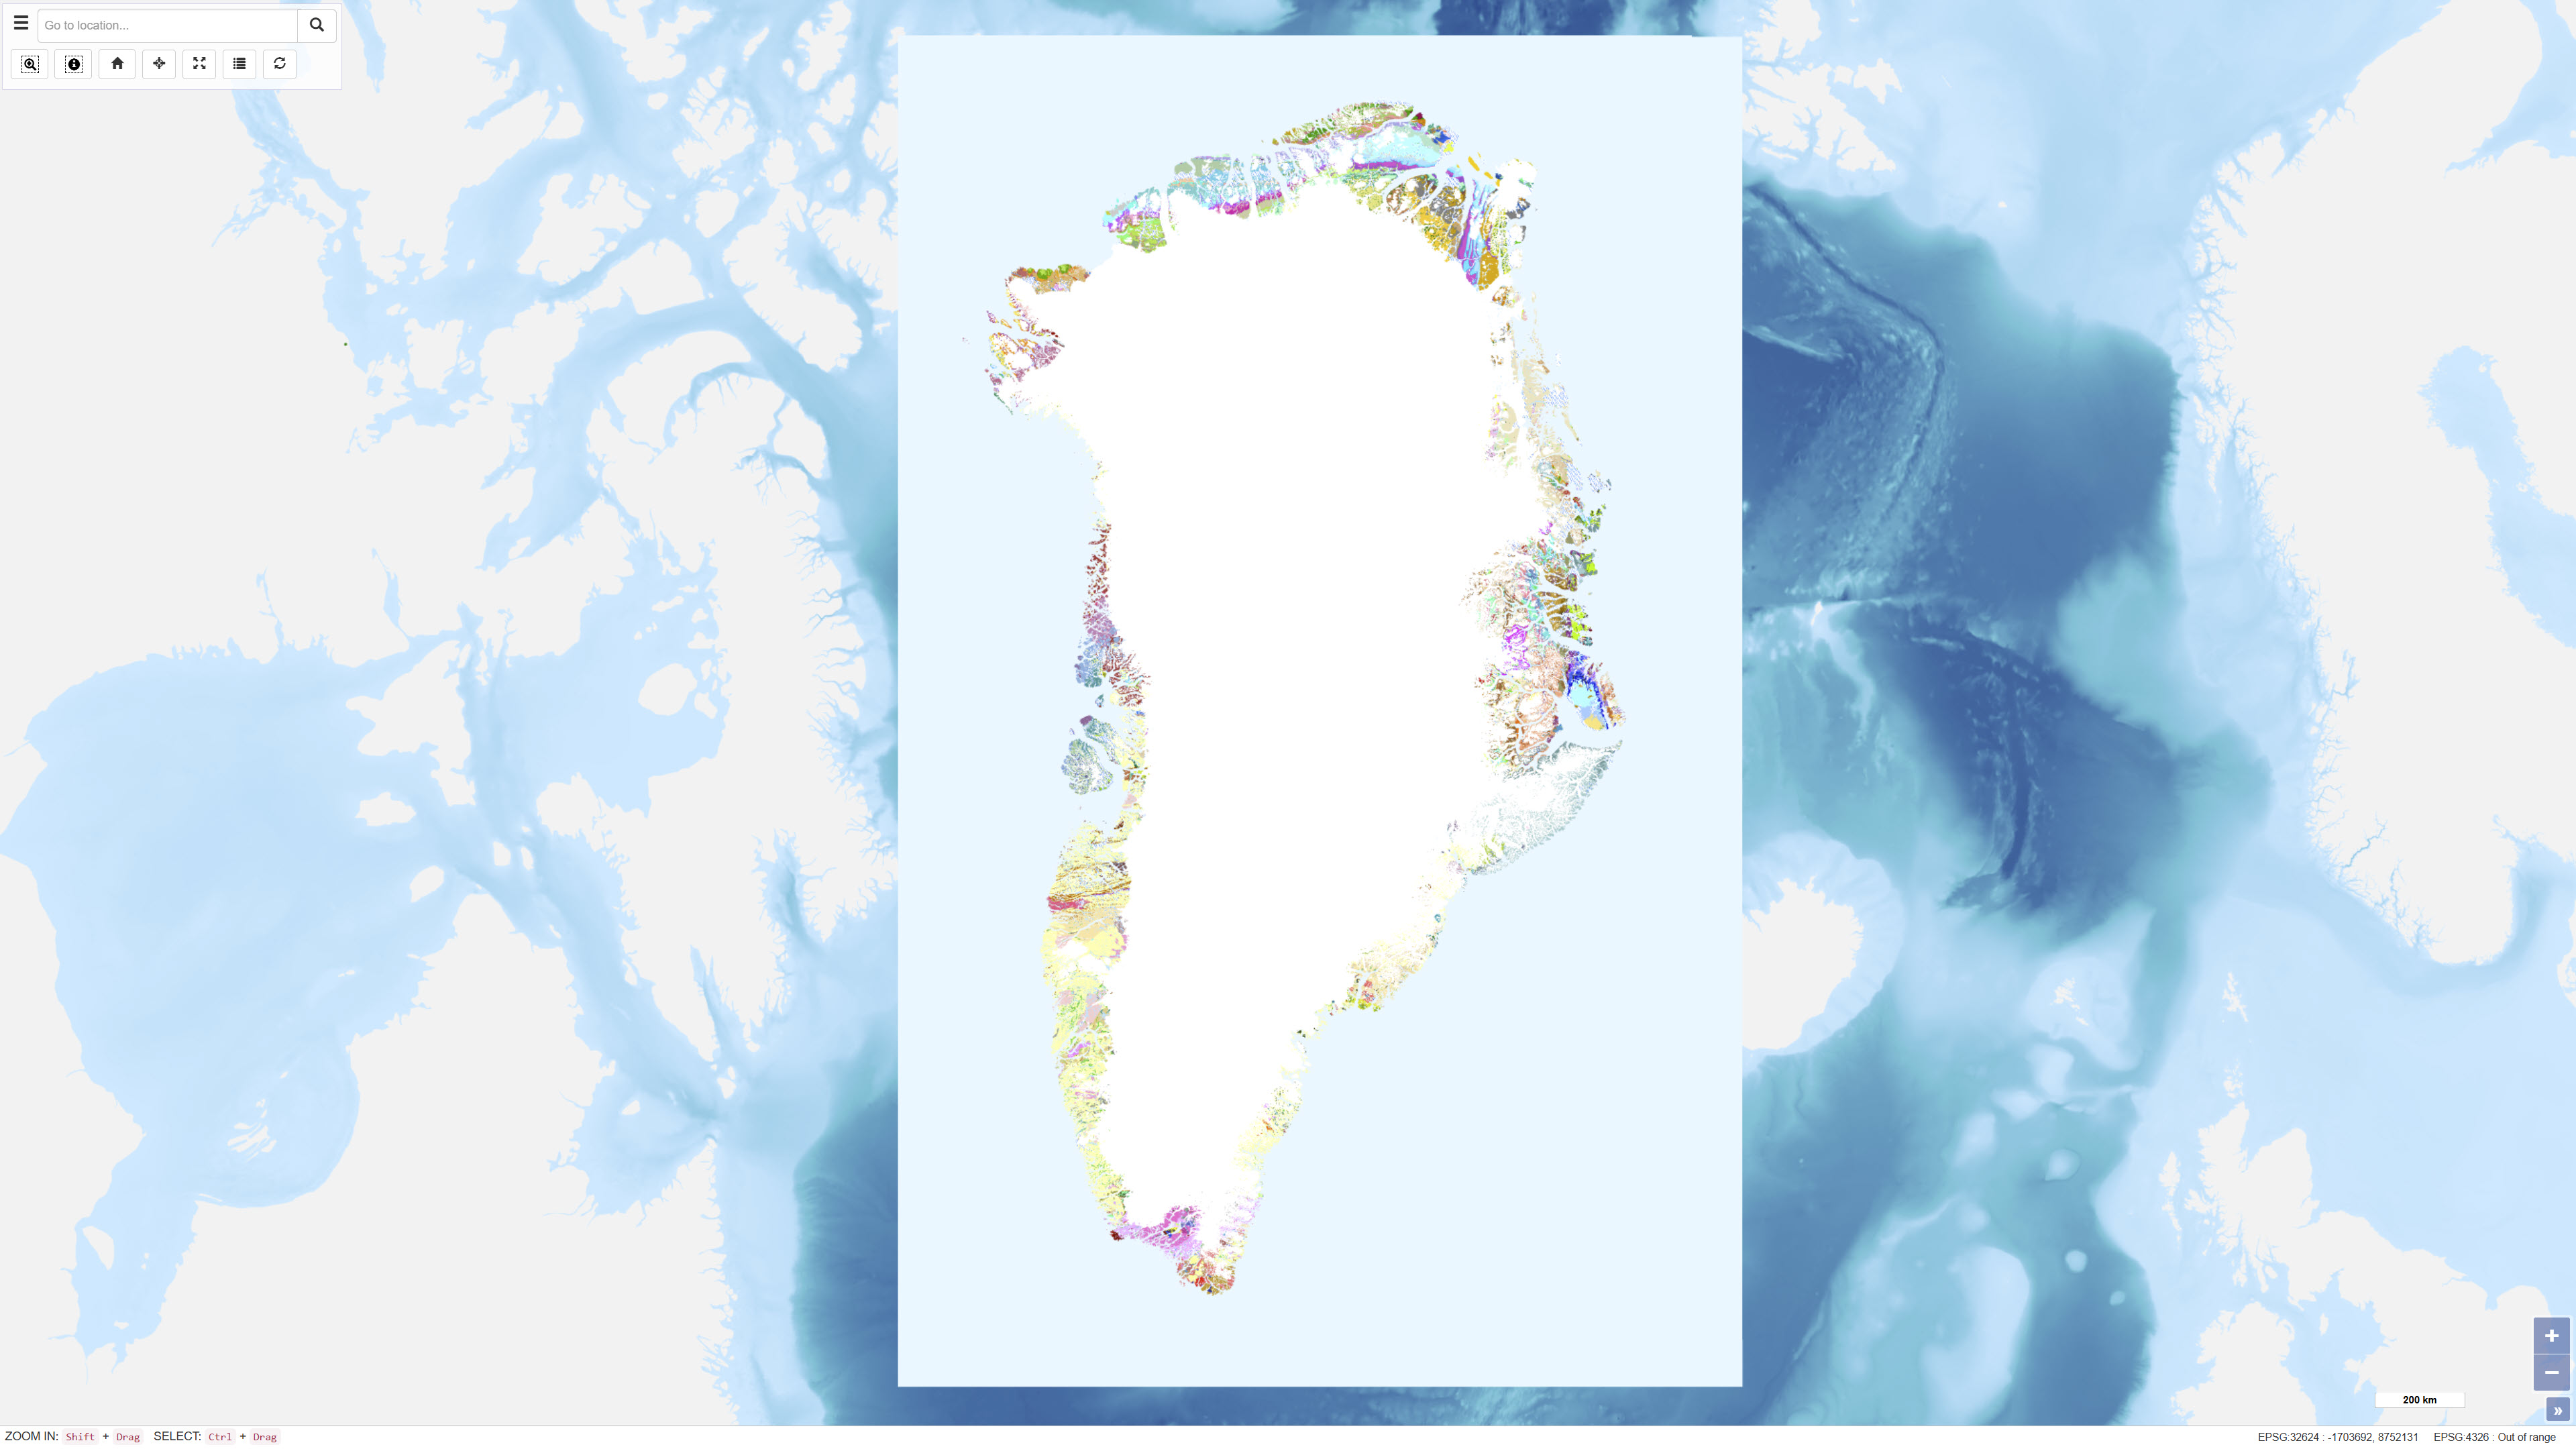
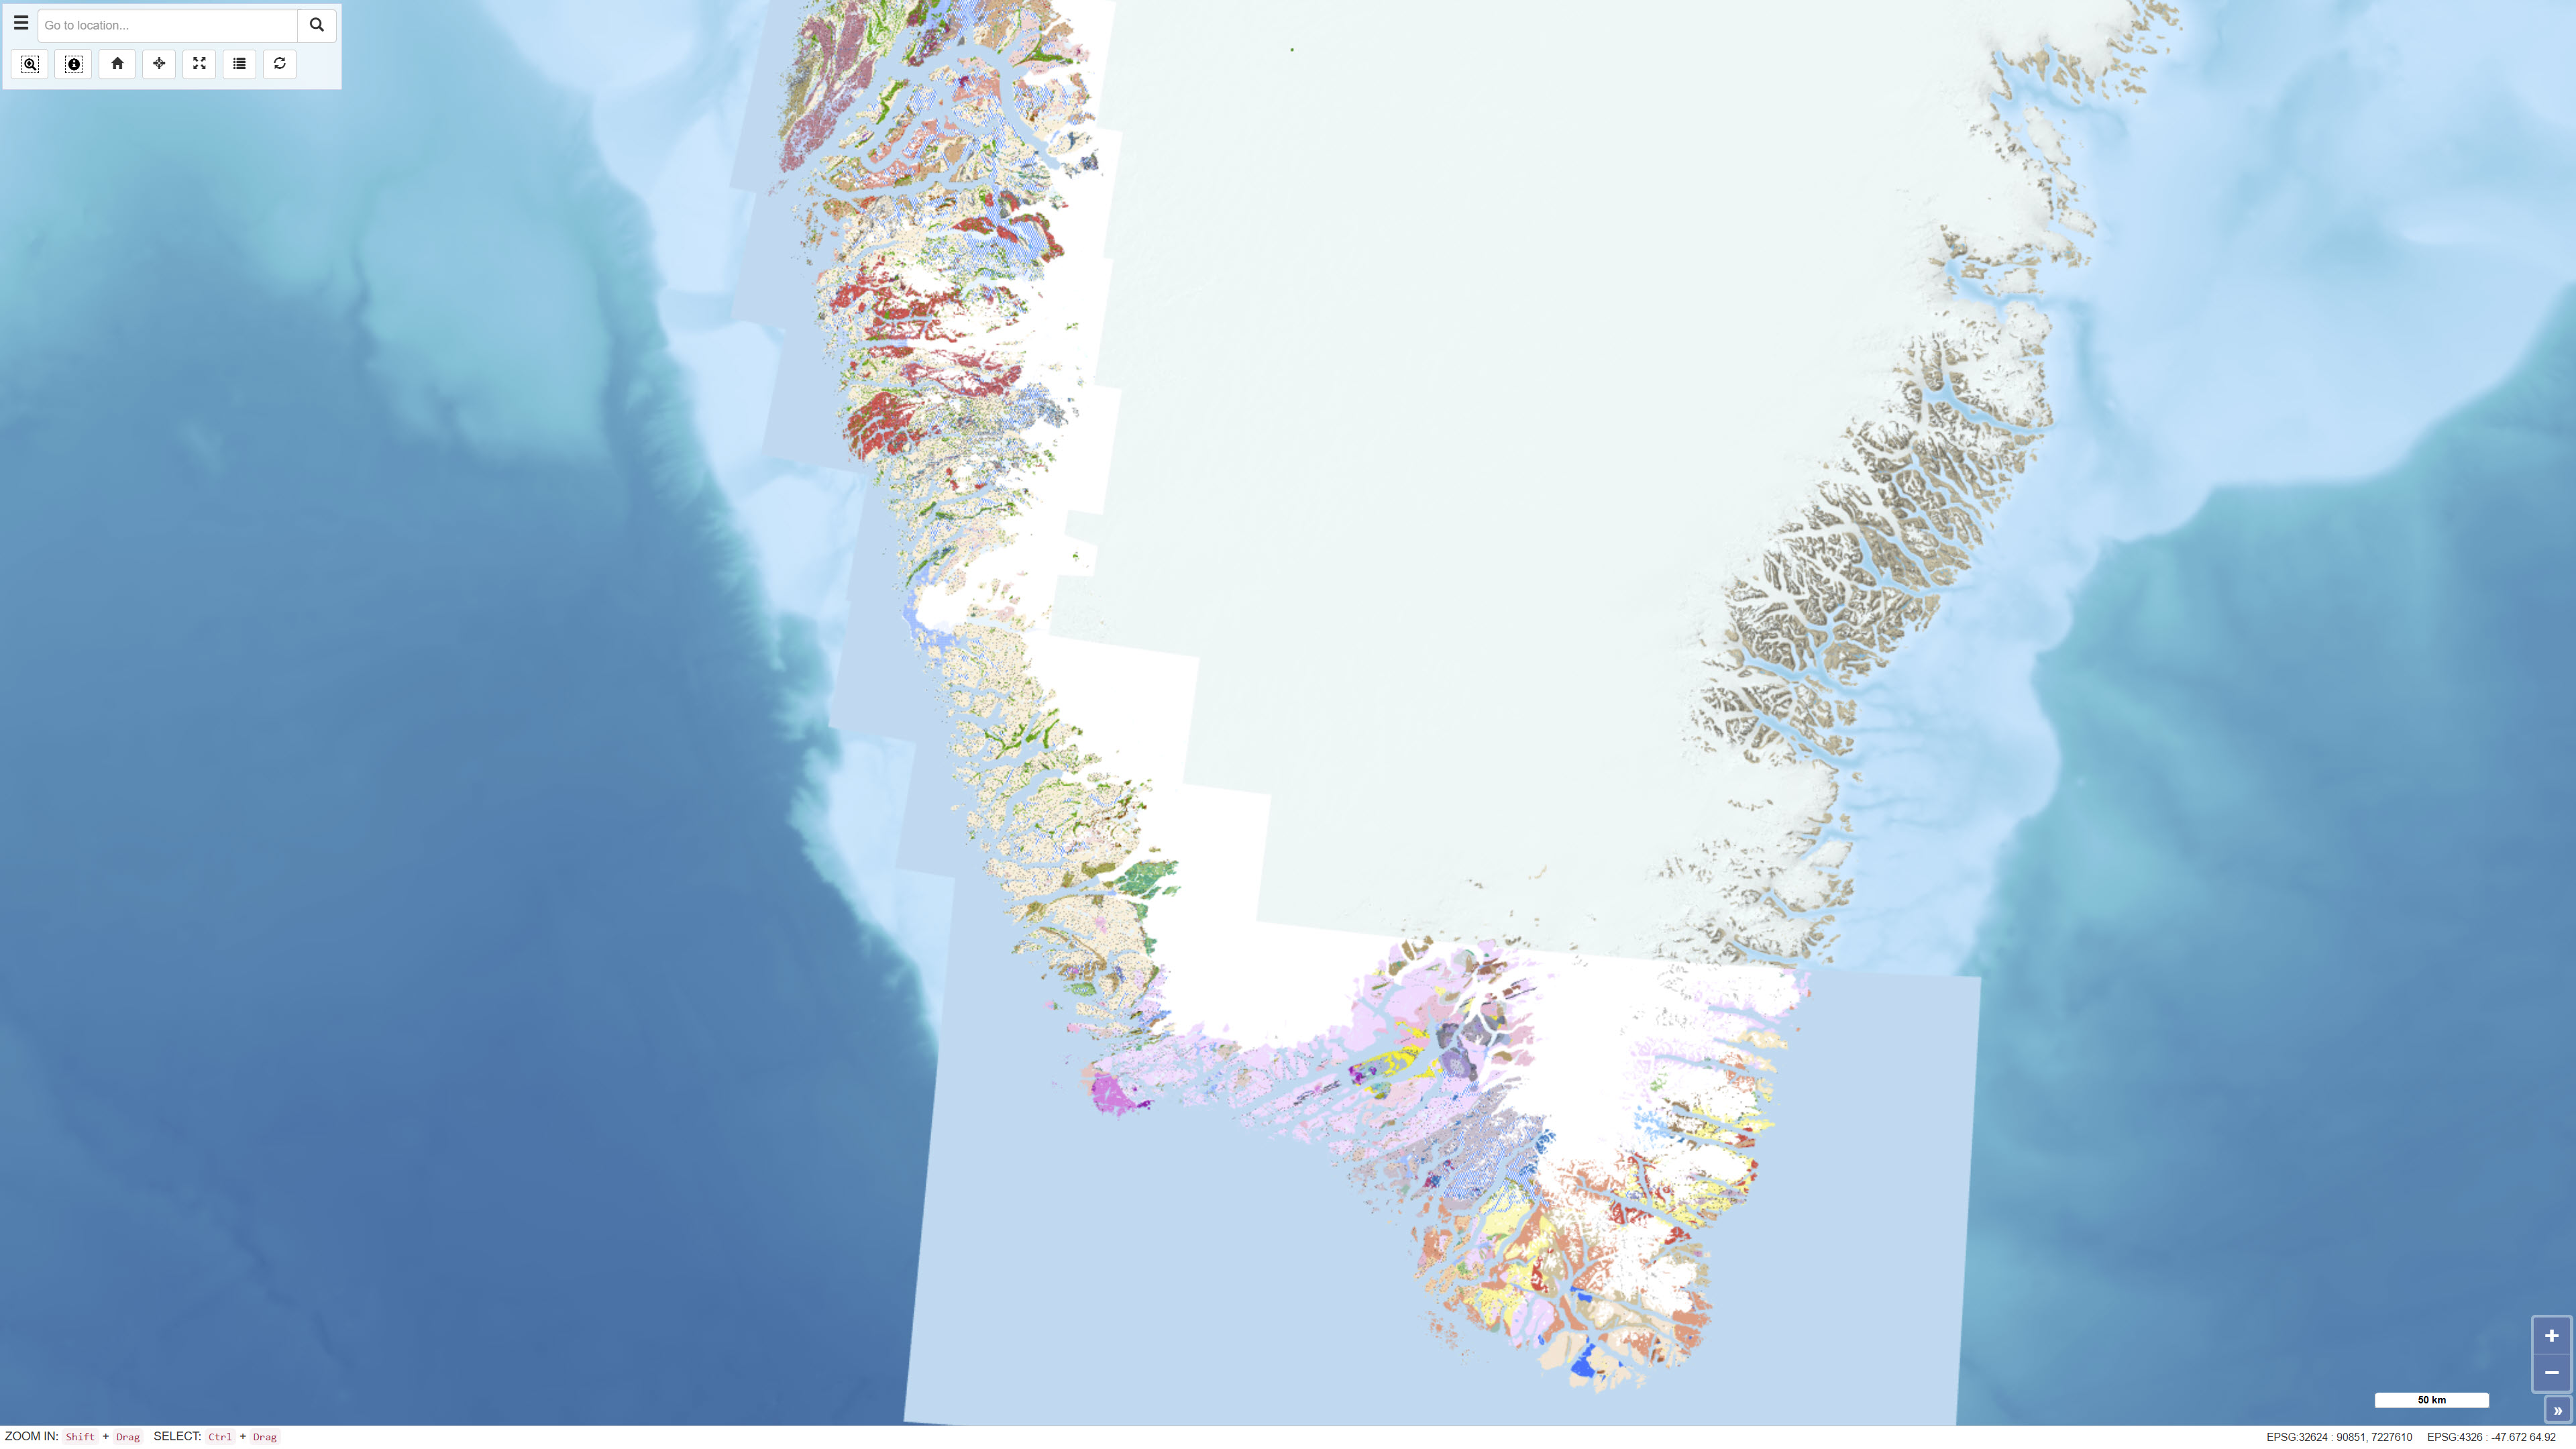
The geological map of Greenland at a scale of 1:500 000 is based on 14 digitised map sheets covering the whole of Greenland, with amendments in specific areas (Pedersen et al. 2013, GEUS Bulletin, DOI: 10.34194/geusb.v28.4727). The original digital version of the map was released through the Greenland Portal in 2012. Continued advances in geological knowledge have necessitated successive revisions in order to keep the map up to date. During the most recent update, a number of geographical areas were revised based on new geological data and interpretations, including parts of West Greenland, North Greenland, North-East Greenland, East Greenland and South-East Greenland. The updated map incorporates revised stratigraphic interpretations and improved representation of geological units and structures. The map has undergone extensive quality control, including complete harmonisation of lineaments and structural elements across map-sheet boundaries. The geological legend is dynamic and reflects the content of the current map view. Geological units are supported by descriptive information, and for most map polygons links are provided to a geological unit database containing further descriptions.
-

The dataset comprises a geological map of the Danish Central Graben at a scale of 1:200,000 presenting regional maps of ‘Base Cretaceous’ and the Cromer Knoll Group. The map was published in 1995 as part of the DGU Map Series no. 49 and was produced as part of a comprehensive geological mapping of the Danish Central Graben. The mapping is based on regional interpretation of seismic data supplemented by information from boreholes. The map covers the Danish part of the Central Graben and parts of the eastern North Sea, and adjacent areas in the Norwegian, British and German sectors are included in order to define regional structural relationships. The map sheet consists of several thematic sub-maps that together describe the structure and stratigraphy of the area.
-
The dataset comprises a geological map of the Danish Central Graben at a scale of 1:200,000 presenting regional maps of the Base Upper Jurassic and the Upper Jurassic. The map was published in 1995 as part of the DGU Map Series no. 50 and was produced as part of a comprehensive geological mapping of the Danish Central Graben. The mapping is based on regional interpretation of seismic data supplemented by information from boreholes. The map covers the Danish part of the Central Graben and parts of the eastern North Sea, and adjacent areas in the Norwegian, British and German sectors are included in order to define regional structural relationships. The map sheet consists of several thematic sub-maps that together describe the structure and stratigraphy of the area.
-
The seamless digital geological map is based on the digitisation and harmonisation of 21 geological map sheets at 1:100 000 scale, originally published by GGU/GEUS between 1966 and 2011. This edition updates and expands the 2019 version, which included 16 sheets, by integrating five additional 1:100 000 sheets and selected information from 1:500 000 scale maps in areas lacking detailed coverage. The map also incorporates a simplified geological interpretation of Bjørneøen and Storeø in Godthåbsfjorden based on detailed mapping by Claus Østergaard (2005). The dataset provides a consistent, seamless geological framework optimised for digital display at the 1:100 000 scale.
-
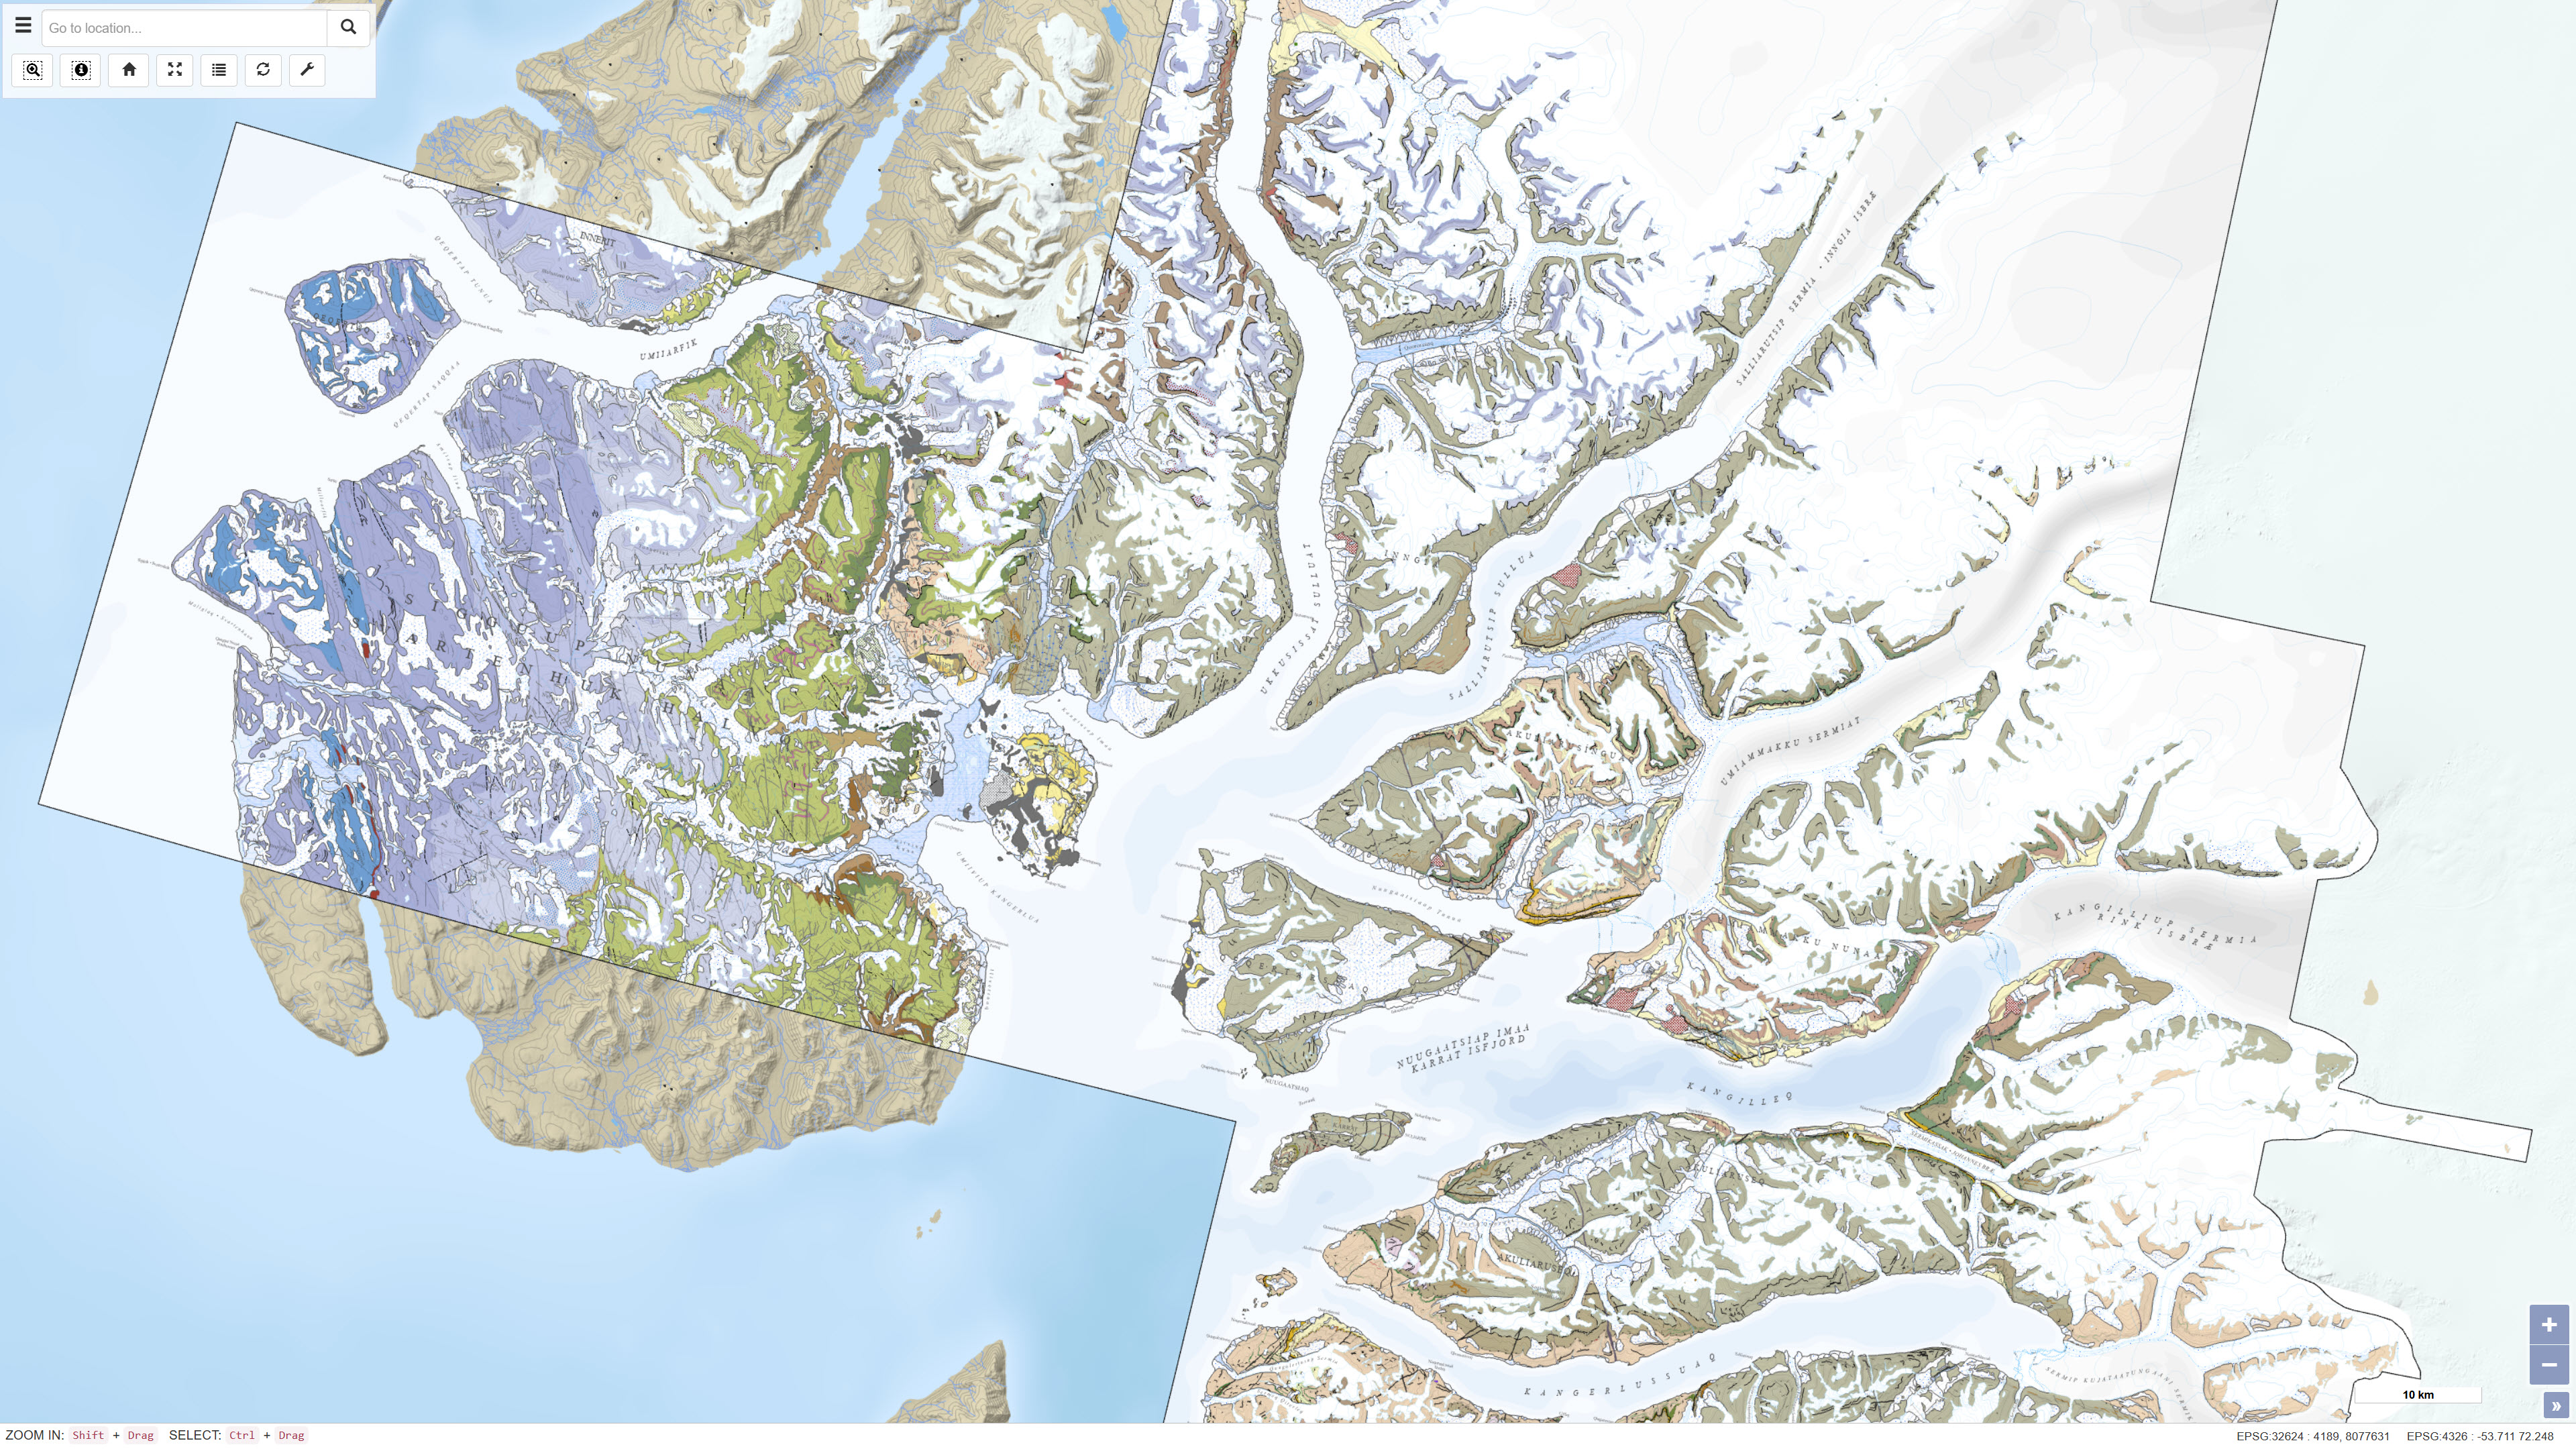
This dataset contains a seamless digital geological map of the Karrat area in central West Greenland based on four geological map sheets at a scale of 1:100 000: Maarmorilik 71 V.2 South, Nuugaatsiaq 71 V.2 North, Pannertooq 72 V.2 South and Svartenhuk 71 V.1 North. Geological mapping was carried out in the fjord regions north of Uummannaq as part of a collaborative project between the Geological Survey of Denmark and Greenland (GEUS) and the Ministry of Mineral Resources and Justice of Greenland. The dataset is based on 3D photogeology using more than 35,000 oblique photographs collected during three field seasons combined with traditional field observations and subsequent geochemical and geochronological analyses. The dataset provides an updated geological understanding of the meta-sedimentary and meta-volcanic rocks of the Karrat Group, the structural evolution of the Rinkian Orogen and the structure of the West Greenland Basalt Group. The dataset supports geological research, regional geological mapping and mineral exploration.
-
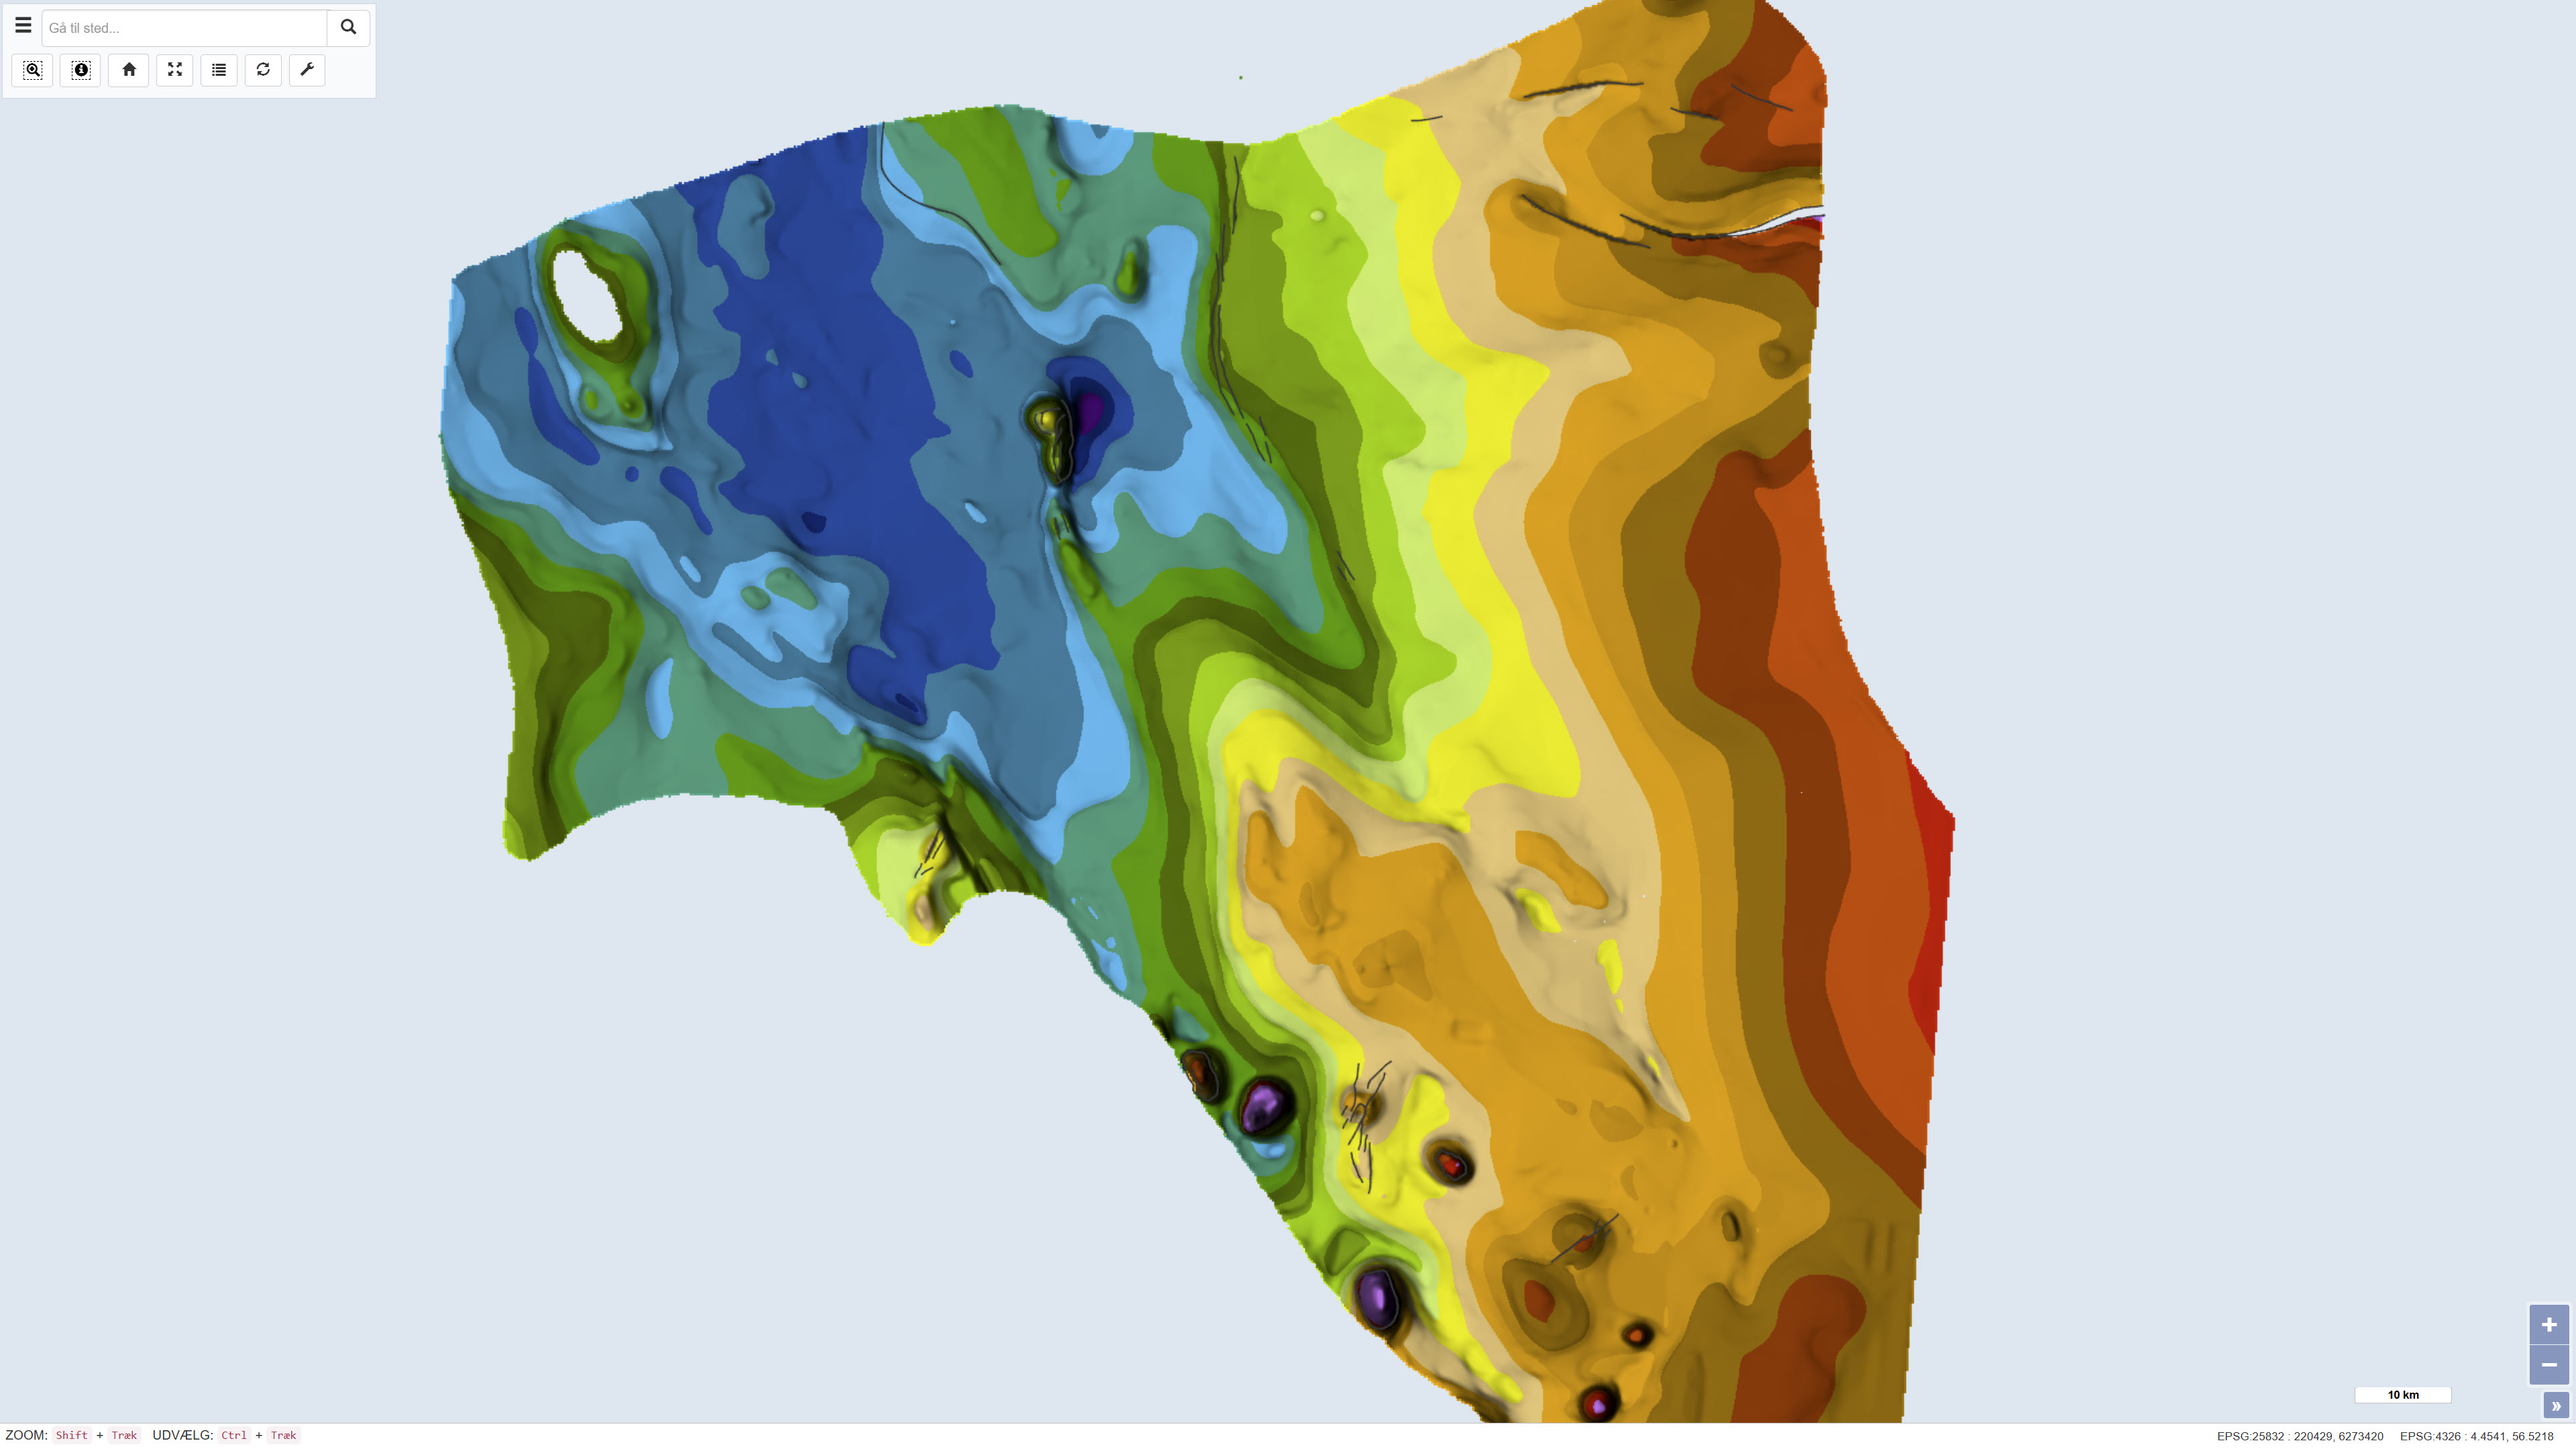
The dataset comprises a geological map of the Danish Central Graben at a scale of 1:200,000 presenting regional maps of ‘Top Chalk’ and the Post-Chalk Group in terms of two-way travel time, depth and interval velocity. The map was published in 1995 as part of the DGU Map Series no. 47 and was produced as part of a comprehensive geological mapping of the Danish Central Graben. The mapping is based on interpretation of seismic data supplemented by information from boreholes. The map covers the Danish part of the Central Graben and parts of the eastern North Sea block, and adjacent areas in the Norwegian, British and German sectors are included where data were available in order to define regional structural relationships. The map sheet comprises several thematic sub-maps that together describe regional variations in structure and stratigraphy.
-
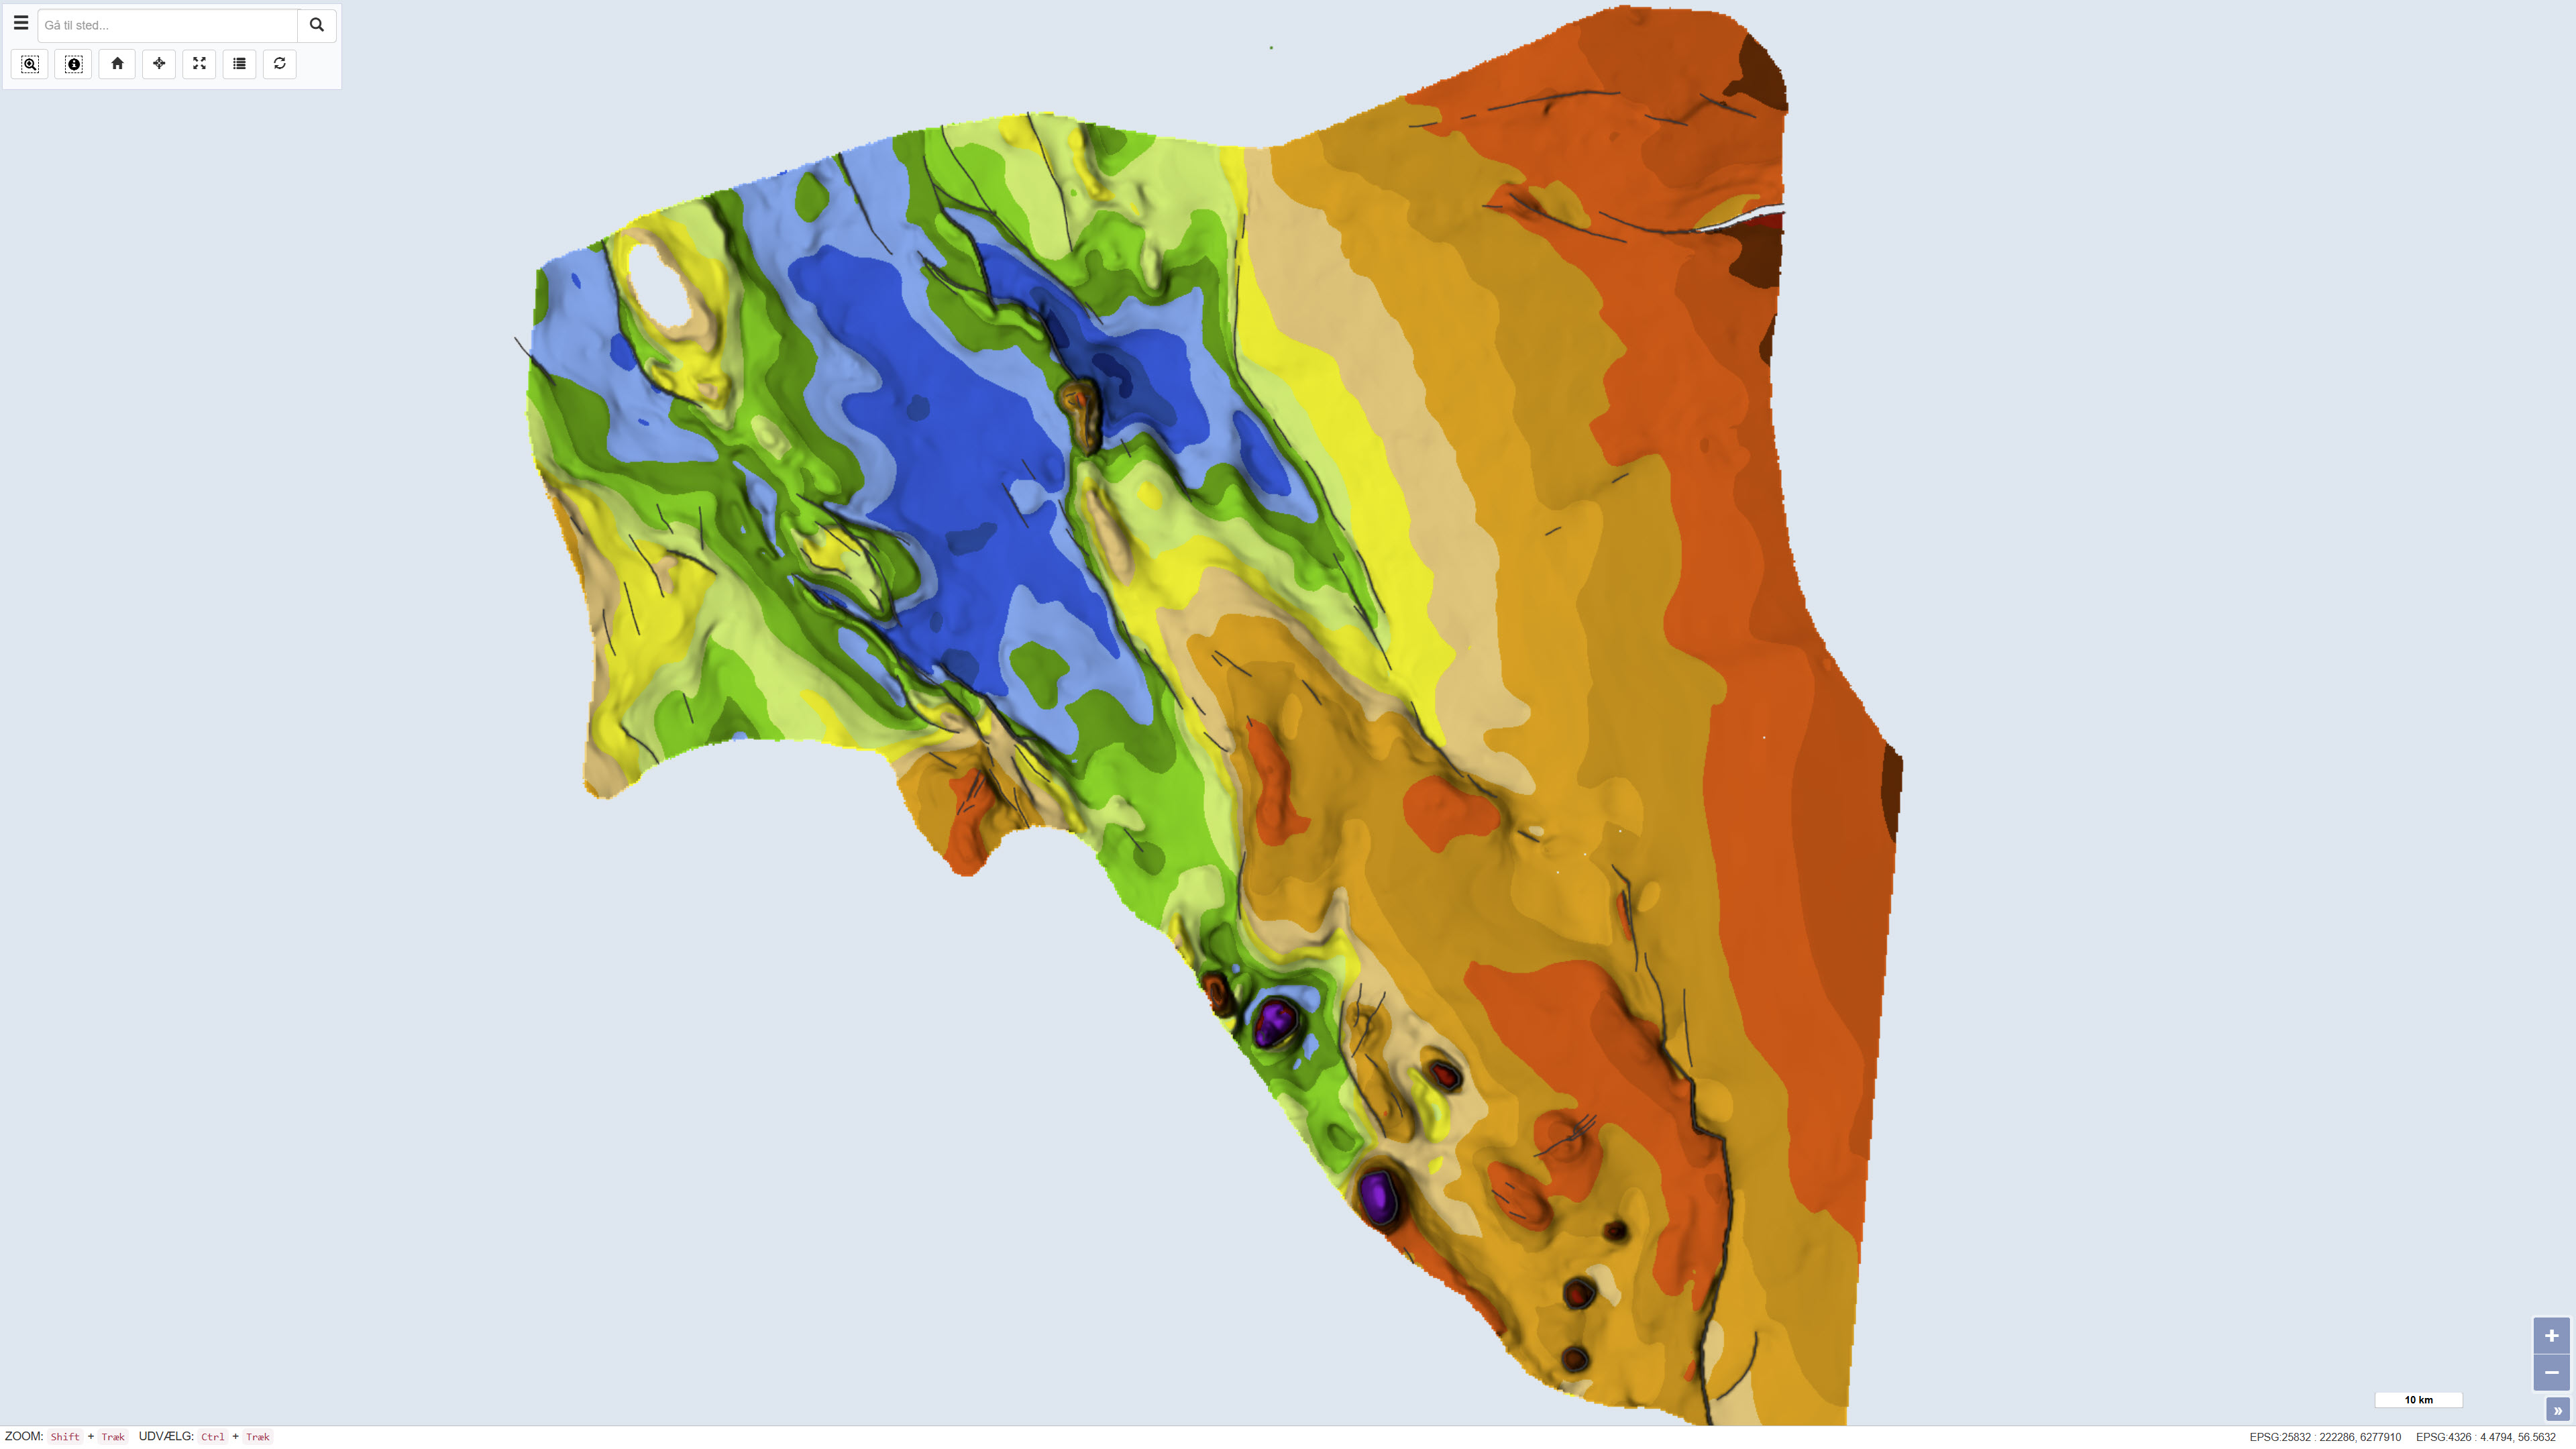
The dataset comprises a geological map of the Danish Central Graben at a scale of 1:200,000 presenting regional maps of ‘Base Chalk’ and the Chalk Group in terms of two-way travel time, depth, interval velocity and vertical thickness (isochore). The map was published in 1995 as part of the DGU Map Series no. 48 and was produced as part of a comprehensive geological mapping of the Danish Central Graben. The mapping is based on regional interpretation of seismic data supplemented by information from boreholes. The map covers the Danish part of the Central Graben and parts of the eastern North Sea, and adjacent areas in the Norwegian, British and German sectors are included in order to define regional structural relationships. The map sheet consists of several thematic sub-maps that together describe the structure and stratigraphy of the area.
-

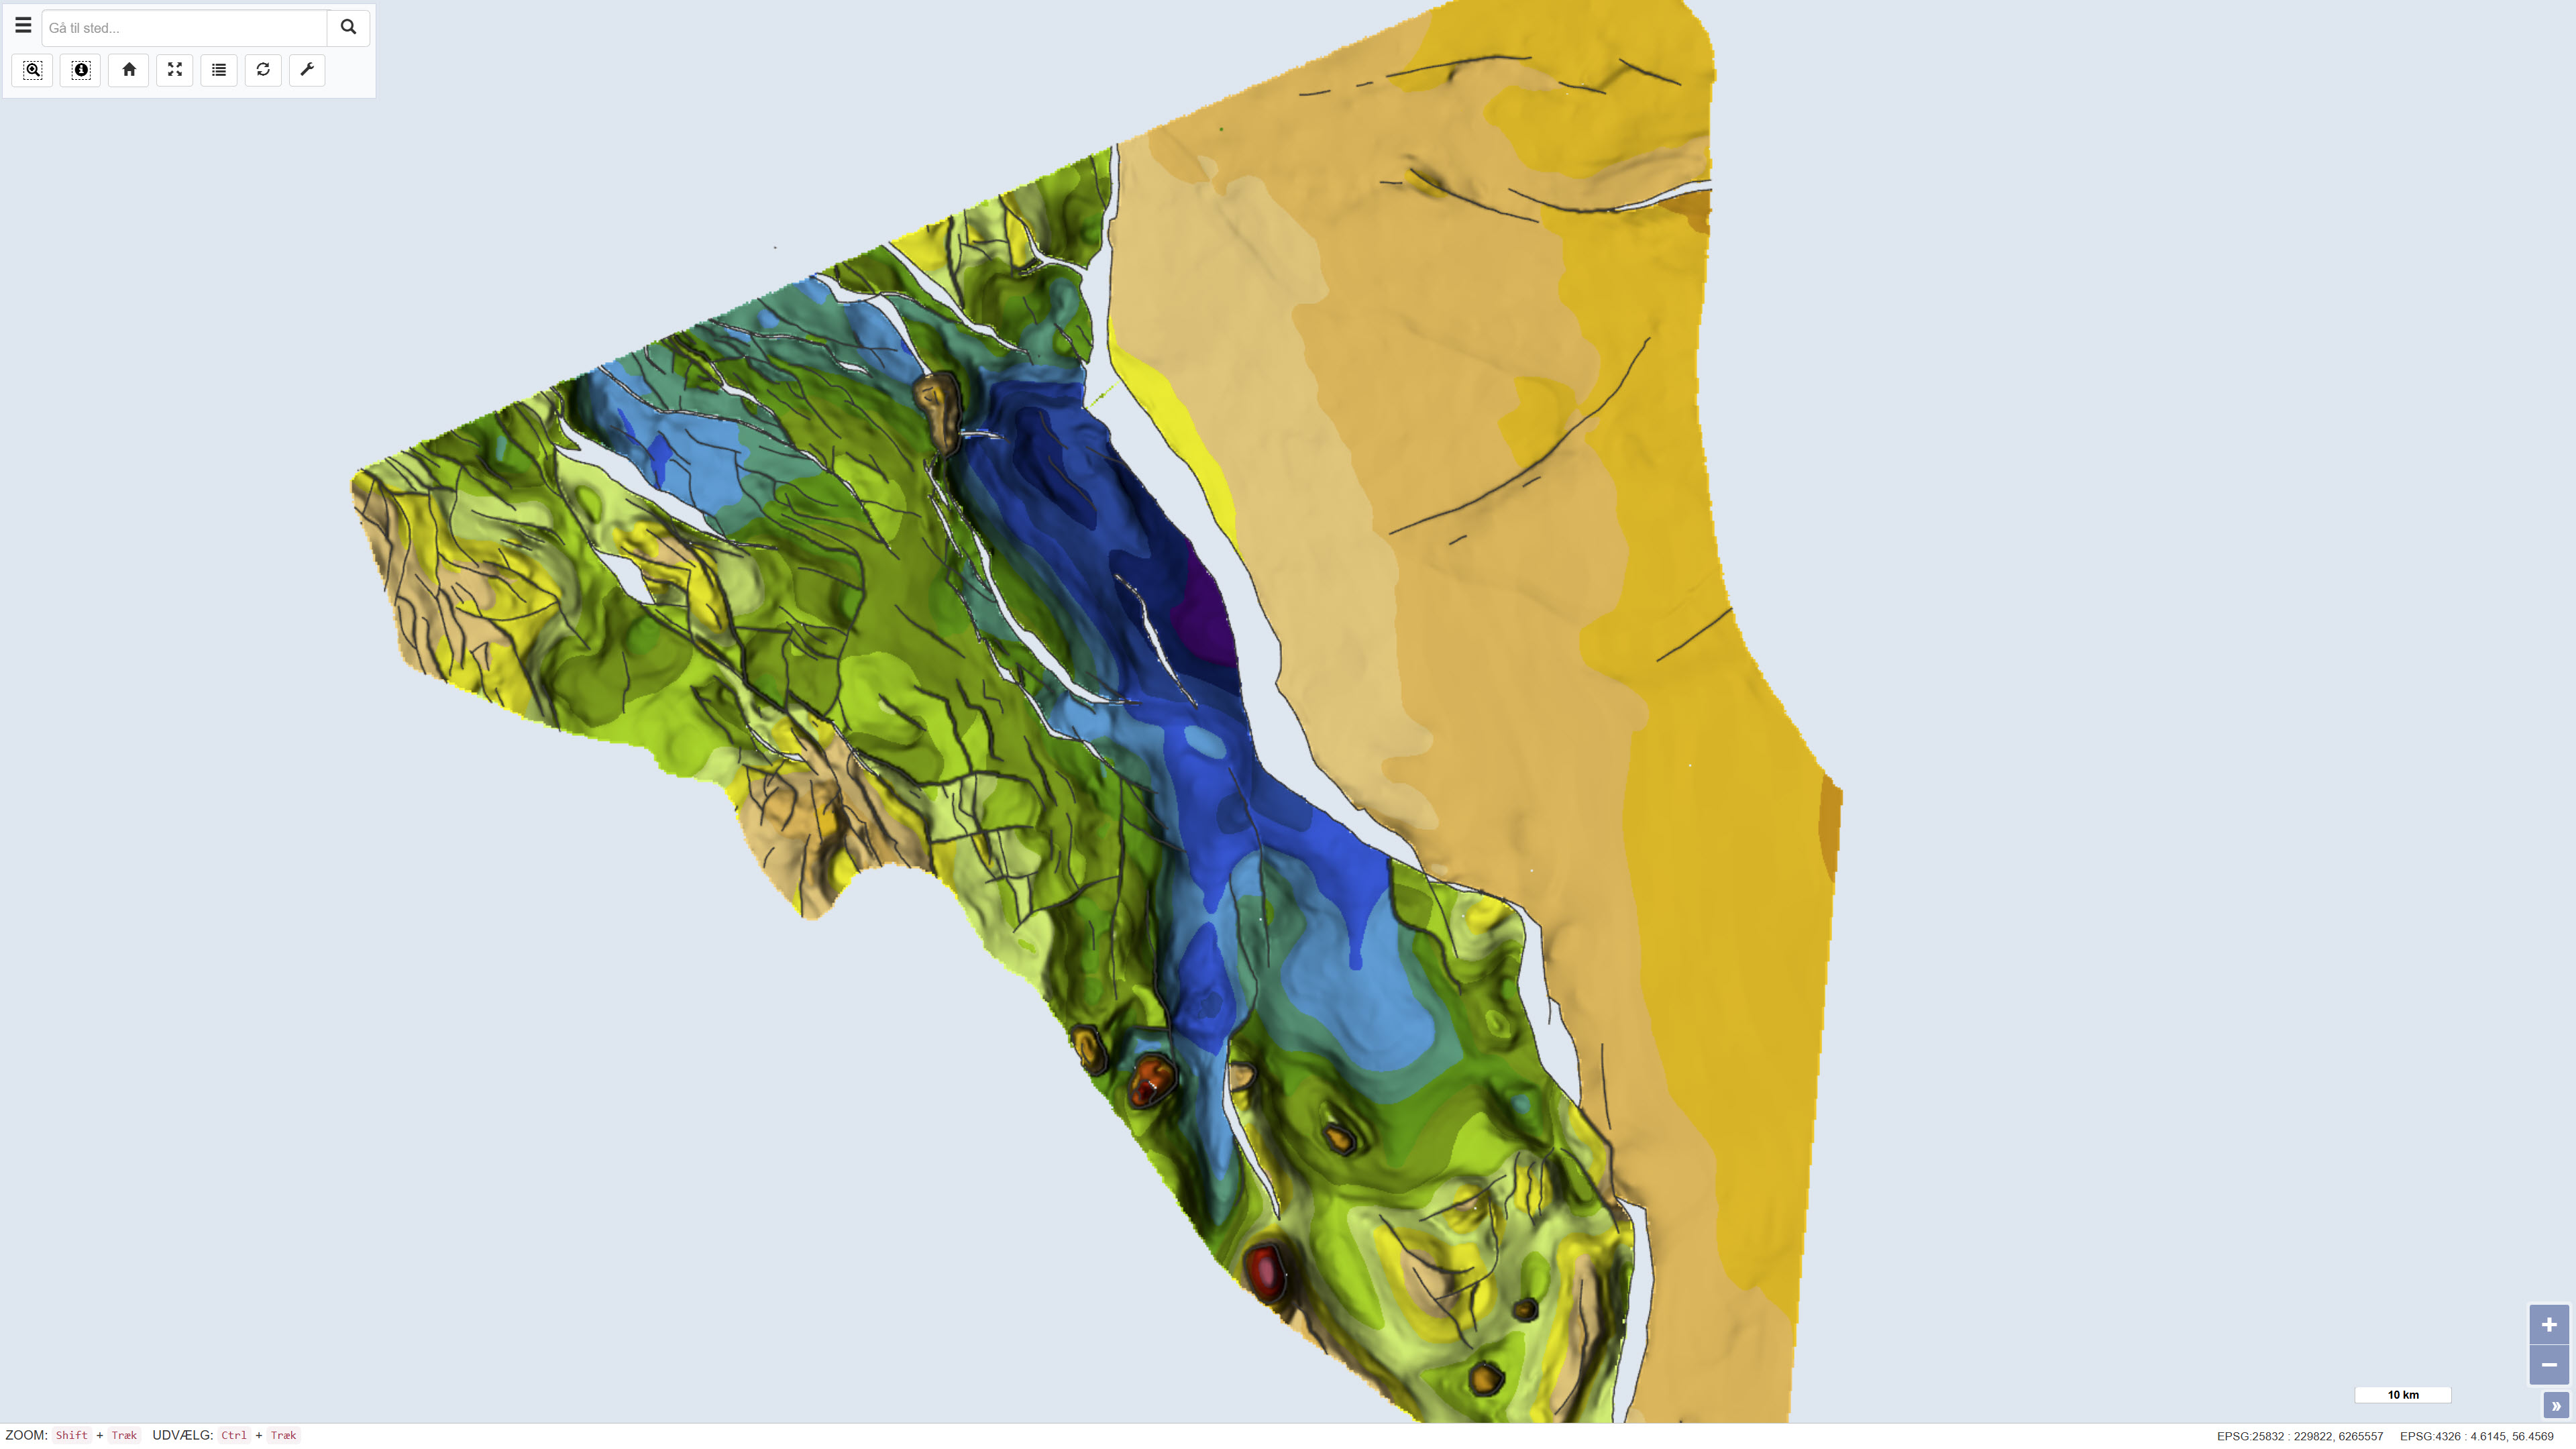
Description of the submarine morphology and characteristics of the sediments (lithology, grain size, mineralogy, and chemistry) of the Saguenay fjord, the lower Estuary and Gulf of St. Lawrence. The layer contains a synthesis of geological and geochemical data collected and interpreted over 10 years and is accompanied by detailed bathymetric and surface sediment maps. Most of this study deals with the geomorphology, surface sediments (lithology, mineralogy, and chemistry), and present depositional conditions, but several studies have also been made of the bedrock geology and the stratigraphy of the unconsolidated sediments. Purpose These studies are regional and of a reconnaissance nature in the sense that they have been designed to obtain acoustical and sampling data on the morphology and basic properties of the sediments from the whole Gulf. This approach was used to provide a broad appraisal of the sedimentary environment of the Gulf and its late-glacial and postglacial history. Additional Information Unknown date of numeric version. Acoustical and sampling data were obtained in the River and Gulf of St. Lawrence on board of different boats over the years. Sounding lines and sample stations were selected initially on the basis of submarine morphology and later in combination with a preliminary sedimentological map as the sea floor data accumulated. More specifically, acoustical data on the topography and nature of the sea floor was obtained from echosounding and continuous seismic profiling. Sounding records were studied, interpreted, and reduced manually in most cases to a scale suitable for plotting and presentation. The information on the continuous seismic records was first interpreted visually and the reduced to constant scale with the aid of a pantograph with independently vertical and horizontal scales. Also, about 1500 sediments samples have been collected from various parts of the Gulf to obtain a regional coverage of the sedimentary environment in the area. The sediment sample were sorted and split after their water content had been determined. Mineralogical analyses were carried out after separation into a heavy and light fraction. The light minerals were identified by a combined method of staining and the use of immersion liquids. For more details on consulted documents and their limit, see the following report: Loring, D. H., and D. J. G. Nota. 1973. Morphology and sediments of the Gulf of St. Lawrence. Bull. Fish. Res. Bd. Can. 182. 147 p. + 7 charts.