 Arctic SDI catalogue
De Nationale Geologiske Undersøgelser for Danmark og Grønland (GEUS)
Type of resources
Available actions
Topics
Keywords
Contact for the resource
Provided by
Years
Formats
Representation types
Update frequencies
status
Scale
-
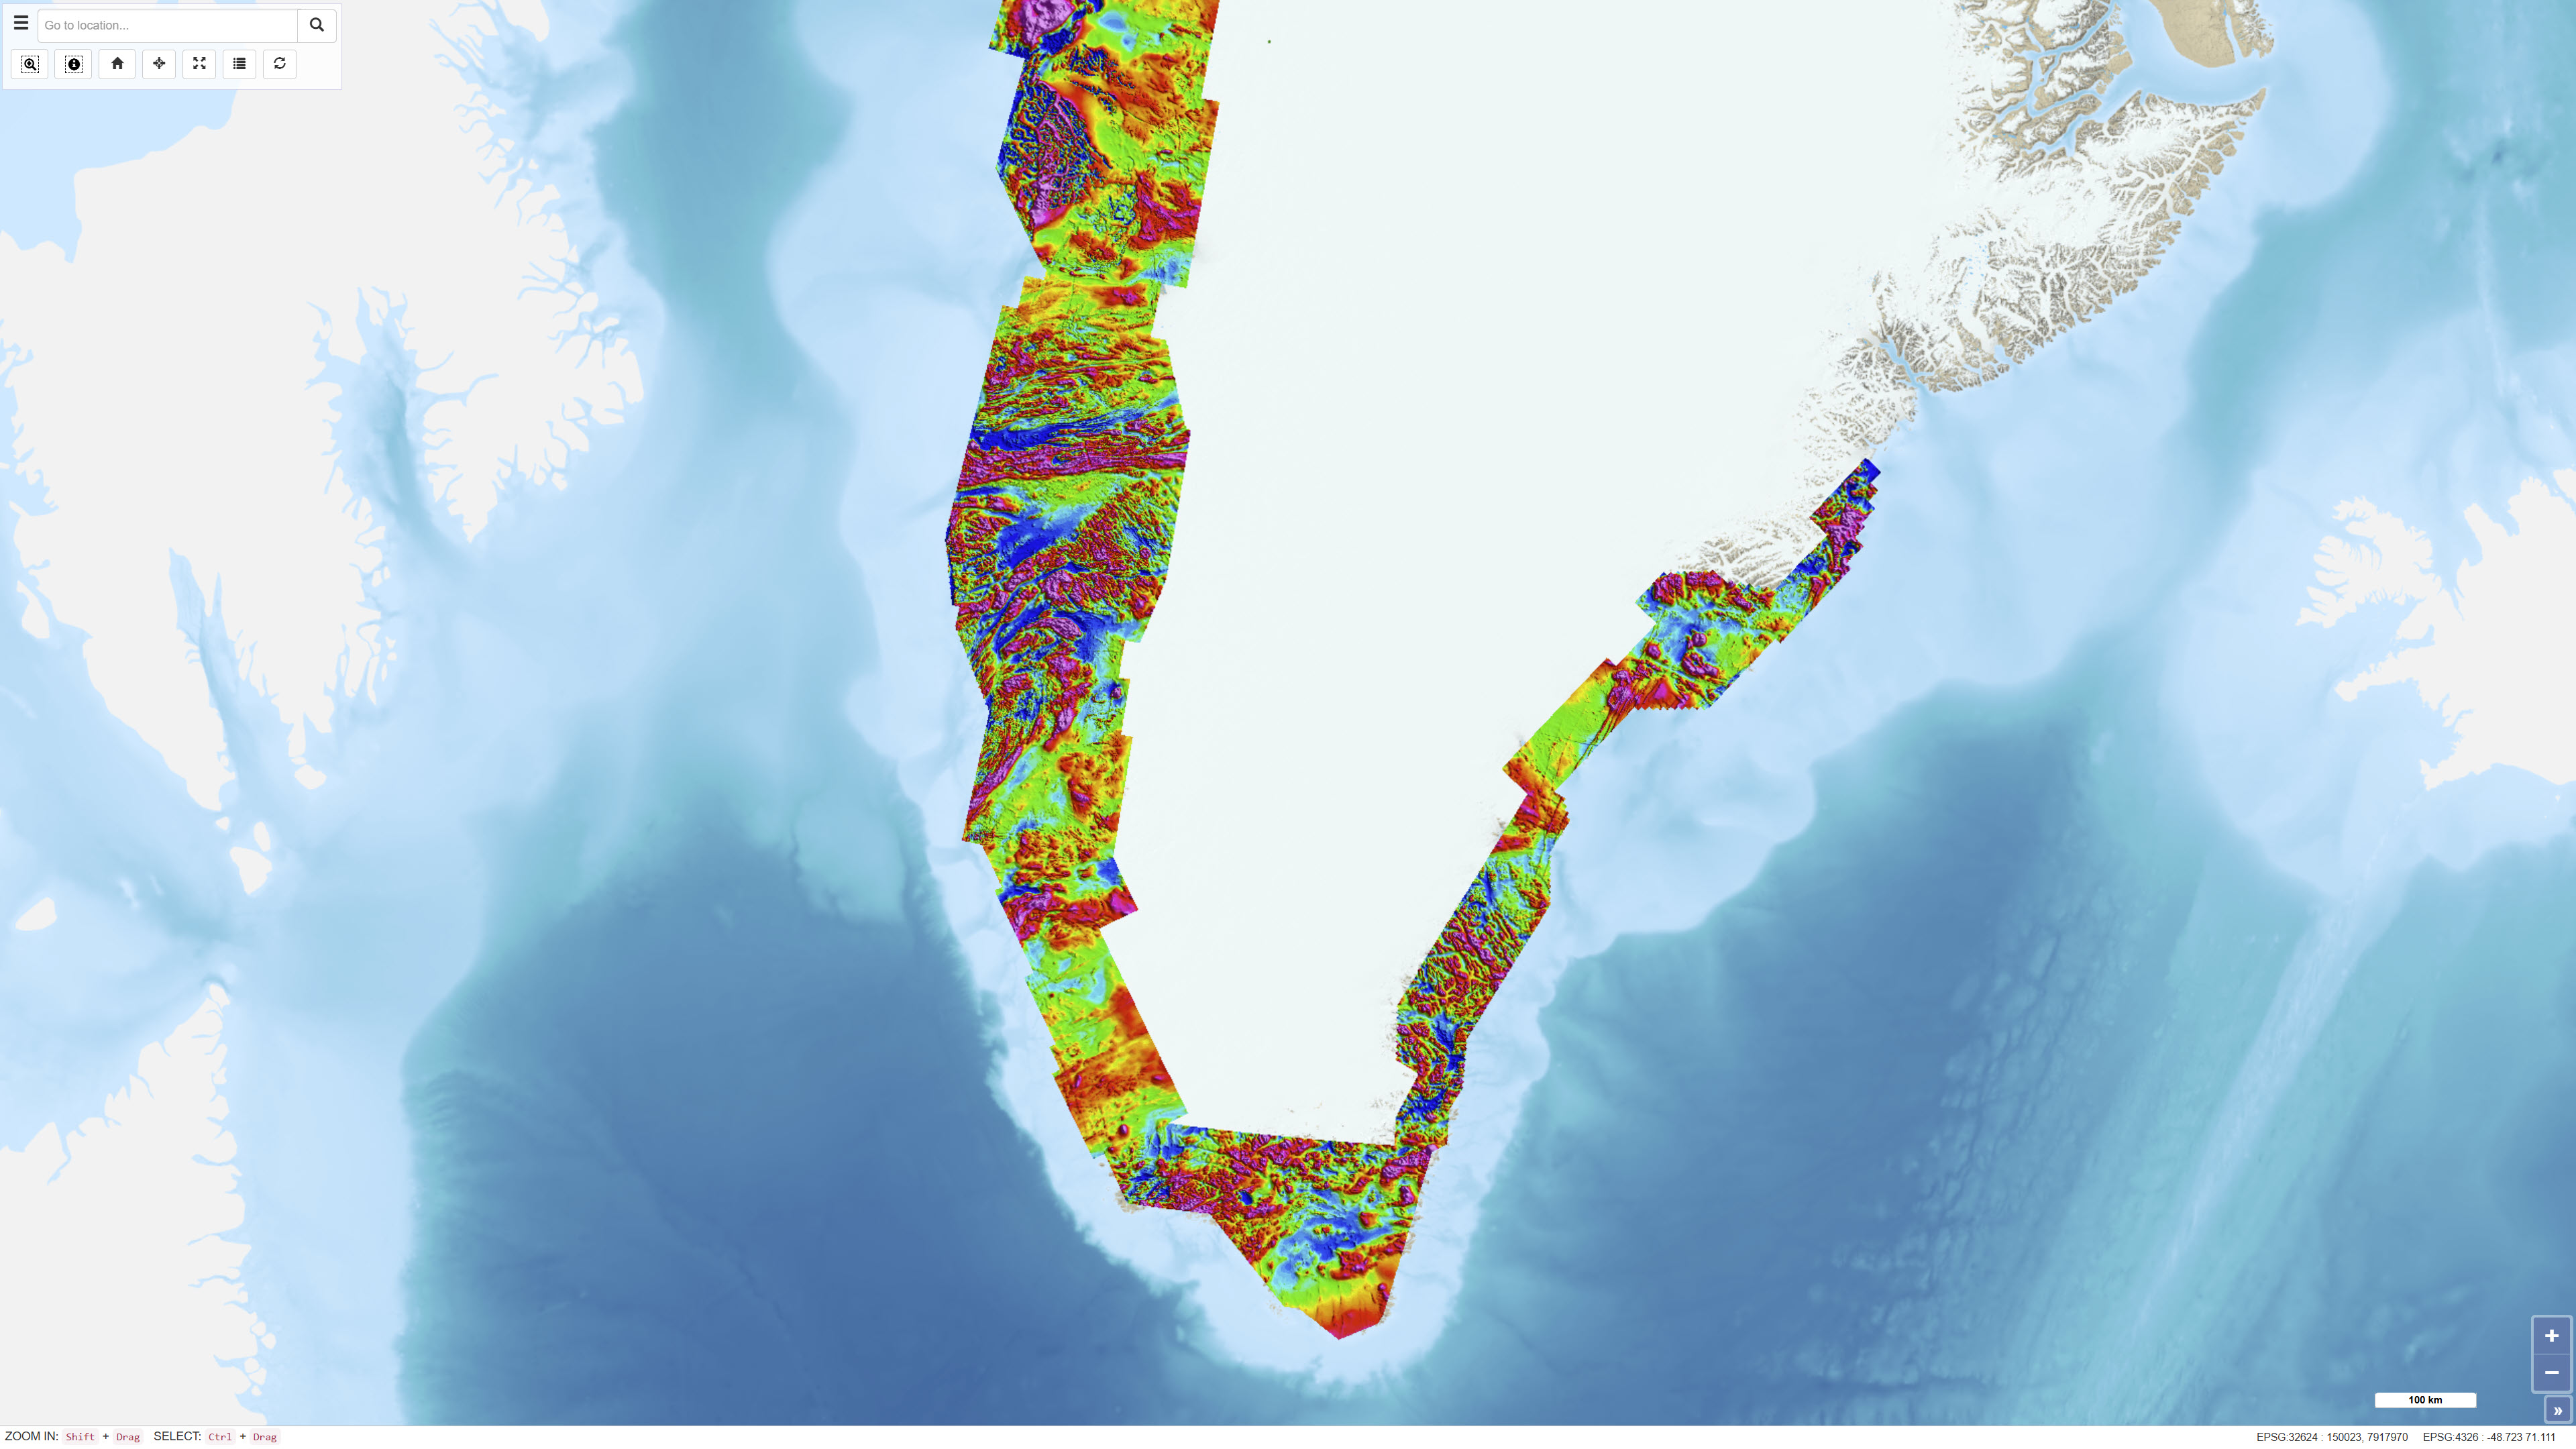
The Regional AEROMAG 1992–2013 Surveys comprise a compilation of high-resolution airborne magnetic surveys acquired by GGU/GEUS between 1993 and 2013 and financed by the Government of Greenland. The overlapping surveys cover approximately 300,000 km² and include the total ice-free onshore areas and near-coastal offshore regions of West Greenland, South Greenland and southern East Greenland. All surveys were acquired using aircraft with similar flight parameters, including line spacings of 500–1,000 m and cross-line spacing of approximately 5,000 m, and with flight altitudes of about 300 m above ground level or seafloor along gently draped surfaces. These consistent acquisition parameters allow the individual surveys to be integrated into a coherent, high-quality regional magnetic data compilation. The total magnetic anomaly map was generated by merging grids from separately processed datasets using the grid-knitting module in Oasis Montaj. The data are IGRF-corrected but not reduced to the pole, and the crustal magnetic field model MF7 was used as a regional reference grid during compilation.
-
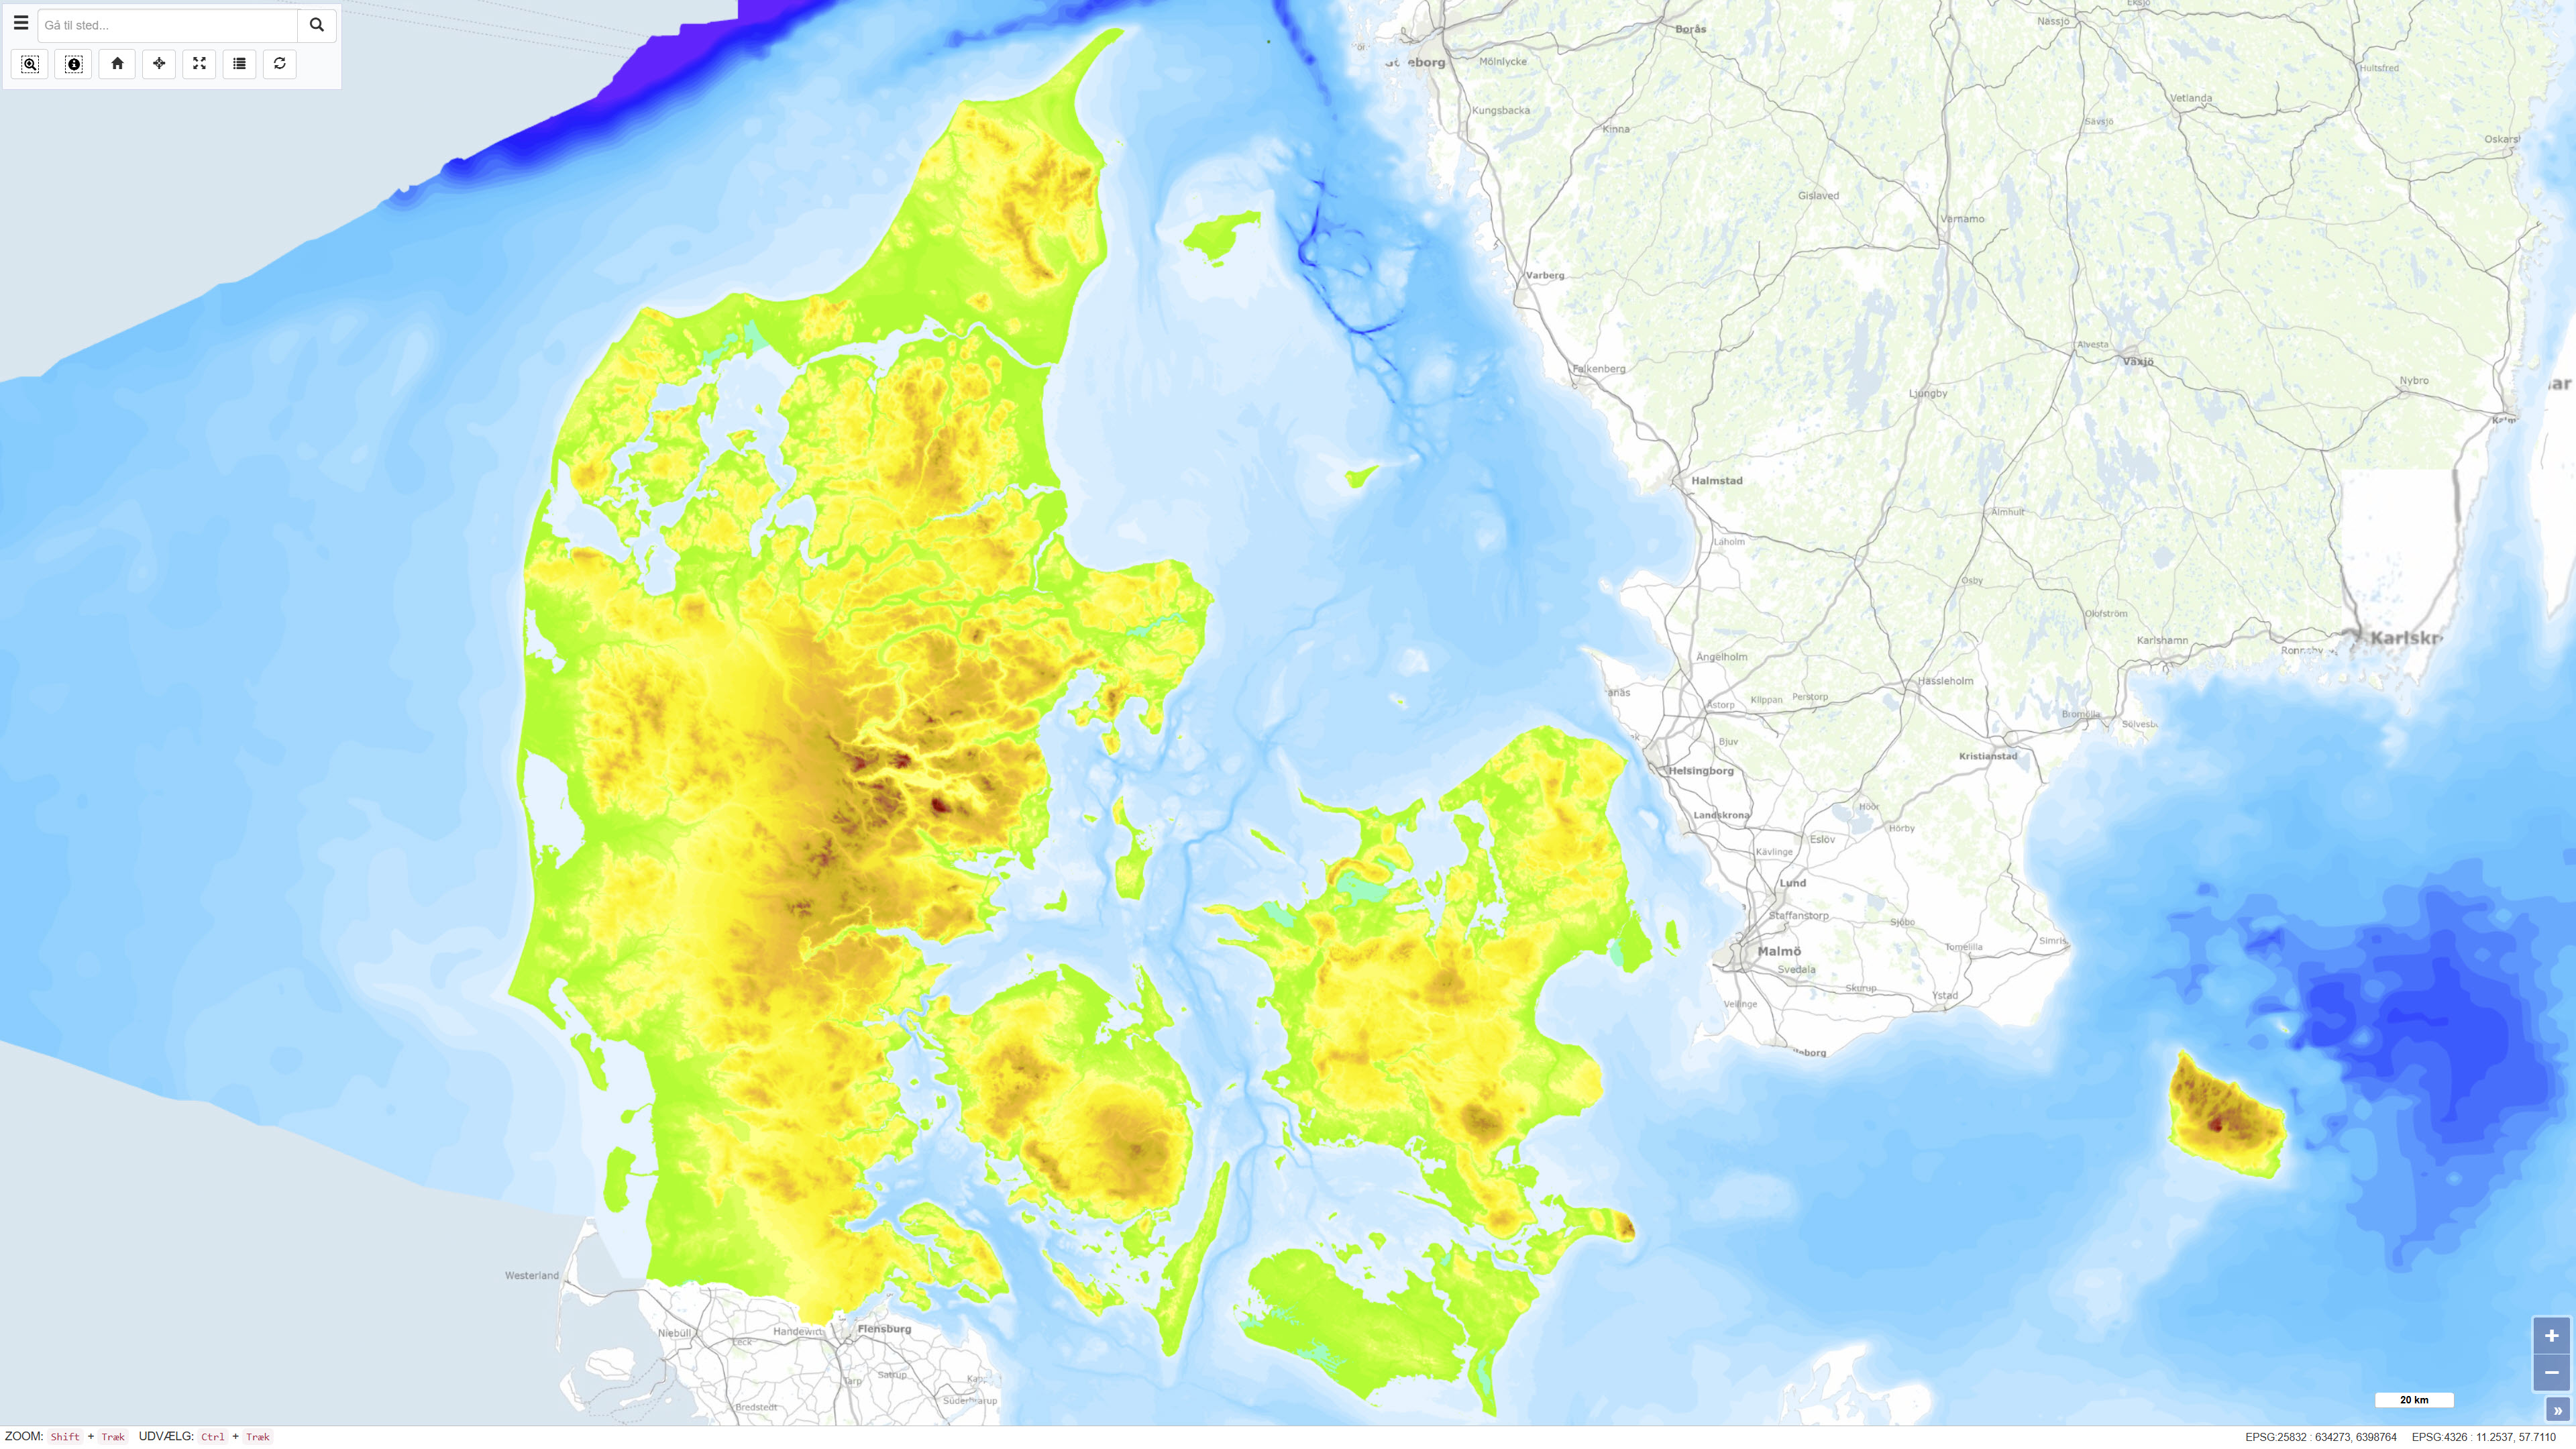
The Height and Depth Map of Denmark is a coherent map showing both land elevation above sea level and sea depth within the Danish area. The map is based on elevation and bathymetric data represented by 5-metre contour intervals closed to polygons and provides continuous coverage across the land–sea boundary. The dataset offers an integrated overview of terrain and bathymetry in Denmark and surrounding waters. The terrestrial elevation component is derived from topographic data suitable for use at scales down to approximately 1:25.000, while the bathymetric component is compiled from datasets of varying origin and resolution. The map was originally assembled around 1997, with subsequent updates to the Danish land areas carried out during 2005–2006. The dataset is primarily intended for regional visualisation and analysis.
-
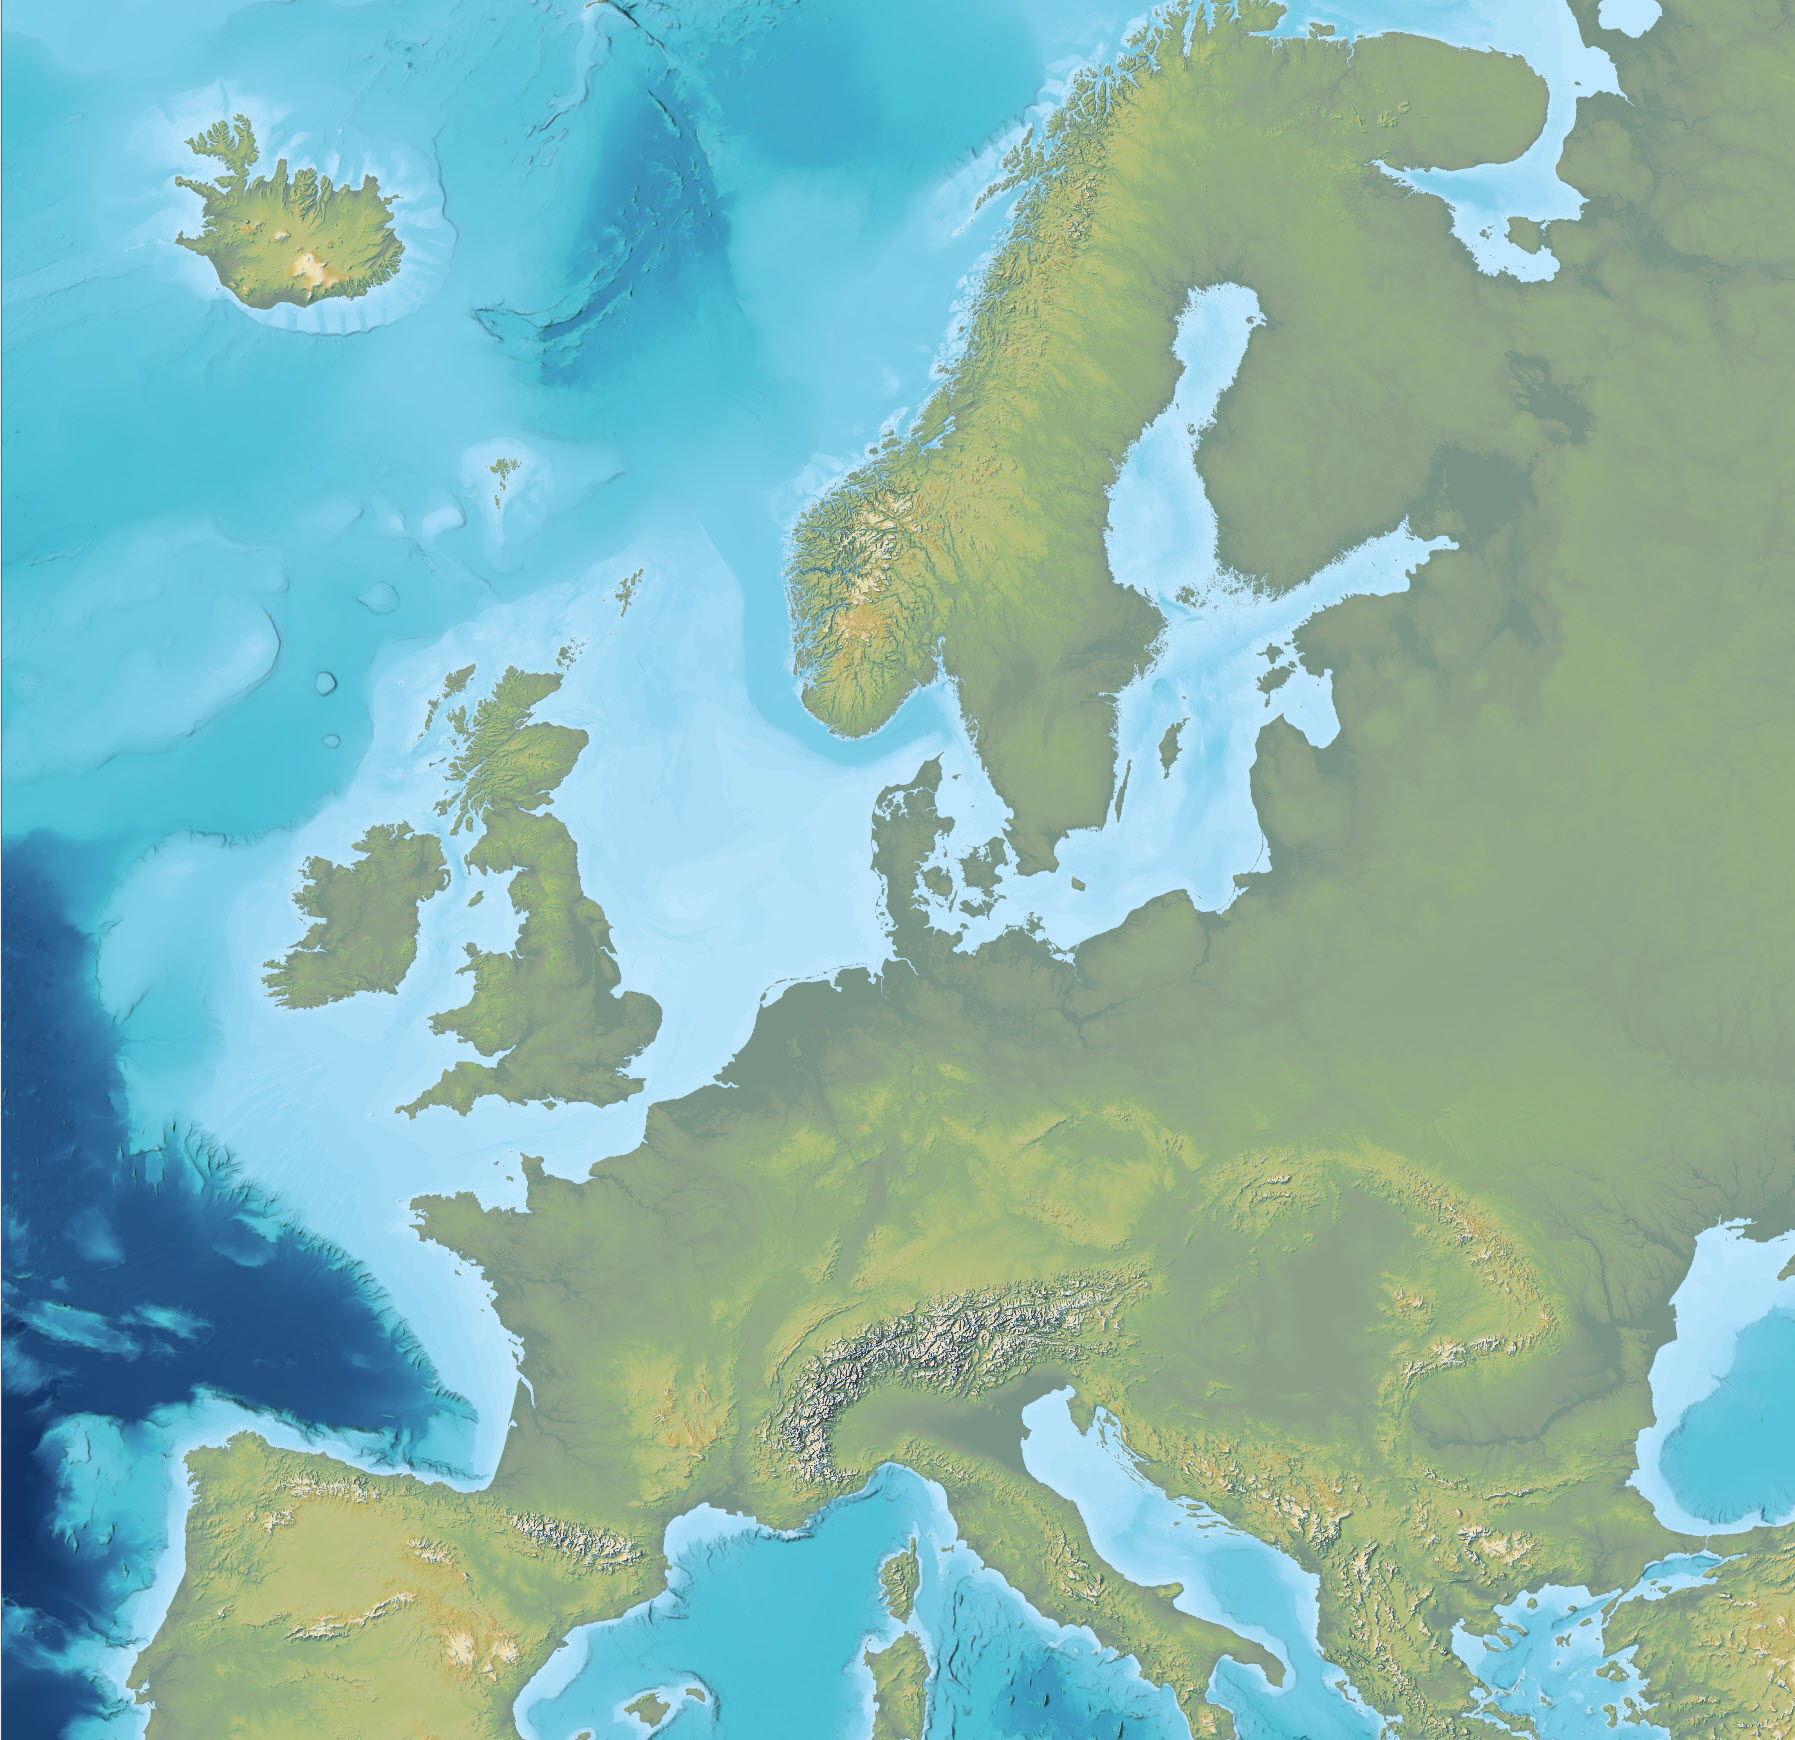
The dataset is an Imhof-inspired cartographic base map combining topography and bathymetry, covering European countries and adjacent marine areas. The map has been constructed by merging several existing digital elevation models, with topography primarily based on EU-DEM v1.1 and the Shuttle Radar Topography Mission (SRTM), and bathymetry derived from the General Bathymetric Chart of the Oceans (GEBCO). The dataset provides a continuous surface integrating land and marine areas and has been developed with a focus on visual quality and regional applications.
-
%20-%20datas%C3%A6t.jpg)
The Greenland Mineral Occurrences Map (GMOM) dataset contains a compilation of geological information on known mineral occurrences in Greenland. For each occurrence, information includes geographic location, size, mineral commodities, mineralisation type, exploration history and a geological description. The data have been collected and compiled from published scientific articles, exploration reports submitted to the authorities in Greenland, and direct geological observations made during fieldwork conducted by geological surveys, academic researchers and mineral exploration companies. The dataset represents a synthesis of existing knowledge on mineral occurrences in Greenland.
-
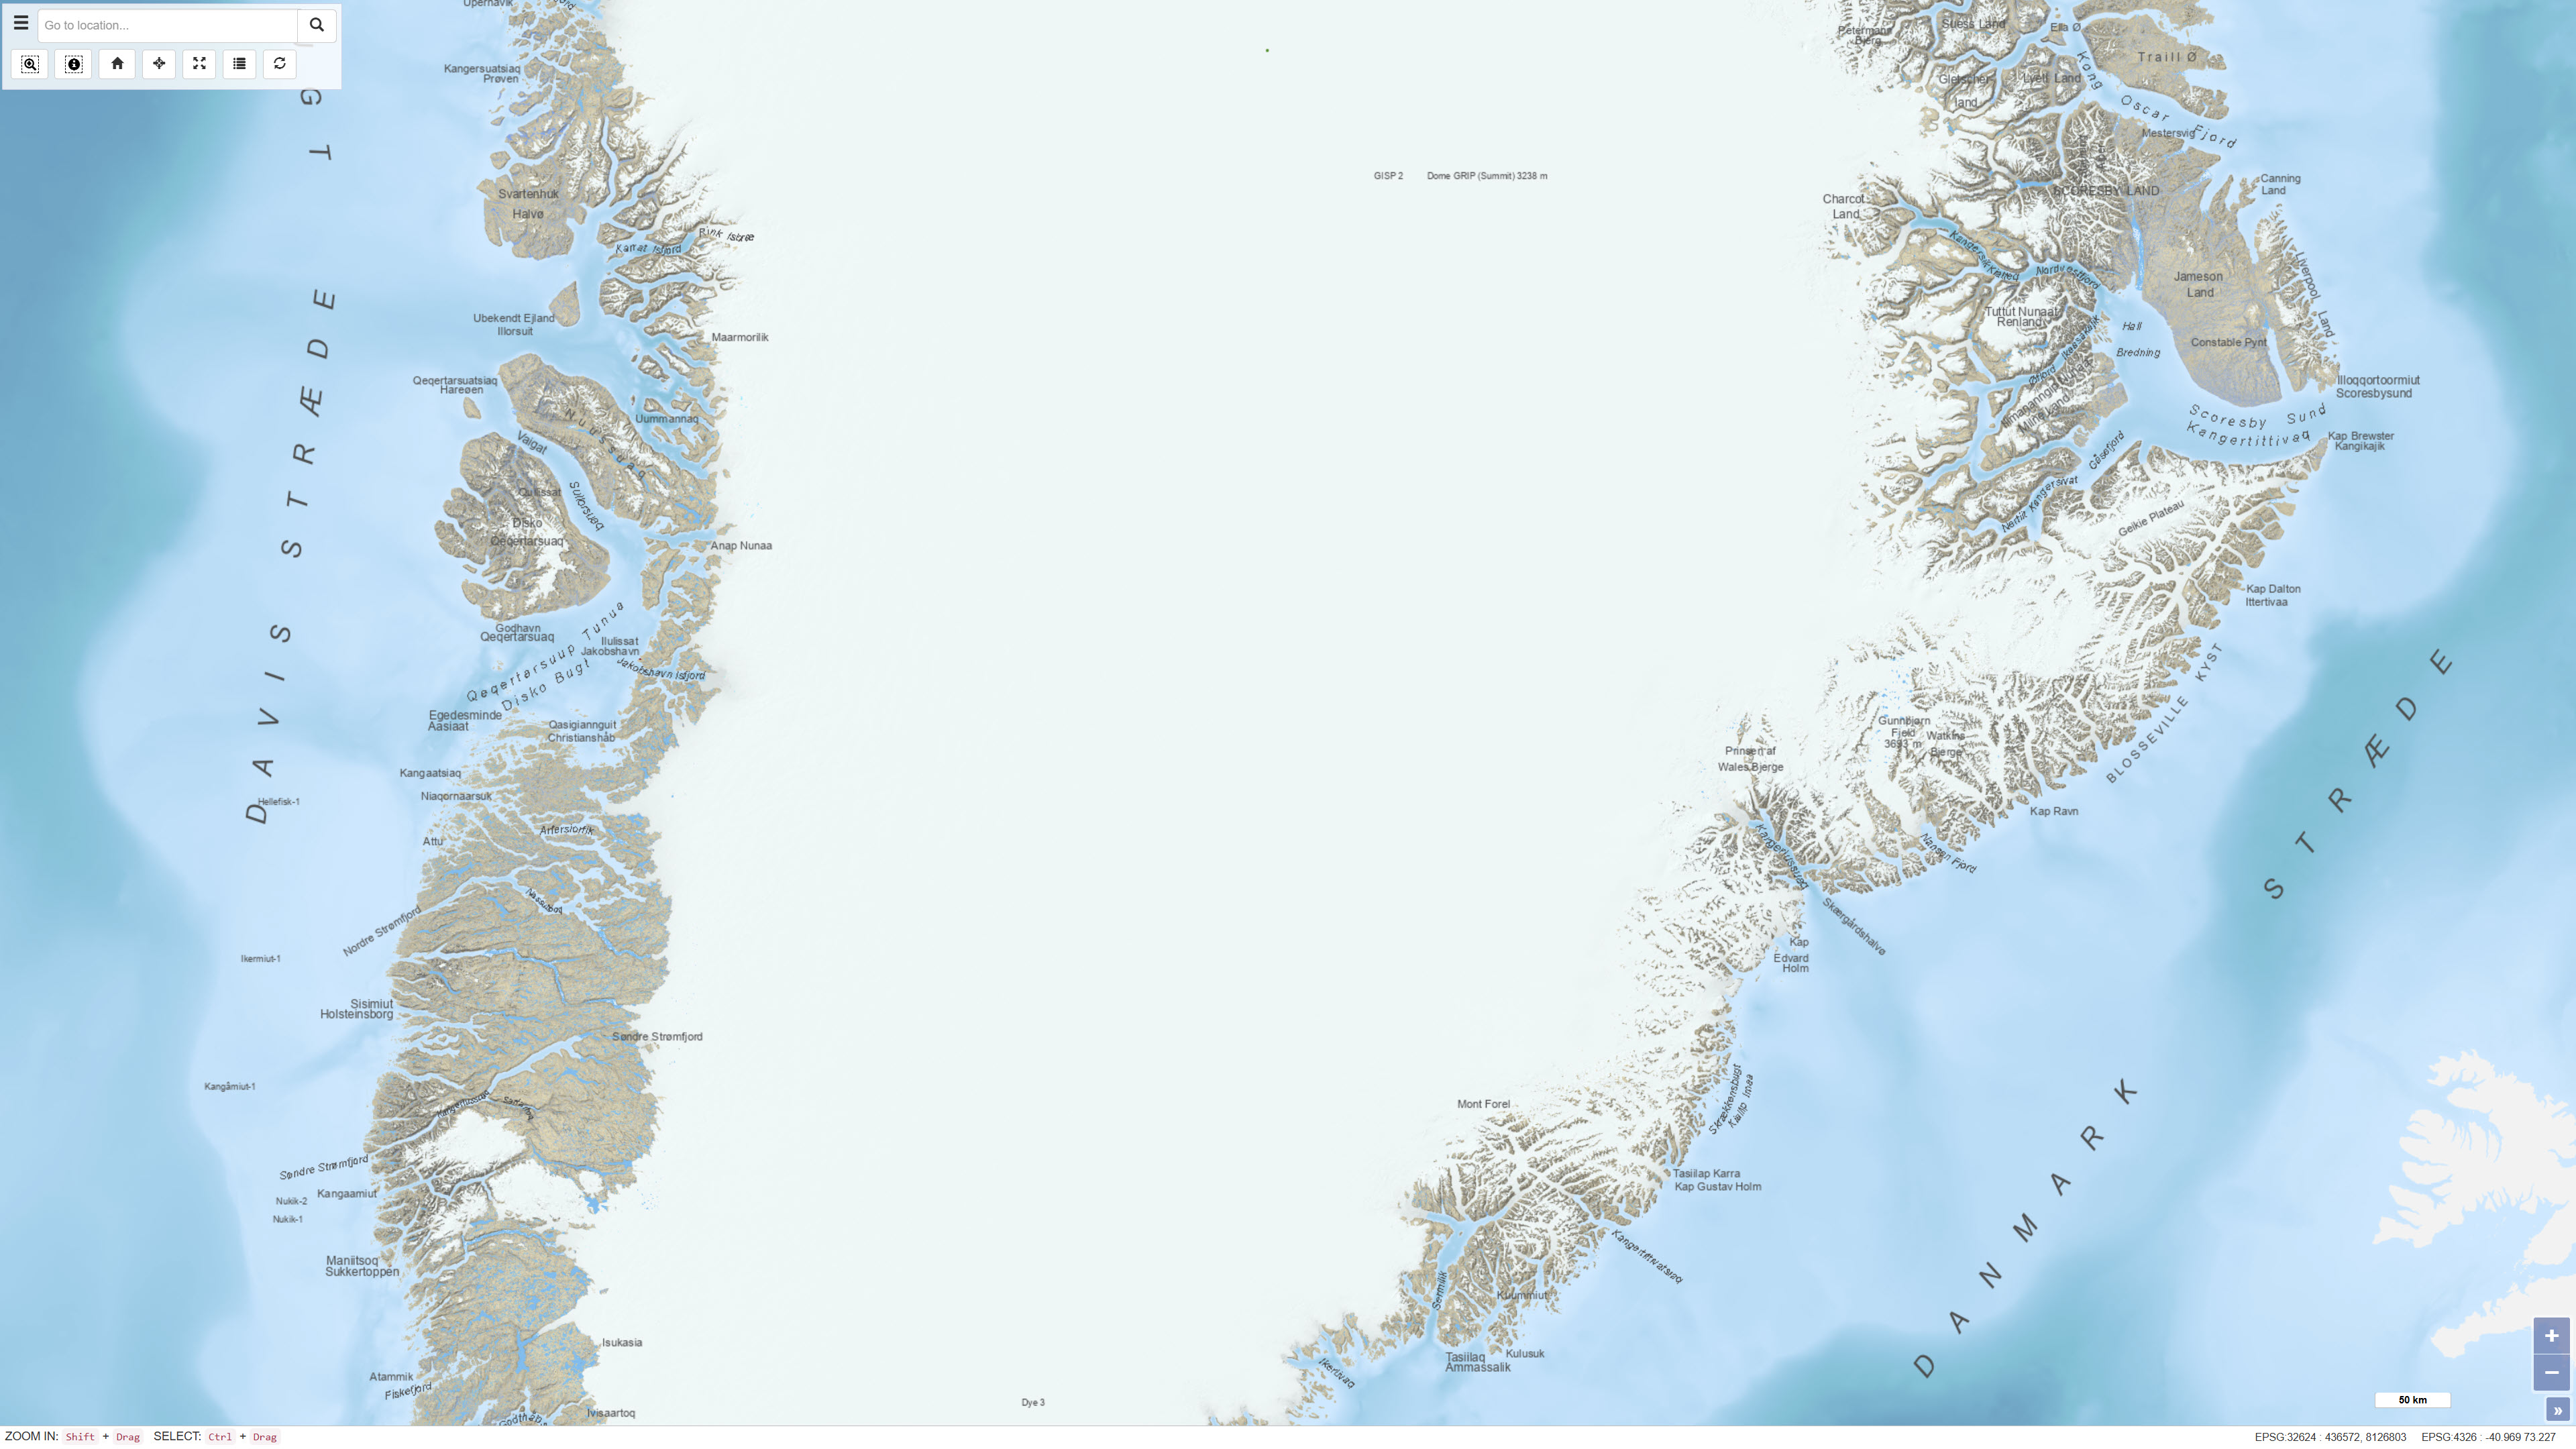
The dataset consists of three different datasets with combined place names in various geological maps: Geological map of Greenland 1:2.500.000, Geological maps of Greenland 1:500.000 and Topographic map of Greenland 1:250.000. The dataset has not been updated or maintained since 2014.
-
%20UTM%20zone%2024N%20-%20datas%C3%A6t.jpg)
The dataset shows global bathymetry based on The General Bathymetric Chart of the Oceans (GEBCO) 2019. The dataset represents a continuous model of seafloor topography derived from a combination of multibeam, singlebeam and satellite altimetry data. The original global grid has been reprojected to UTM zone 24N to support regional use and integration with other geological and geophysical datasets covering Greenland and the North Atlantic.
-
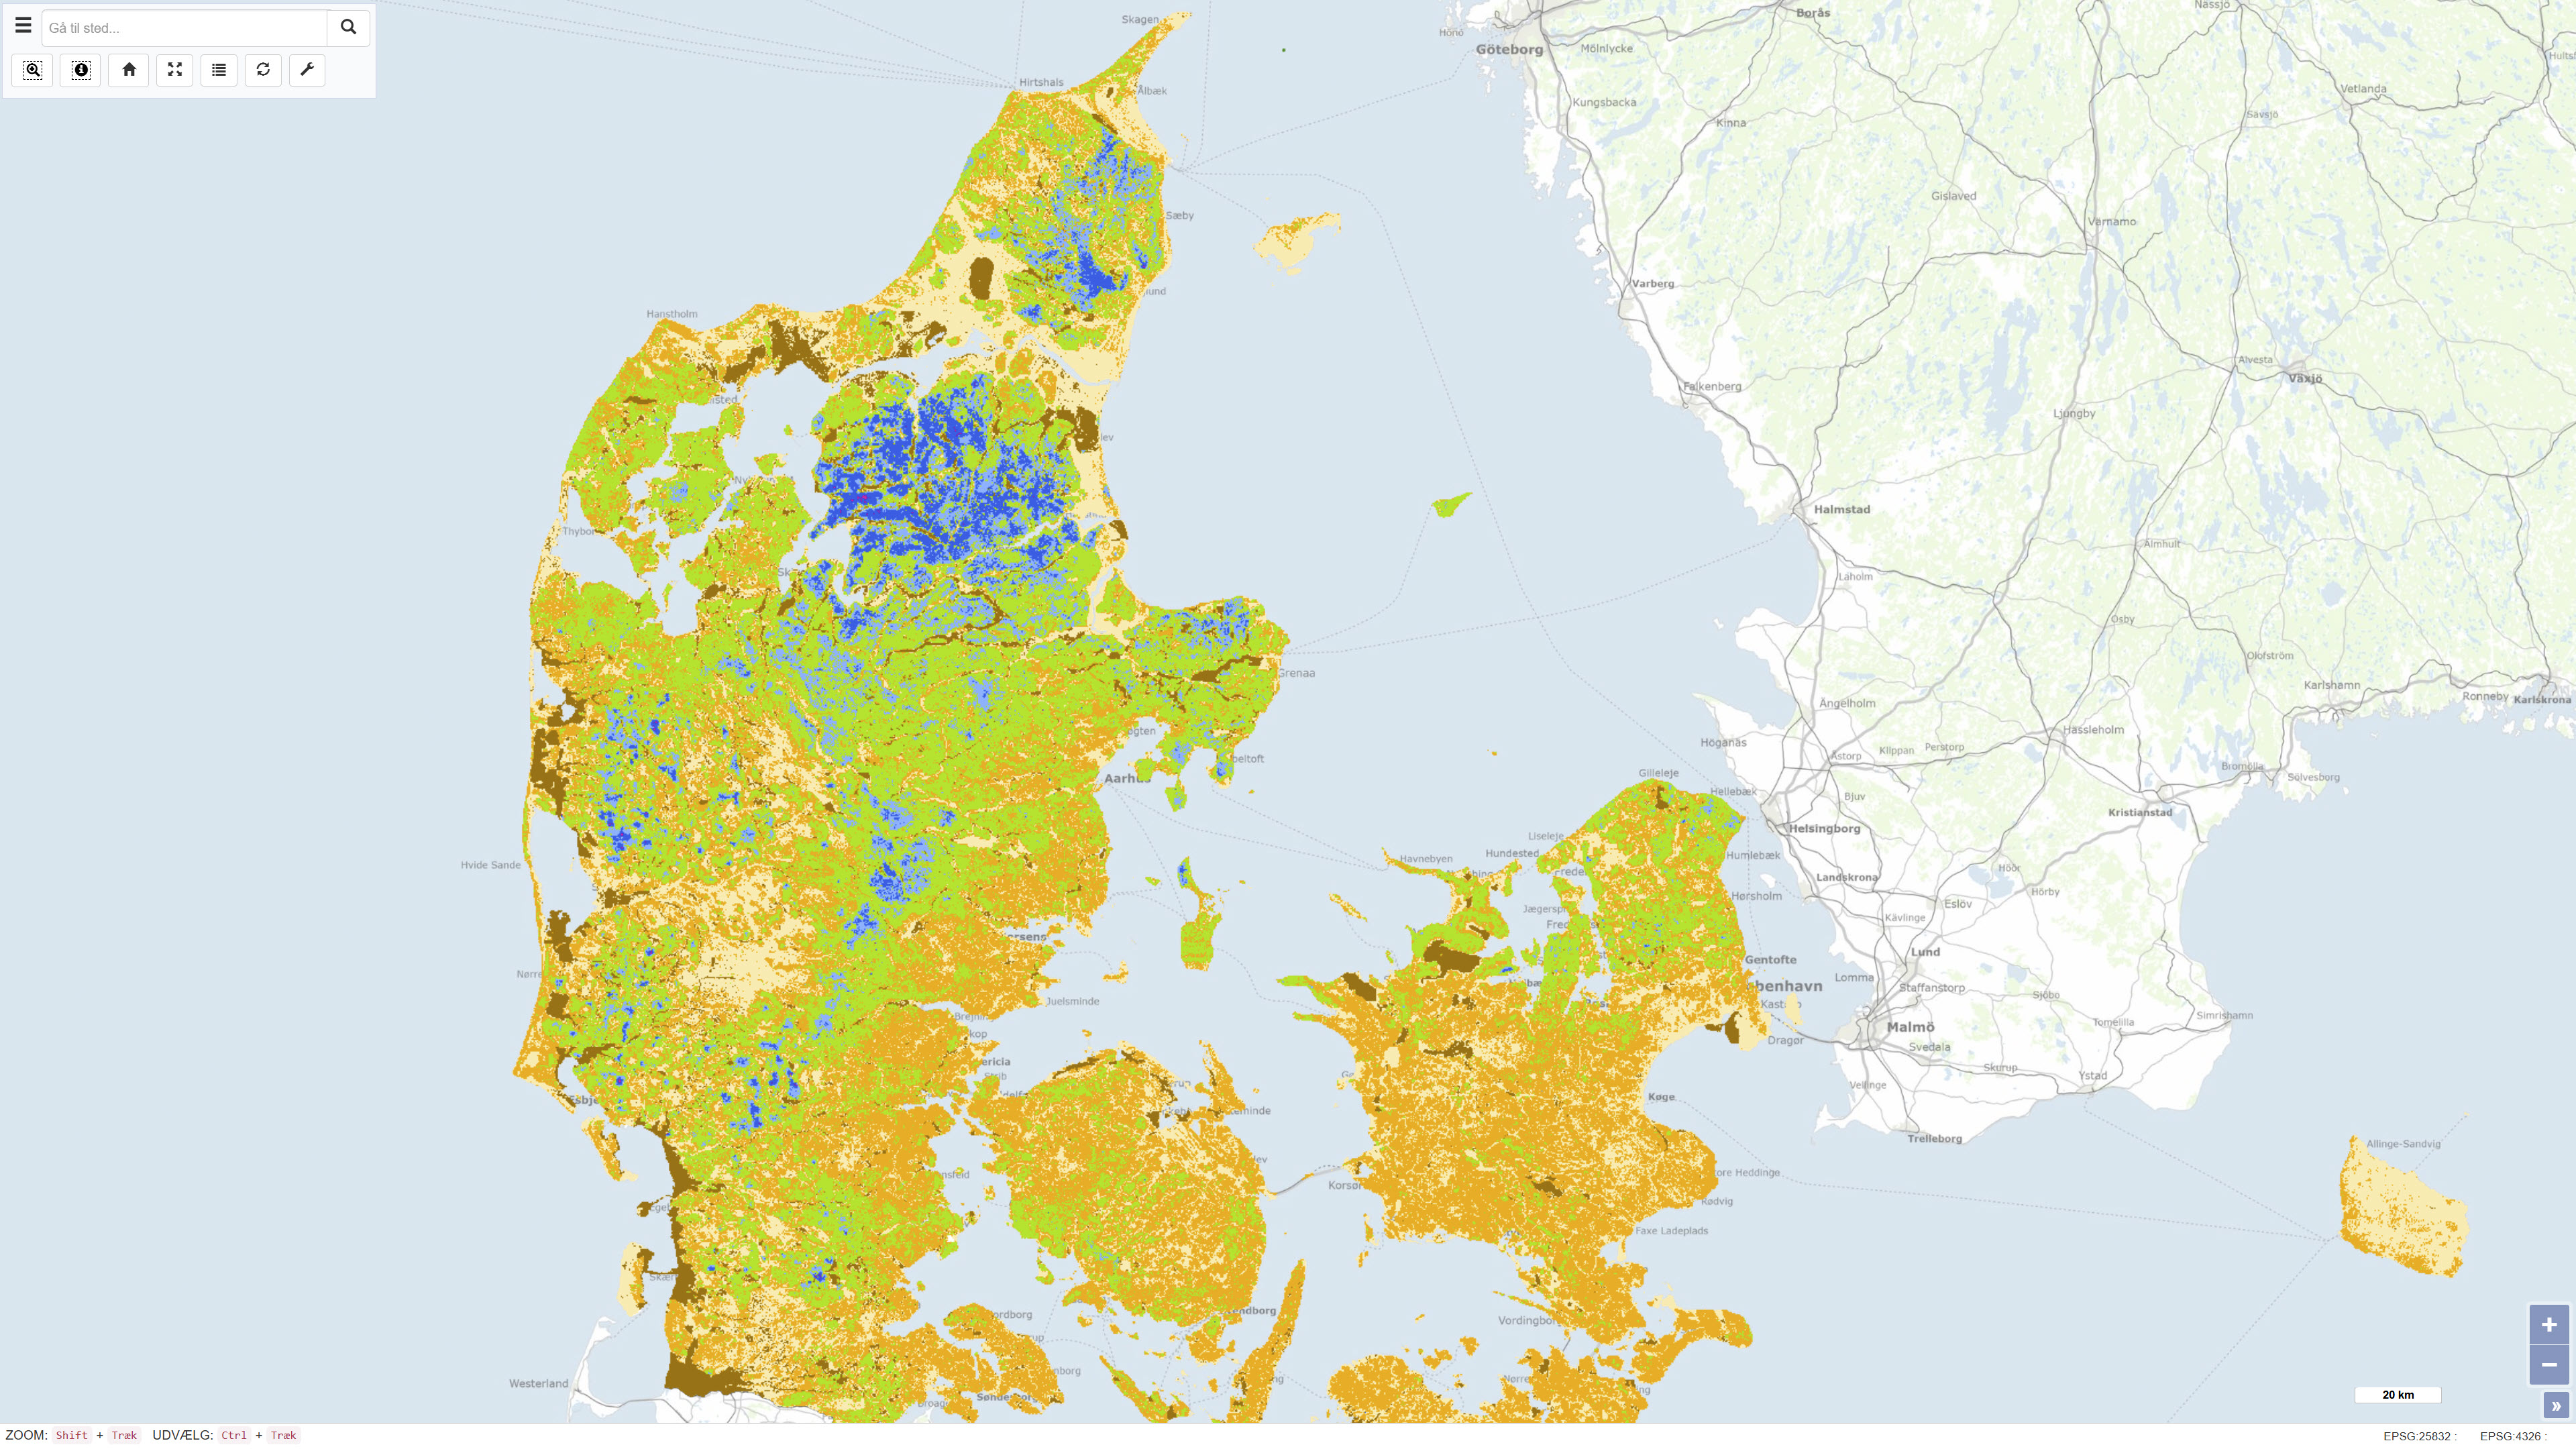
The dataset shows the depth to the redox interface in metres below ground level across Denmark at a spatial resolution of 100 metres. The redox interface represents the transition between oxidised and reduced sediment layers and is a key hydrogeological parameter influencing processes such as nitrate reduction and groundwater chemistry. The map is based on a statistical model developed from approximately 13.000 observations of colour changes in sediment samples and represents the best estimate of the depth to the redox interface nationwide. The dataset also includes an associated uncertainty estimate describing the variability and robustness of the model results.
-
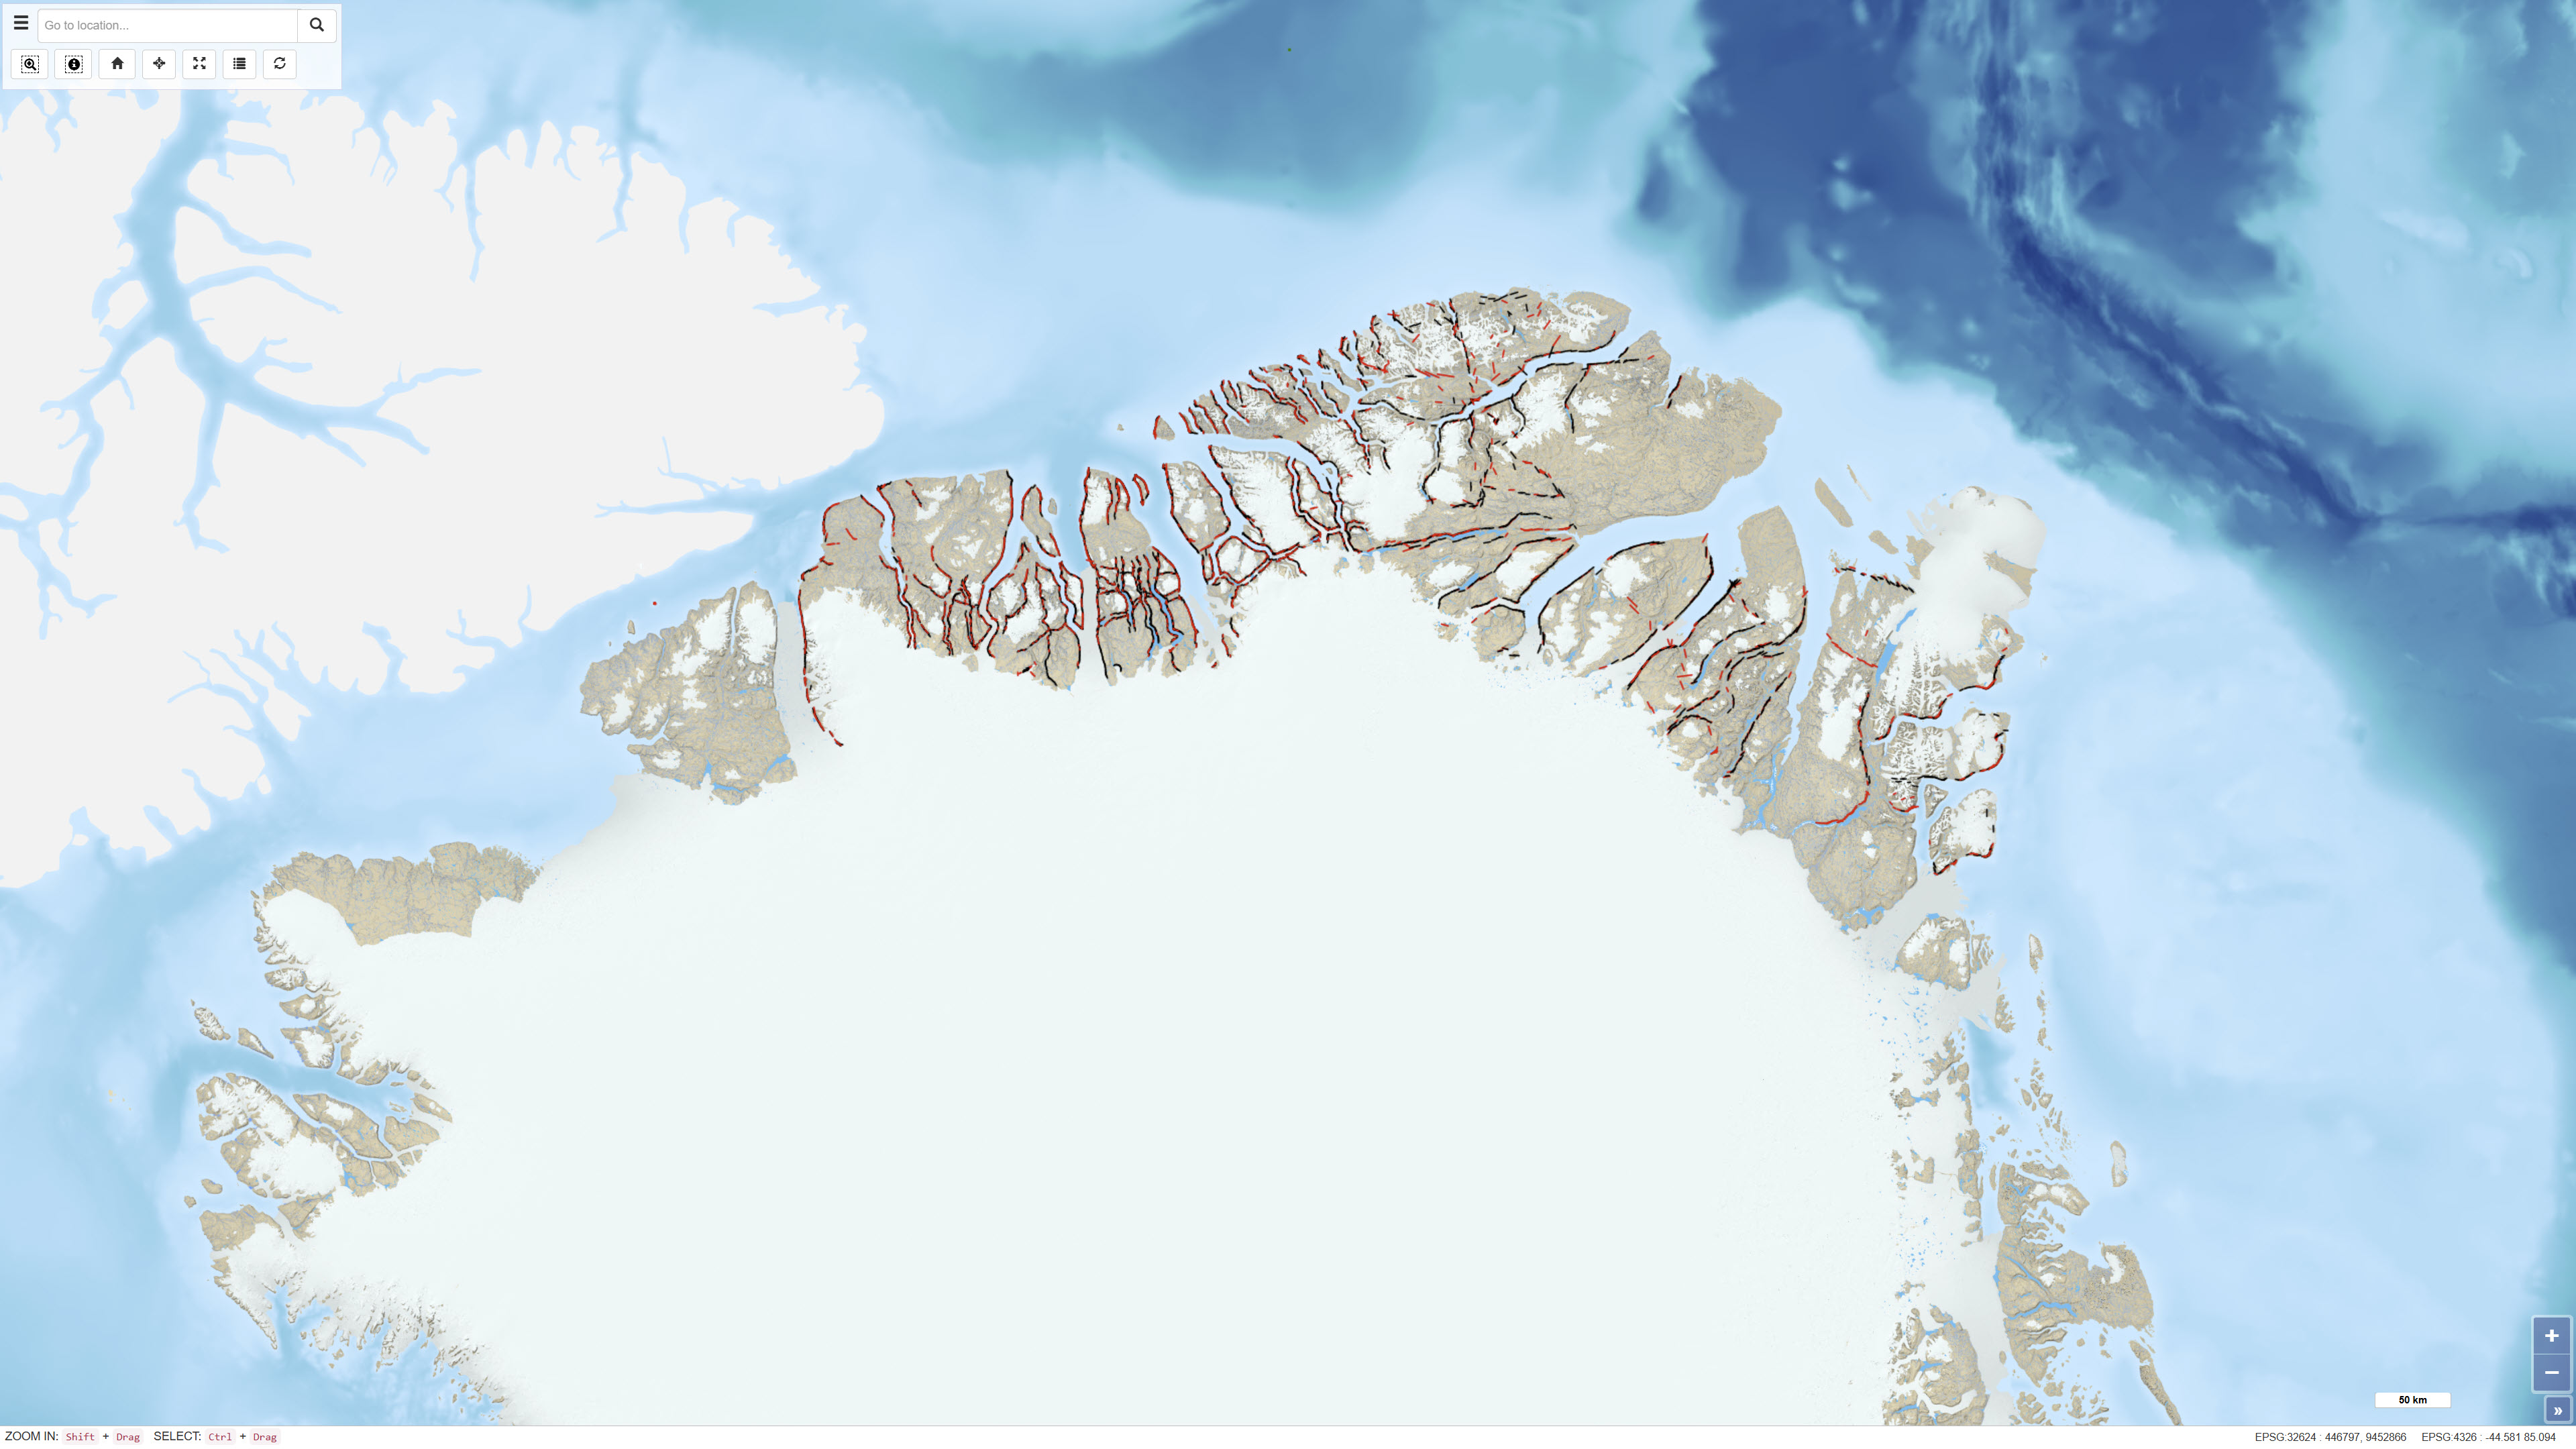
The dataset comprises more than 6,400 oblique aerial photographs acquired during the systematic 1:500,000 geological mapping programme in North Greenland carried out by the Geological Survey of Greenland (now GEUS) between 1978 and 1985. The photographs document steep fjord and valley walls and were collected as part of geological field investigations. The images have been digitised and made available through a web-based interface, allowing users to access individual photographs, their geographic locations and associated geological coding linked to the regional geological map. The dataset represents a systematic visual documentation of geological features in North and Northeast Greenland.
-
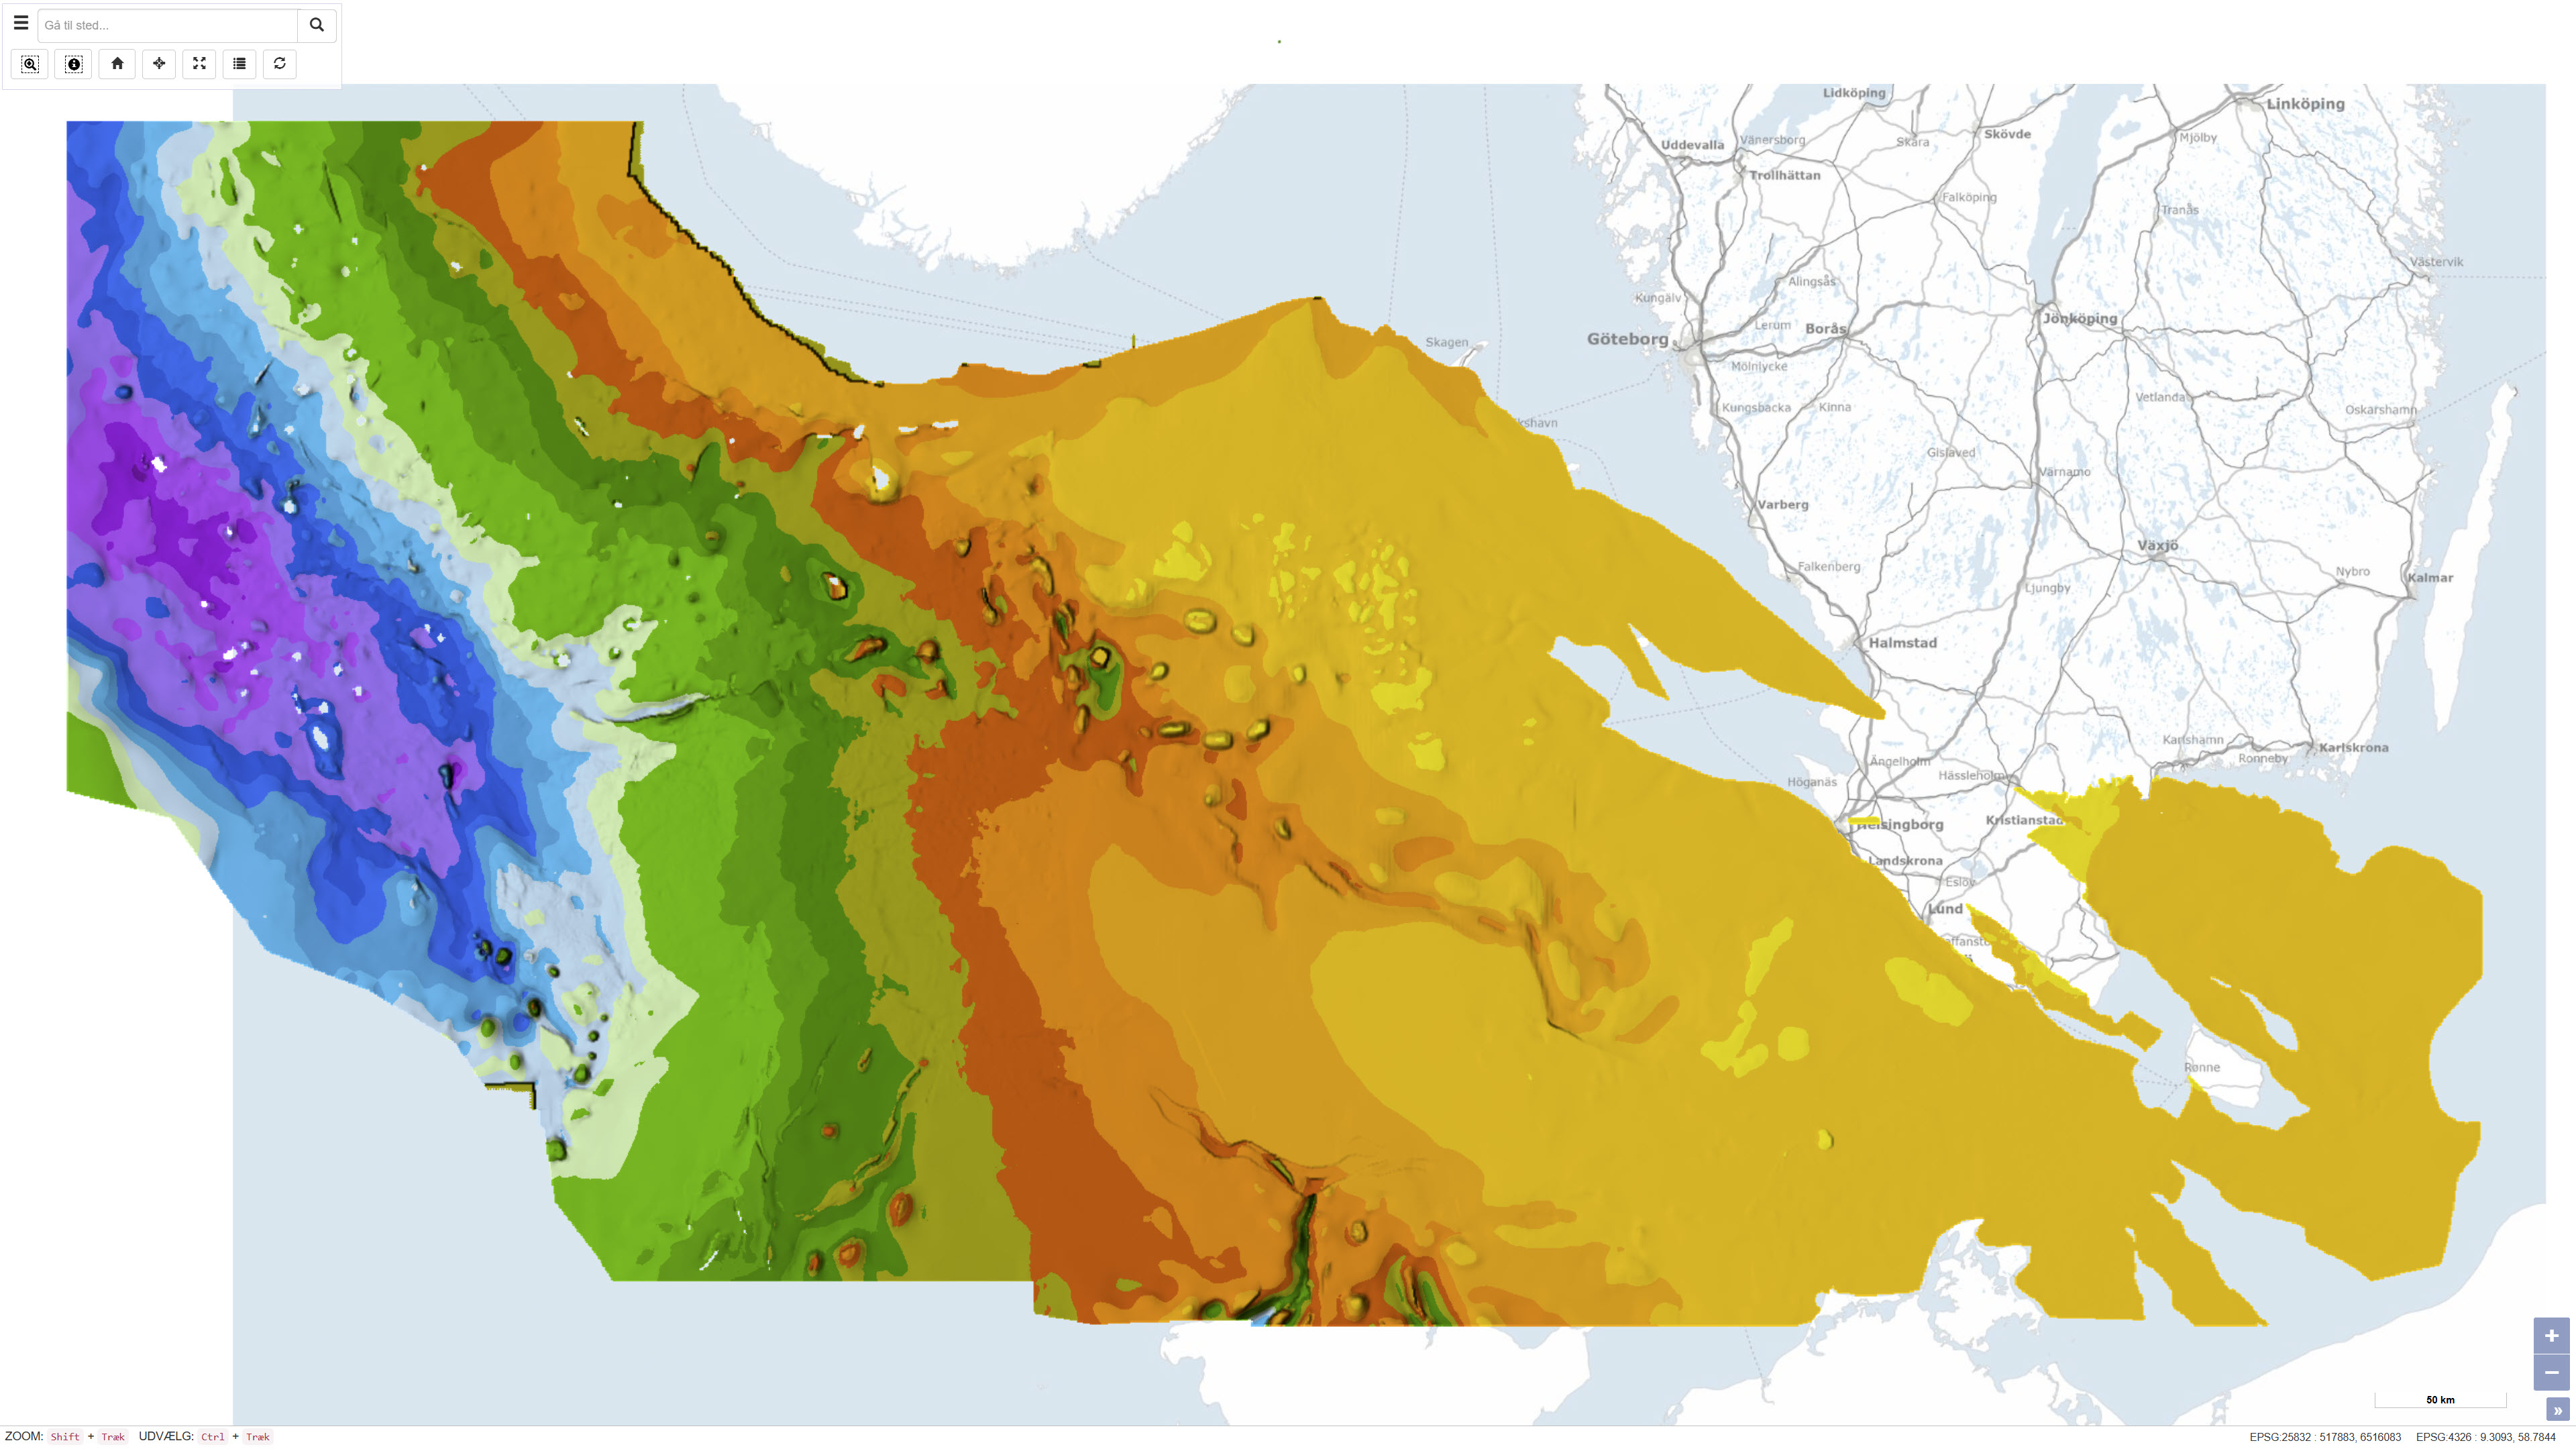
This dataset represents the structure and topography of the Top Chalk surface, i.e. the top of the Chalk Group (including Upper Cretaceous to Danian), in the Danish subsurface. The map illustrates regional variations in the depth and structural configuration of the chalk surface from the central North Sea to the eastern Danish areas. It is based on an integrated geological and geophysical interpretation of seismic profiles, well data and earlier mapping. The map provides an essential basis for geological, geophysical and subsurface reservoir analyses.
-
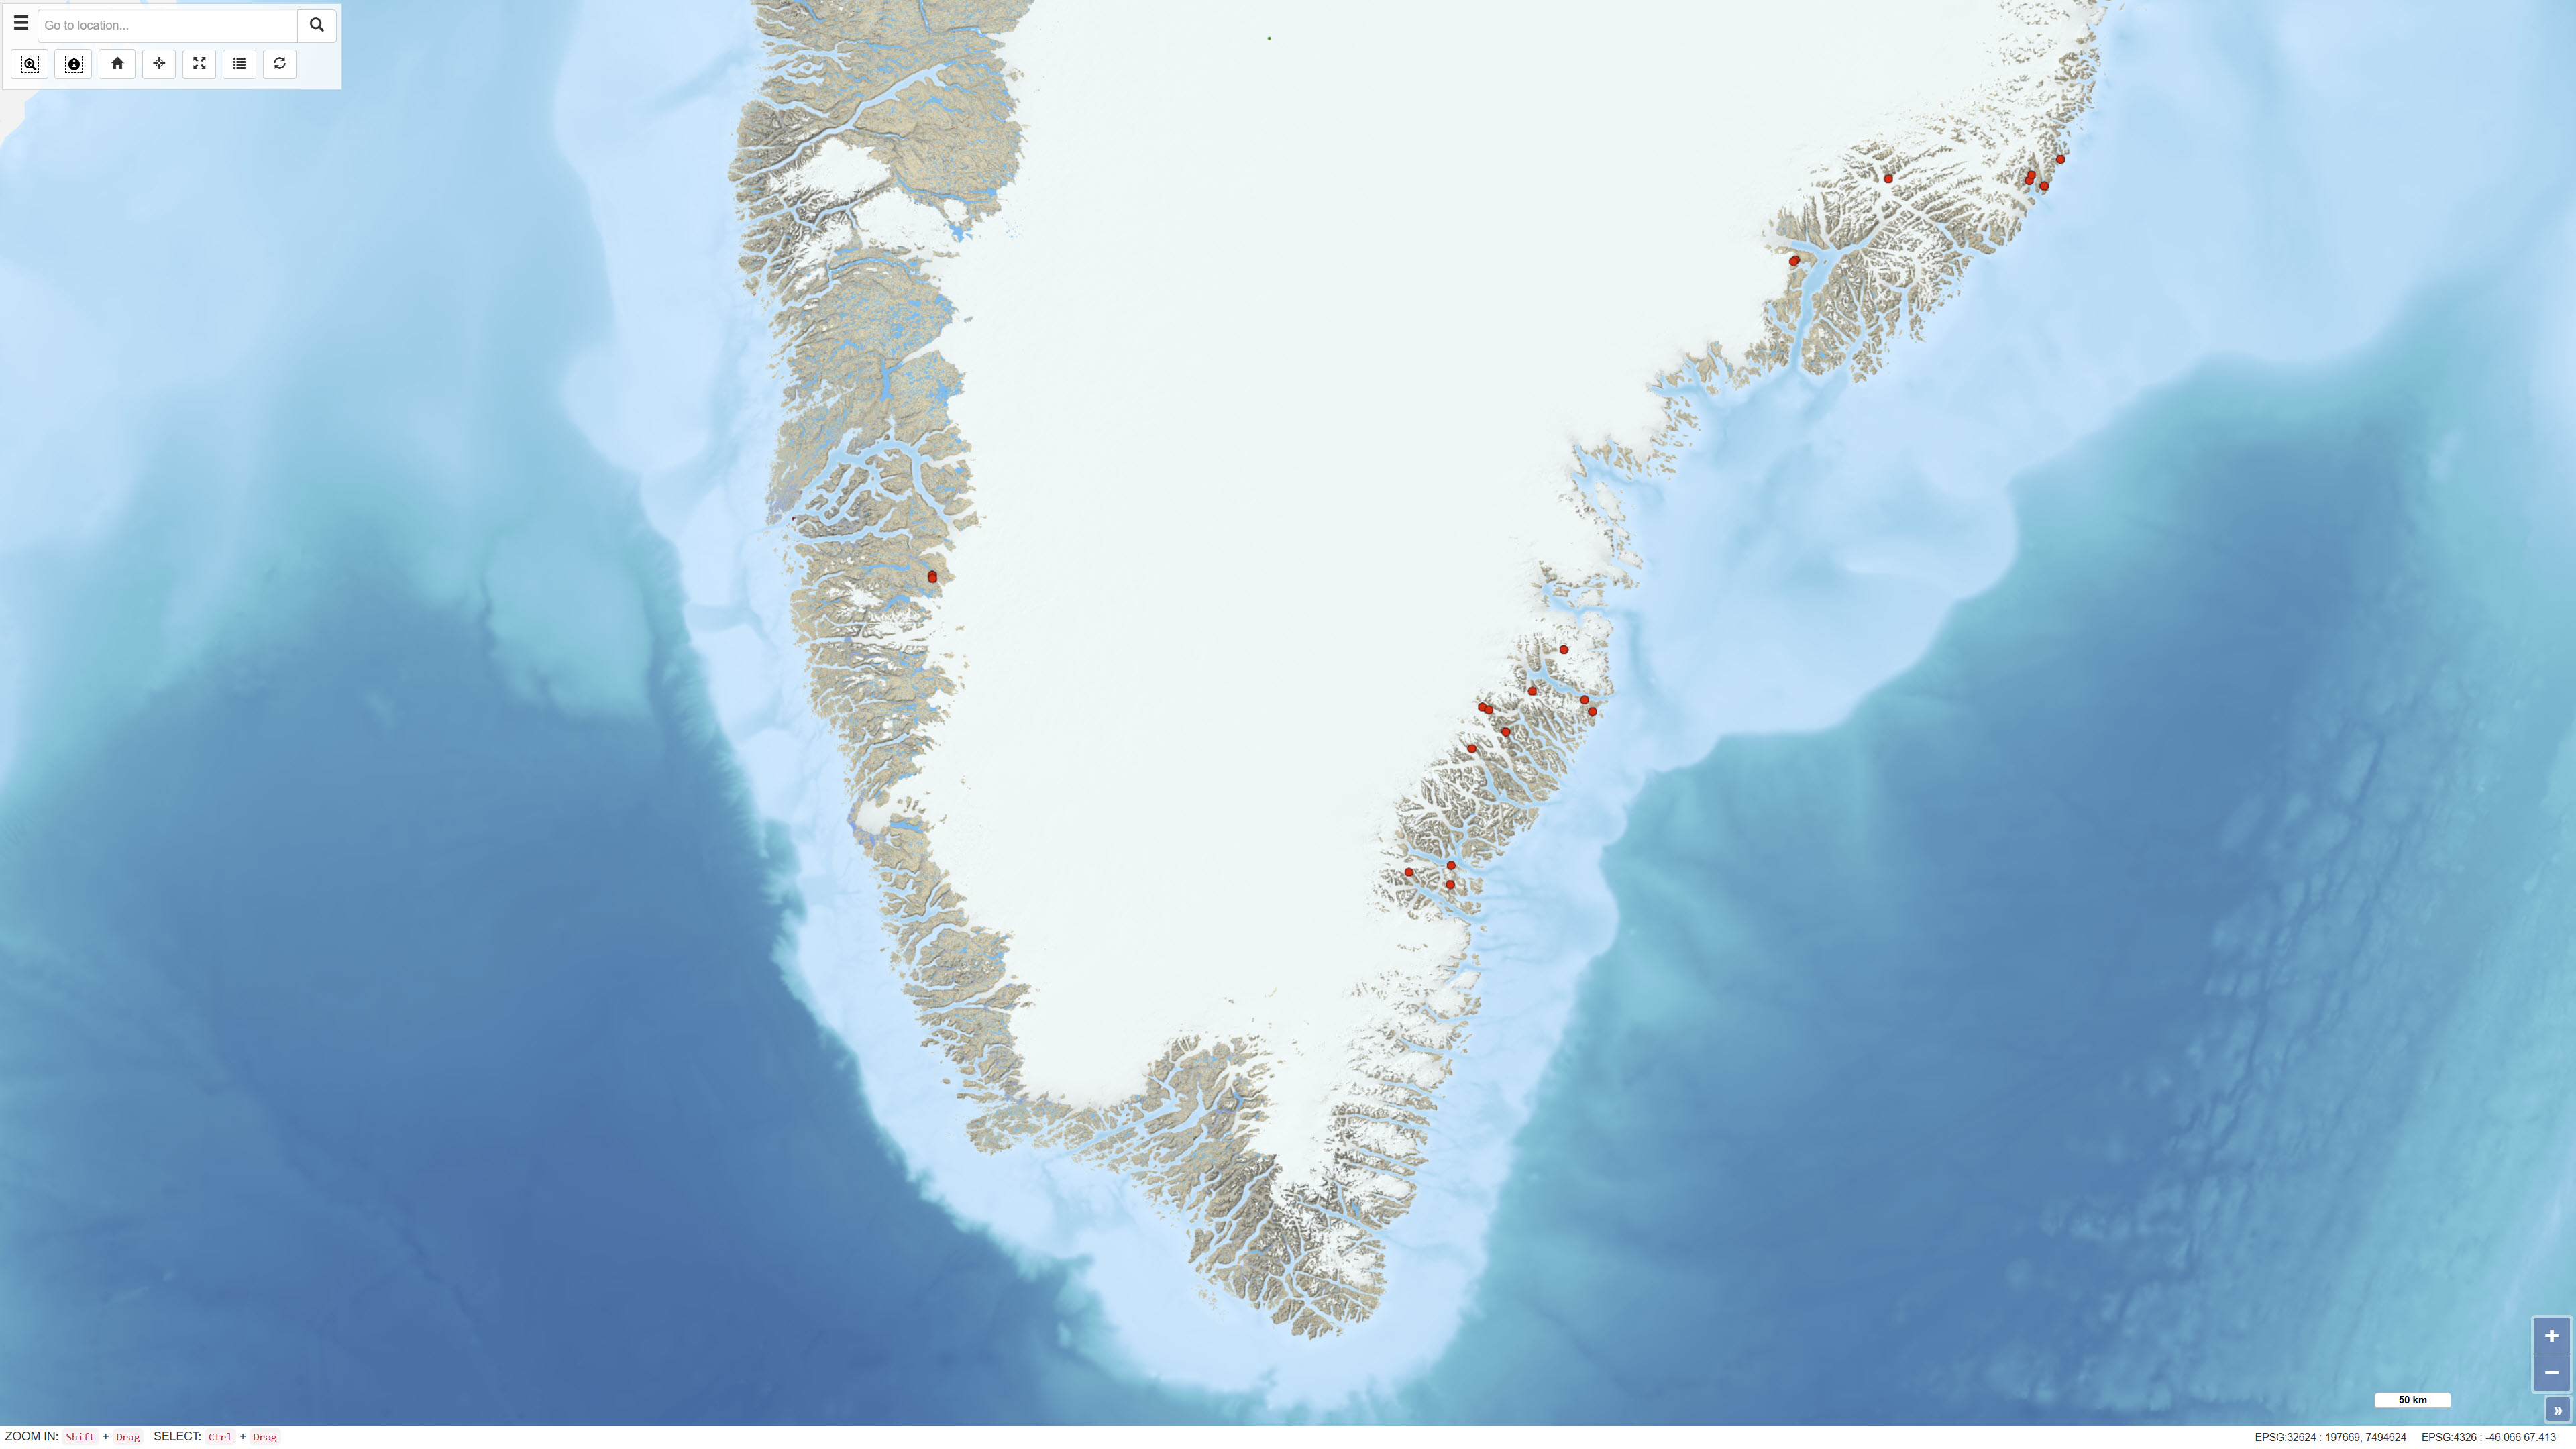
The dataset contains geochemical analyses of 49 scree (talus) samples collected in Greenland as part of regional geochemical mapping programmes conducted by the Geological Survey of Greenland (GGU), later GEUS, between 1977 and 1997. Scree samples were collected in areas where neither stream sediment nor soil sampling was feasible. The samples represent near-surface material derived from local bedrock and were analysed for major and trace elements using laboratory methods available at the time of collection. The dataset supplements regional geochemical data from stream sediment and soil samples and forms part of the overall basis for geochemical mapping in Greenland.