 Arctic SDI catalogue
10 m
Type of resources
Available actions
Topics
Keywords
Contact for the resource
Provided by
Years
Formats
Scale
Resolution
-

The Rolling Archive database (WLRA) is one of the products of the pan-European High-Resolution Water Snow & Ice portfolio (HR-WSI), which are provided at high spatial resolution from the Sentinel-2 and Sentinel-1 constellations data from September 1, 2016 onwards. The High Resolution Water Layer portfolio consists of the Water Layer (WL), the Water Presence Index (WPI), the Water confidence layer (WCL) and the Rolling archive (WLRA). The WLRA consists of intermediate production layers such as water and wetness masks showing the seasonal water and dry occurrences starting 2009. The masks are used for the generation of the Water Layer which covers a period of seven years per reference year and is regularly updated every three years. It is therefore important that it is consistent over the entire period. To guarantee reproducibility and future continuation of the baseline product, these masks are provided within a database consisting of all seasonal masks starting from 2009. With the new update of the Water product, the HR WL for the reference year 2021 only water masks will be continued. Additionally, the computation frequency changed from seasonal to monthly masks. This update covers a period from 2016.09.01 to 20211231 including an update of the masks already availbe from the historic 2018 production. The binary masks are provided across Europe in a spatial resolution of 10 m x 10 m as GeoTiffs zipped in a ZARR file.
-
This is the metadata covering the Water Layer (WL) product. The WL is one of the products of the pan-European High-Resolution Water Snow & Ice portfolio (HR-WSI), which are provided at high spatial resolution from the Sentinel-2 and Sentinel-1 constellations data from September 1, 2016 onwards.. The WL is generated for the 2021 & 2024 reference year. It is a a multi-annual product based on the information covering the period (e.g. 2016-2021). In the context of the HR-WSI, the water and dry frequency masks are derived from intermediate outputs of the WCD workflow, the monthly surface water masks in combination with the WIC S2 NRT product. It provides detailed information about the presence and condition of water surfaces across Europe. There are 5 major classes like: - Dry (always or mostly dry with minor instances of wet) - permanent water (always contains water) - temporary water ( temporary water surfaces, aliteration of dry and water) - sea water (oceans and sea) - clouds It is also generated in different spatial resolutions (10m and 100m) and projections (LAEA & WGS84/UTM). The High Resolution Water Layer portfolio consists of the WL, the Water Presence Index (WPI), the Water confidence layer (WCL) and the Rolling archive (WLRA). The WL is provided in a package (zip) containing the WL, the WPI and the WCL: The WCL is displaying a measure of confidence between 0 and 100%. It identifies the likelihood of (in)correctness on pixel level based on information gained during production for the WL for the respective reference year. It is also generated in different spatial resolutions (10m and 100m) and projections (LAEA & WGS84/UTM). The Water Presence Index (WPI) product is one of the products of the pan-European High-Resolution Water Snow & Ice portfolio (HR-WSI), which are provided at high spatial resolution from the Sentinel-2 and Sentinel-1 constellations data from September 1, 2016 onwards. The High Resolution Water Layer portfolio consists of the Water Layer (WL), the Water Presence Index (WPI), the Water confidence layer (WCL) and the Rolling archive (WLRA). The WPI is generated for the 2021 reference year. It is a a multi-annual product based on the information covering a7-year period (e.g. 2016-2021). In the context of the HR-WSI, the water and dry frequency masks are derived from intermediate outputs of the WCD workflow, the monthly surface water masks in combination with the WIC S2 NRT product. It provides detailed information about the presence and condition of water surfaces across Europe. It is also generated in different spatial resolutions (10m and 100m) and projections (LAEA & WGS84/UTM).
-

Urban Atlas Building Block Height 2021 is a 10 m high resolution raster layer containing height information generated for selected cities and urban areas as part of the Urban atlas suite of products. Height information is based on satellite information and derived datasets like the digital surface model, the digital terrain model and the normalized digital surface model (DSM).
-
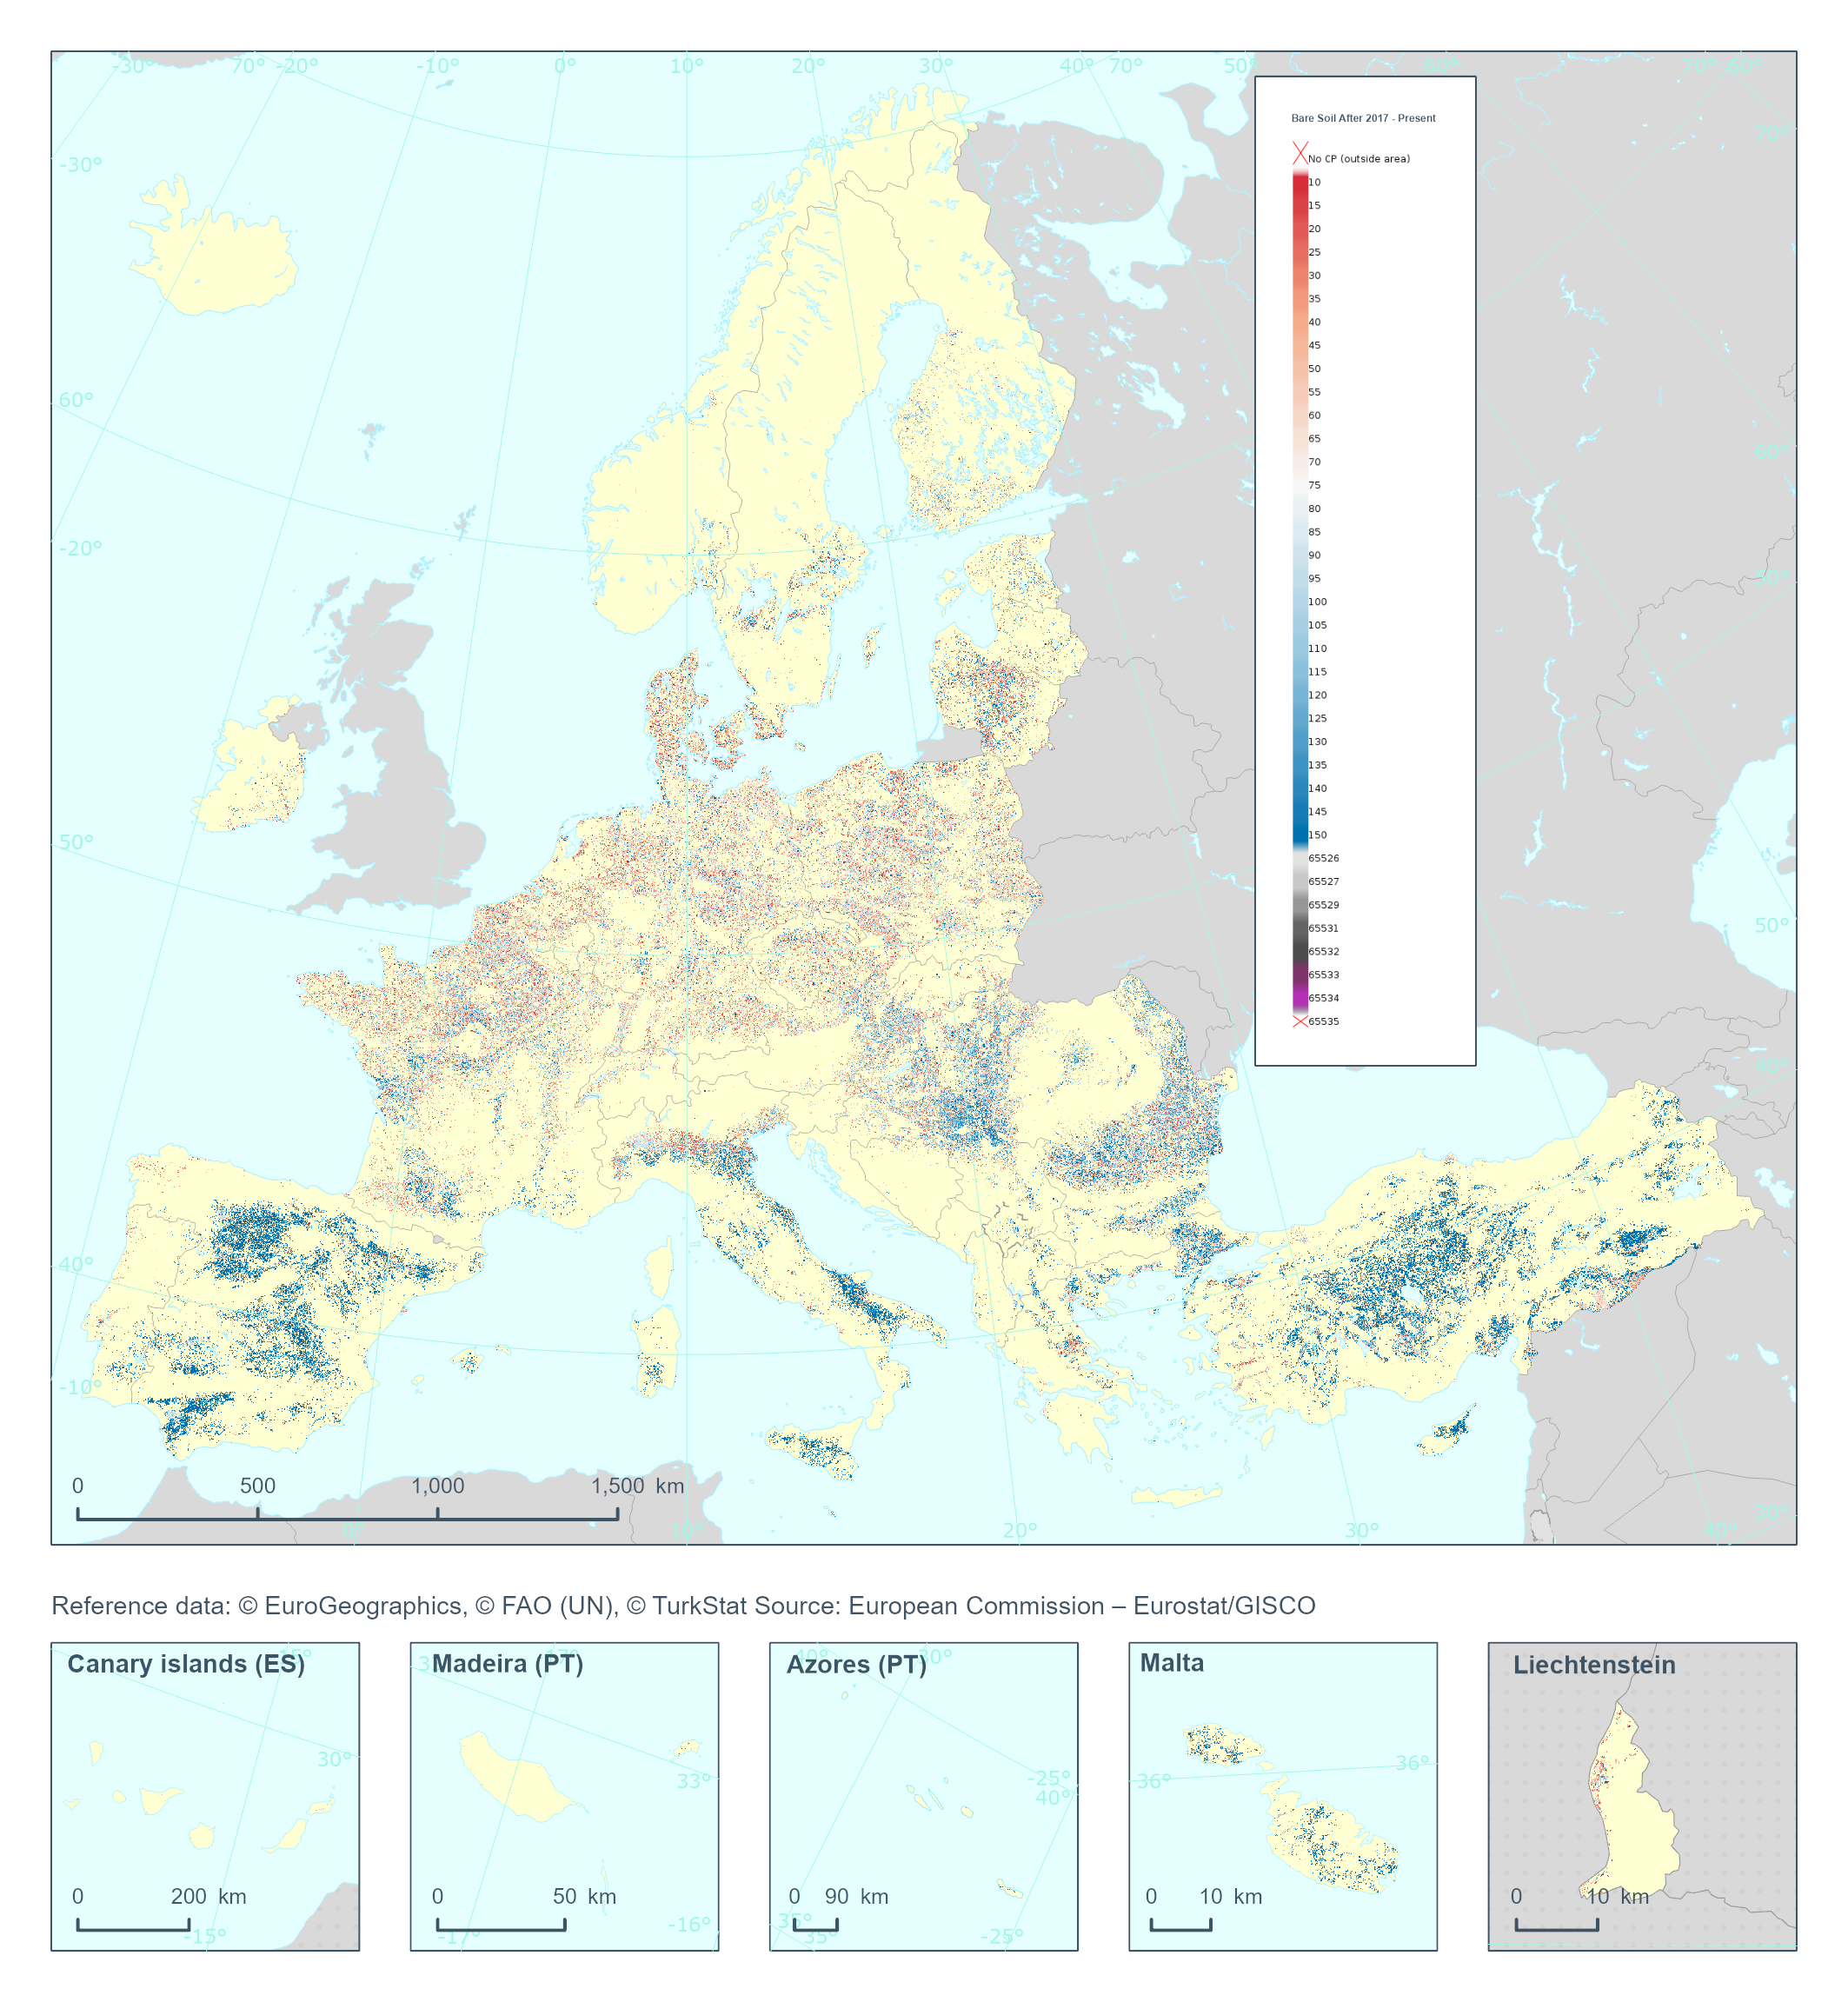
The High Resolution Layer Cropping Patterns - Bare Soil After (CPBSA) raster product provides bare soil period (in days) after the harvest of the main annual crop. Note that the bare soil period cannot transcend the calendar year for which the product is generated. This dataset is provided annually starting in 2017 with 10 meter rasters (fully conformant with the EEA reference grid) in 100 x 100 km tiles covering the EEA38 countries. High Resolution Layer Croplands product is part of the European Union’s Copernicus Land Monitoring Service. Confidence layer available for the dataset. This dataset includes data from the French Overseas Territories (DOMs)
-
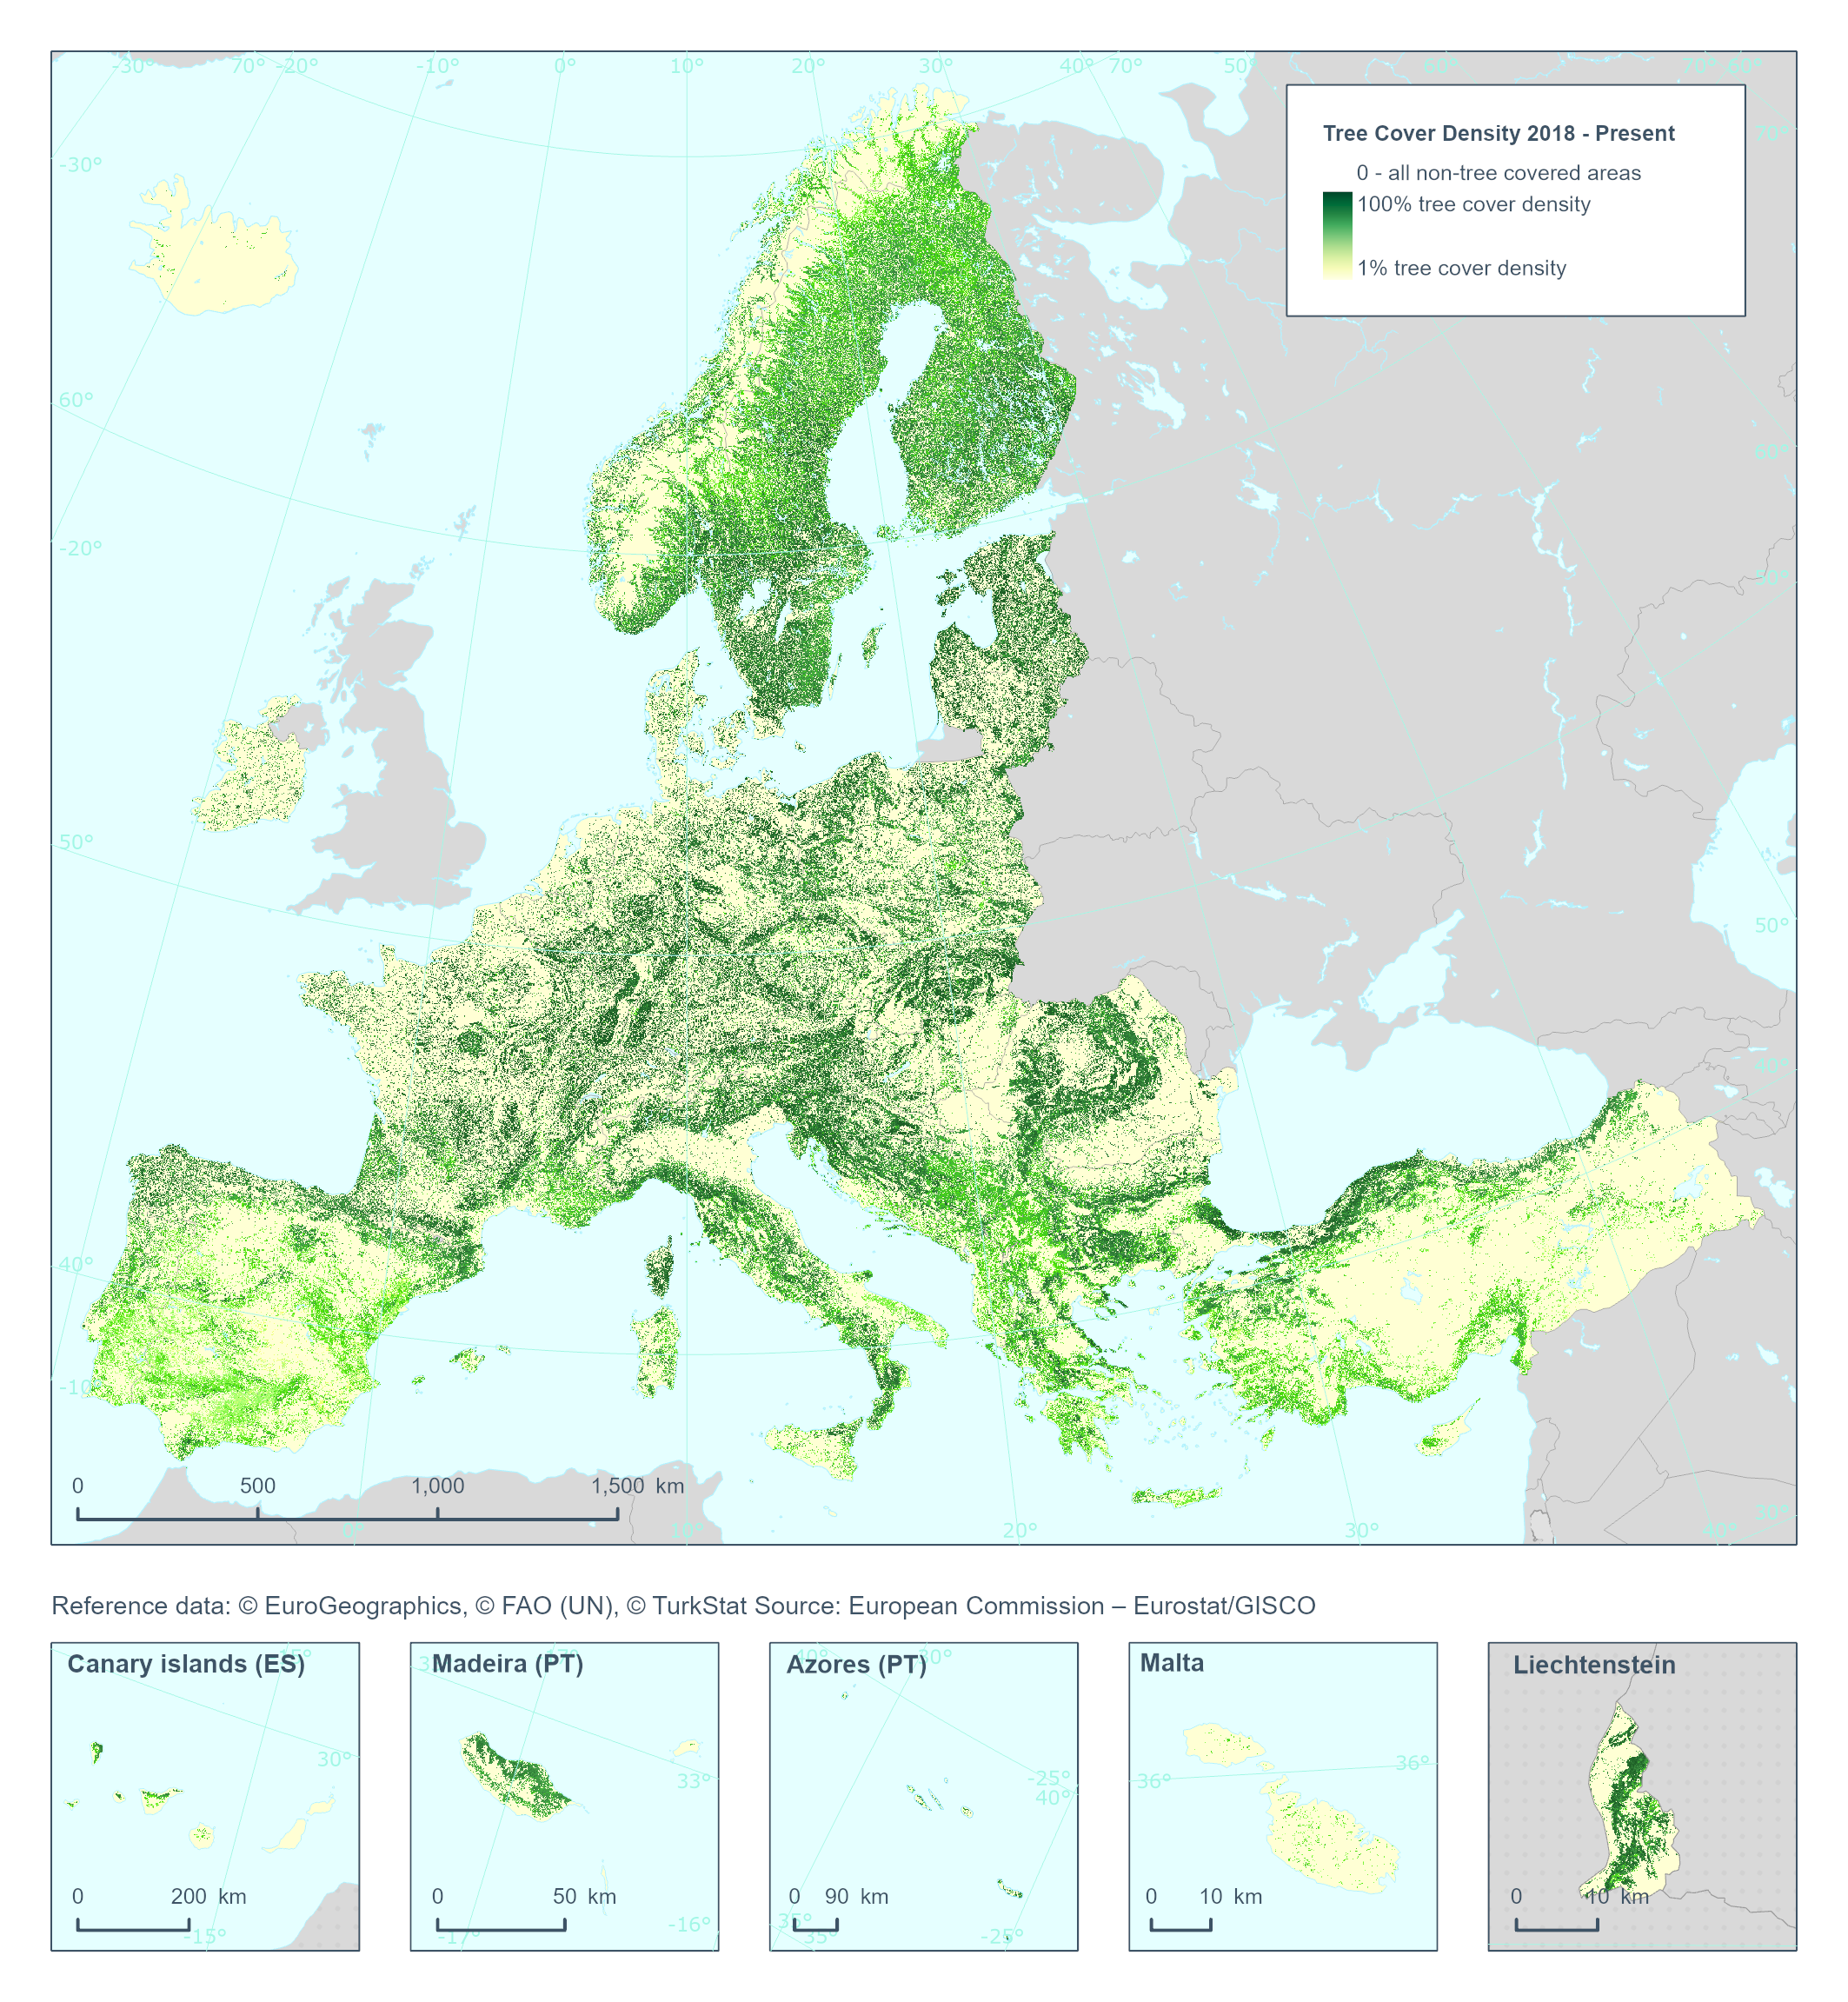
The High Resolution Layer Tree Cover Density (TCD) dataset provides information on the proportional crown coverage per pixel at 10 meter spatial resolution and ranges from 0% (all non-tree covered areas) to 100%, whereby Tree Cover Density is defined as the "vertical projection of tree crowns to a horizontal earth’s surface“. This dataset is provided annually starting with 2018 in 10 meter rasters (fully conformant with the EEA reference grid) in 100 x 100 km tiles covering the EEA38 countries. High Resolution Layer Tree Cover and Forest product is part of the European Union’s Copernicus Land Monitoring Service. Confidence layer available for the dataset. This dataset includes data from the French Overseas Territories (DOMs).
-
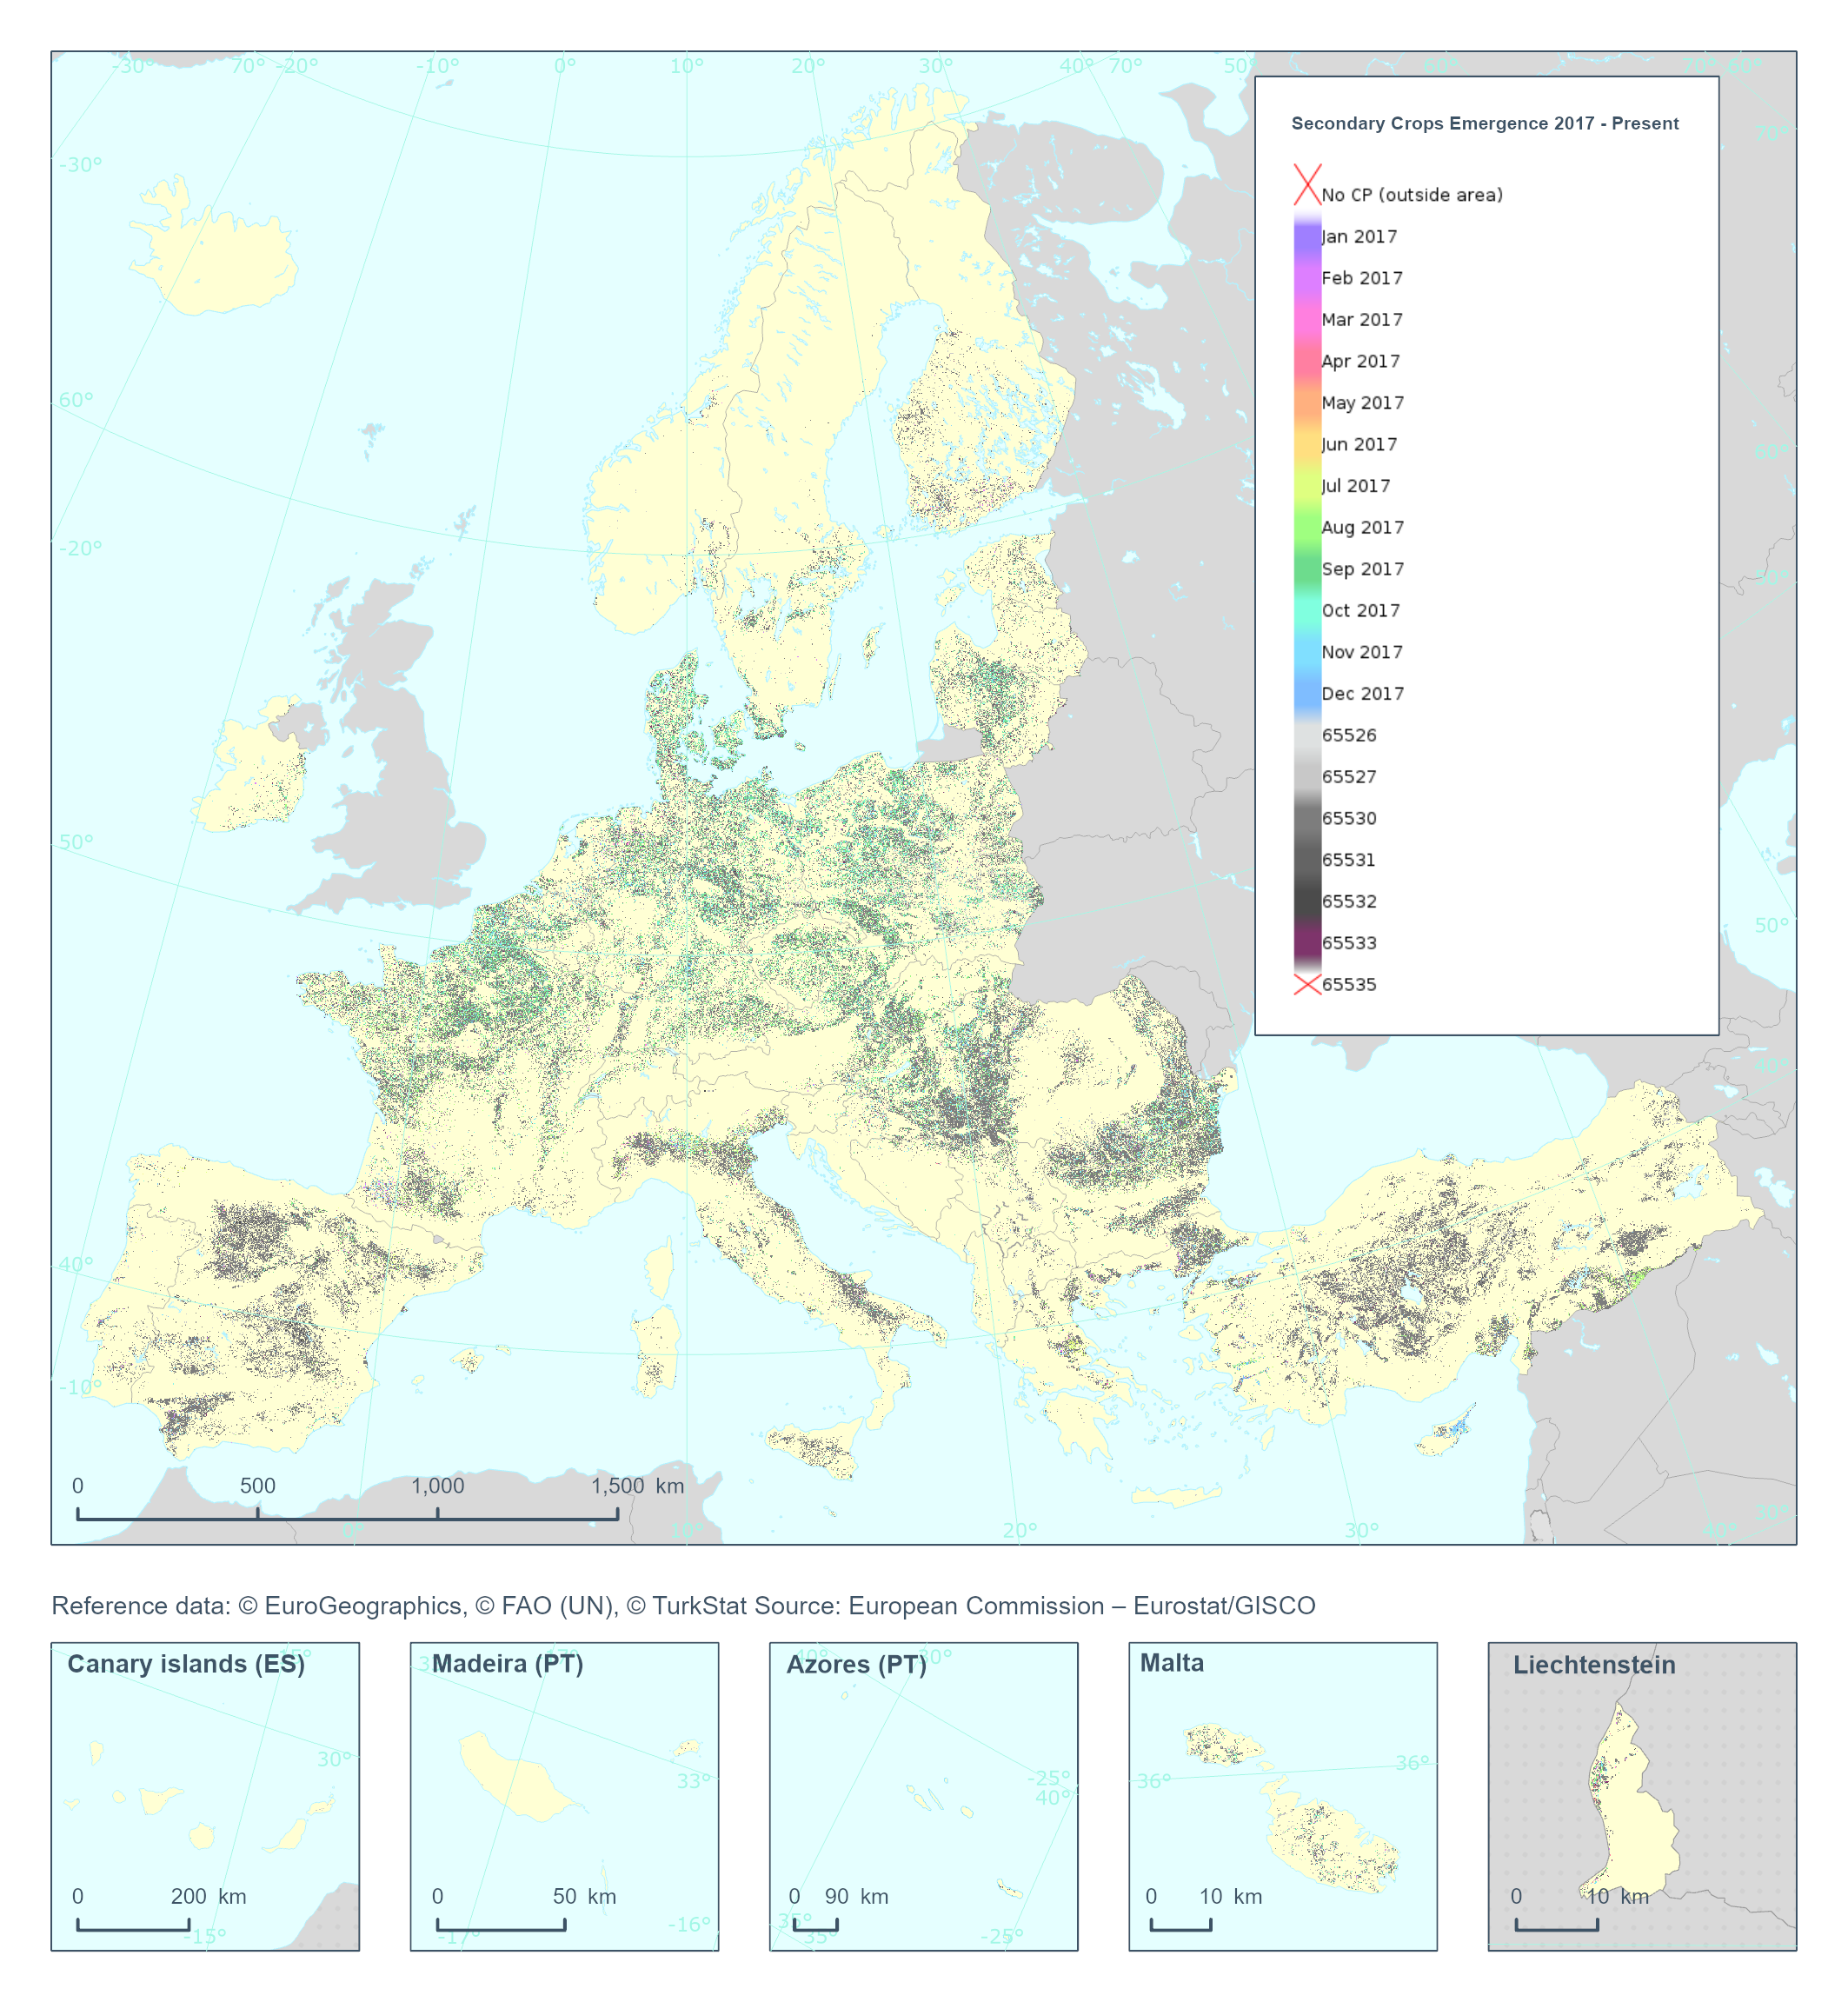
The High Resolution Layer Cropping Patterns - Secondary Crop Emergence (CPSCE) raster product provides the date of emergence of the cover crop in days of the year (DOY). YYDOY where YY = last 2 digits of the year (e.g. 19 for 2019) and DOY is the day of the year (1-365) This dataset is provided annually starting in 2017 with 10 meter rasters (fully conformant with the EEA reference grid) in 100 x 100 km tiles covering the EEA38 countries. High Resolution Layer Croplands product is part of the European Union’s Copernicus Land Monitoring Service. Confidence layer available for the dataset. This dataset includes data from the French Overseas Territories (DOMs)
-

The Urban Atlas provides pan-European comparable land use and land cover data for Functional Urban Areas (FUA). The Street Tree Layer (STL) is a separate layer from the Urban Atlas 2012 LU/LC layer produced within the level 1 urban mask for each FUA. It includes contiguous rows or a patches of trees covering 500 m² or more and with a minimum width of 10 meter over "Artificial surfaces" (nomenclature class 1) inside FUA (i.e. rows of trees along the road network outside urban areas or forest adjacent to urban areas should not be included). Urban Atlas is a joint initiative of the European Commission Directorate-General for Regional and Urban Policy and the Directorate-General for Enterprise and Industry in the frame of the EU Copernicus programme, with the support of the European Space Agency and the European Environment Agency.
-
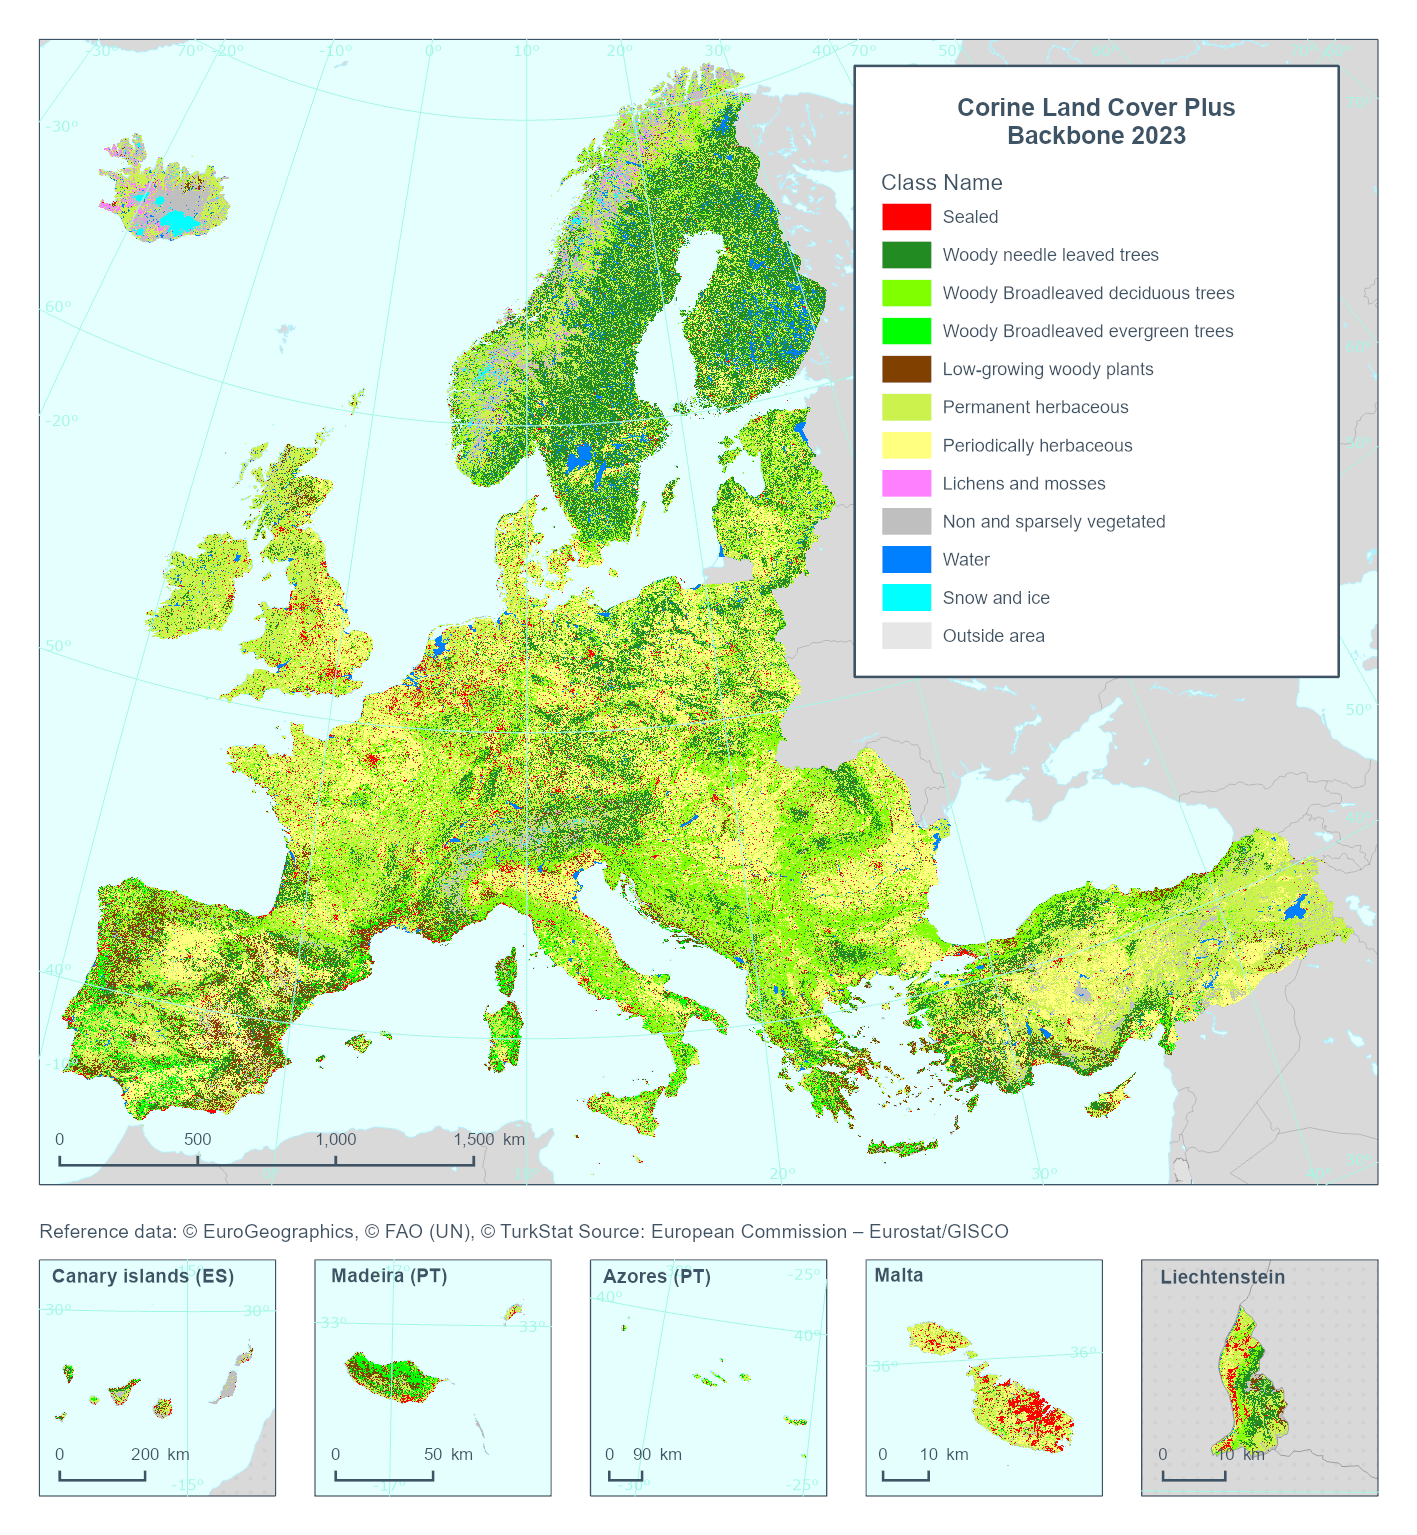
This metadata refers to the Corine Land Cover plus Backbone (CLCplus Backbone), a spatially detailed, large-scale, Earth Observation-based land cover inventory which is produced by the Copernicus Land Monitoring Service (CLMS). The CLCplus Backbone is a high-resolution raster land cover map based on Sentinel-2 satellite time series. Each 10m-pixel contains the dominant land cover among the 11 basic land cover classes. See pixel class codes in the 'Additional Information' section below. The product is available from the 2018 reference year, with a first update produced for the 2021 reference year and moved to an update cycle of 2 years from 2021 onwards.
-
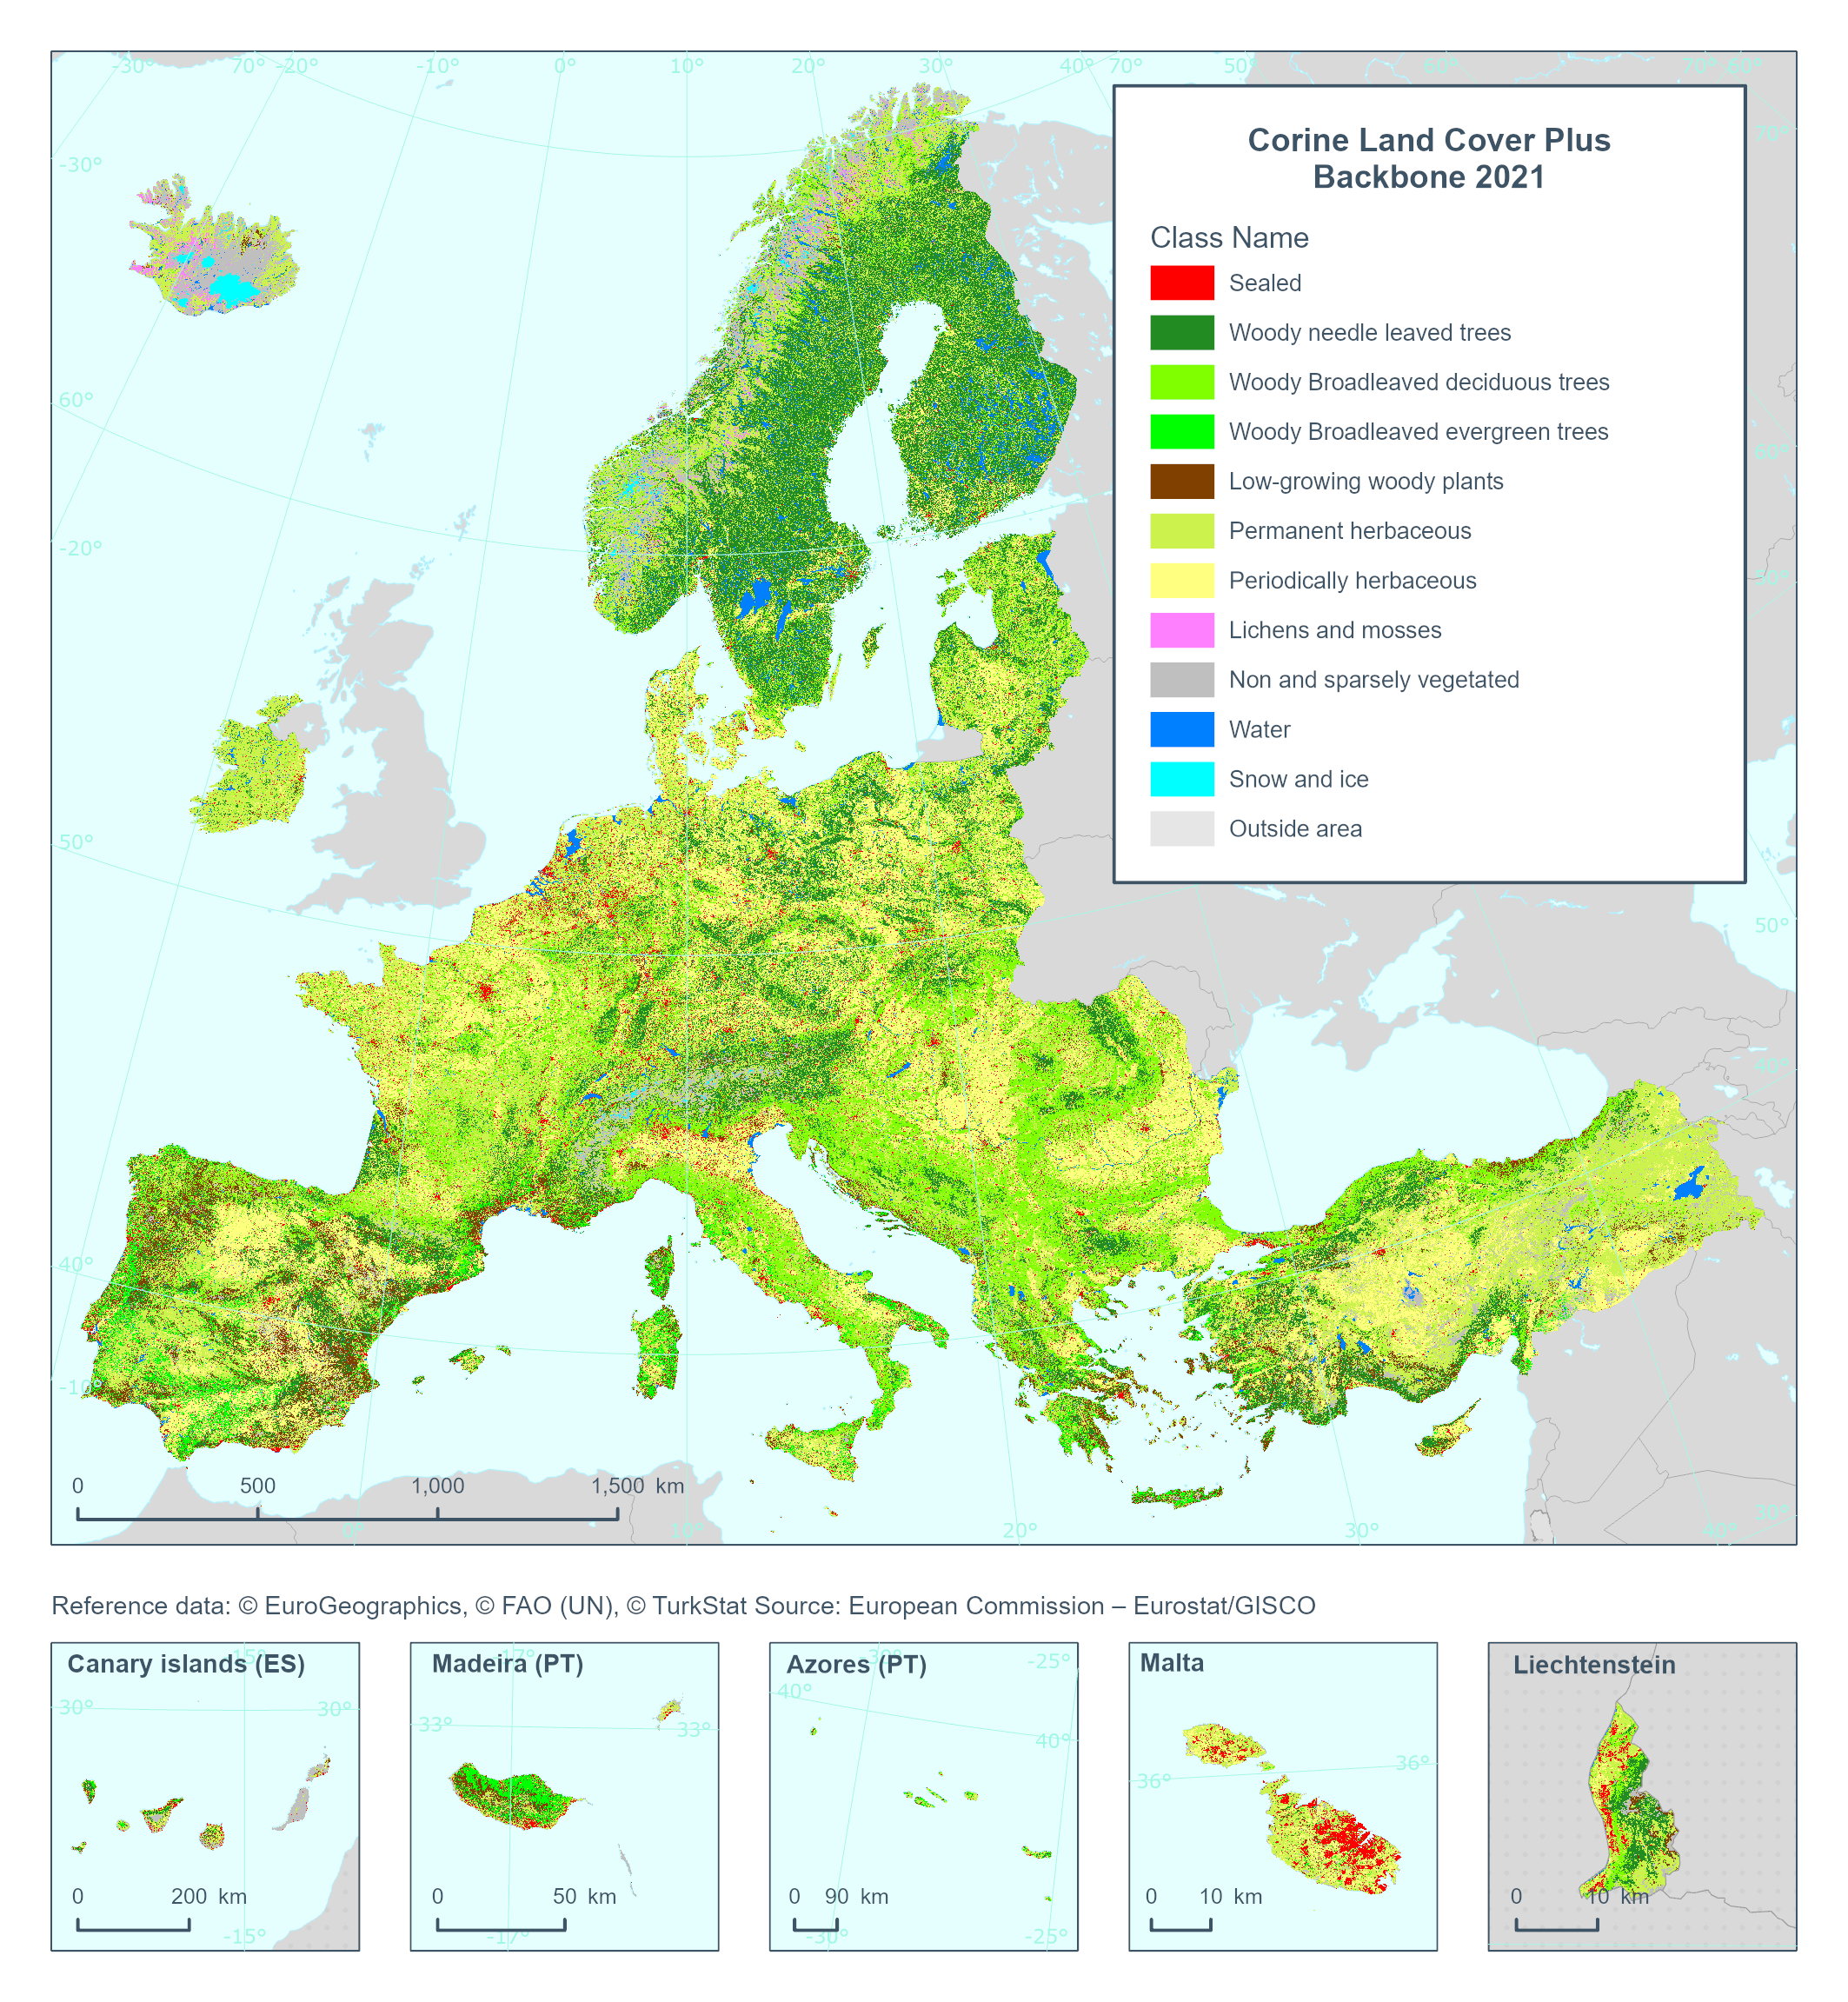
This metadata refers to the 'Corine Land Cover plus Backbone' (CLCplus Backbone), a spatially detailed, large-scale, Earth Observation-based land cover inventory which is produced by the Copernicus Land Monitoring Service (CLMS). The CLCplus Backbone is a 10m pixel-based land cover map based on Sentinel satellite time series. Each pixel contains the dominant land cover among the 11 basic land cover classes. See pixel class codes in the additional information section. The product has an update cycle of three years and starting from the 2018 reference year. The update cycle for future products (from 2021 reference year onwards) will be 2 years.
-

The Imperviousness Density (IMD) 2021 layer is part of the High Resolution Layer (HRL) Imperviousness and contains the approximate density of artificial sealing per pixel (range: 0-100%) for the reference year 2021 as derived from Sentinel-2 image time series. The production of the HRL Imperviousness is coordinated by EEA in the frame of Copernicus, the Earth observation component of the European Union’s Space programme. The product is a raster dataset with 10-meter grid spacing (spatial resolution) that covers the 38 Eionet member and cooperating countries as well as the United Kingdom (i.e. EEA38+UK). It is distributed as 100 x 100 km tiles that are fully conformant with the EEA reference grid.