 Arctic SDI catalogue
Aquatic ecosystems
Type of resources
Available actions
Topics
Keywords
Contact for the resource
Provided by
Years
Formats
Representation types
Update frequencies
status
Service types
-
-
-
This dataset was designed for Environment and Climate Change Canada's (ECCC) National Environmental Emergencies Center (NEEC) for oil spill preparedness and response. The polygons of this layer were selected from the surface geodatabase of coastal ecosystems from the UQAR-MPO project Mapping coastal ecosystems of the Estuary and Gulf of St. Lawrence. Are represented in this dataset exclusively the polygons whose plant dominance corresponds to a class of macroalgae and presenting a semi-vegetated (25-75%) or vegetated (75-100%) cover. The study area includes all of the estuarine and maritime coasts of Quebec, with the exception of certain sectors, including most of the Lower North Shore and Anticosti Island, with the exception of villages of Kegaska, la Romaine, Chevery, Blanc-Sablon and Port-Menier. Some islands off the estuary and gulf coasts are part of the region covered, such as Île d'Orléans, Isle-aux-Coudres, Île Verte and Île Bonaventure. The mapping of coastal ecosystems was carried out jointly by the Laboratory for Dynamics and Integrated Coastal Zone Management (LDGIZC) of the University of Quebec at Rimouski as part of the Coastal Resilience Project (https: //ldgizc.uqar.ca/Web/projets/projet-resilience-cotiere) funded by the MELCC; and by the Fisheries and Oceans Canada team, as part of its Integrated marine response planning (IMRP) component of the Oceans Protection Plan (OPP),with the objective of updating the Marine Oil Spill Preparedness and Response Regime of Canada. The master geodatabase of coastal ecosystems is hosted and distributed by UQAR on their SIGEC-Web mapping platform: https://ldgizc.uqar.ca/Web/sigecweb The macroalgae characterization was mainly carried out from the photo-interpretation of RGBI aerial photos acquired by the DFO (2015-2020) and oblique helicopter photos acquired by UQAR in 2017. Data from 2959 sampling stations, conducted aboard small boats during DFO field campaigns (2017-2021) were used to detail the nature of algal communities and validate the photo-interpretation. Credits © UQAR-MPO (2023, Laboratoire de dynamique et de gestion intégrée des zones côtières, Pêches et Océans Canada) Provencher-Nolet, L., Paquette, L., Pitre, L.D., Grégoire, B. and Desjardins, C. 2024. Cartographie des macrophytes estuariens et marins du Québec. Rapp. Tech. Can. Sci. halieut. Aquat. 3617 : v + 99 p. Grégoire, B., Pitre, L.D., Provencher-Nolet, L., Paquette, L. and Desjardins, C. 2024. Distribution d’organismes marins de la zone côtière peu profonde du Québec recensés par imagerie sous-marine de 2017 à 2021. Rapp. tech. can. sci. halieut. aquat. 3616 : v + 78 p. Grégoire, B. 2022. Biodiversité du relevé côtier Planification pour une intervention environnementale intégrée dans l’estuaire et le golfe du Saint-Laurent (2017–2021). Observatoire global du Saint-Laurent. [Jeu de données] Jobin, A., Marquis, G., Provencher-Nolet, L., Gabaj Castrillo. M. J., Trubiano C., Drouet, M., Eustache-Létourneau, D., Drejza, S. Fraser, C. Marie, G. et P. Bernatchez (2021) Cartographie des écosystèmes côtiers du Québec maritime — Rapport méthodologique. Chaire de recherche en géoscience côtière, Laboratoire de dynamique et de gestion intégrée des zones côtières, Université du Québec à Rimouski. Rapport remis au ministère de l’Environnement et de la Lutte contre les changements climatiques, septembre 2021, 98 p.
-

This shapefile dataset was designed using polygons extracted from the Cartography of Coastal Ecosystems of Maritime Quebec geodatabase (2022, Laboratory for Dynamics and Integrated Management of Coastal Zones, Fisheries and Oceans Canada), described in the paragraph below. It consists of polygons with eelgrass and incorporates attributes describing the vegetation cover, the composition of the seagrass beds, the associated ecosystem name, the imagery data that allowed photo-interpretation and the presence or absence of field data. A unique sequence number associated with each polygon makes it possible to trace the paired polygon of the geodatabase of coastal ecosystems to attribute values not detailed in this shapefile. The study area includes all of the estuarine and maritime coasts of Quebec, with the exception of certain sectors, including most of the Lower North Shore and Anticosti Island, with the exception of villages of Kegaska, la Romaine, Chevery, Blanc-Sablon and Port-Menier. Some islands off the estuary and gulf coasts are part of the region covered, such as Île d'Orléans, Isle-aux-Coudres, Île Verte and Île Bonaventure. The Mapping of Coastal Ecosystems of Maritime Quebec was carried out jointly by the Laboratory for Dynamics and Integrated Coastal Zone Management (LDGIZC) of the University of Quebec at Rimouski as part of the Coastal Resilience Project; and by the Fisheries and Oceans Canada team, as part of the Integrated Marine Response Planning Program (IMRP). A classification of coastal ecosystems was carried out on more than 4,200 km of coastal corridor, focusing on estuarine and maritime coasts of Quebec located between the limit of the upper foreshore and the shallow infralittoral (about 10m deep). The mapping method developed is based on semi-automated segmentation and a photo-interpretation of coastal ecosystems, using very high resolution multispectral photographs (RBVI) acquired between 2015 and 2020 by DFO. The classification of polygons is based on the assignment of predefined value classes for the biological and physical attributes under study (e.g., substrates, plant type, vegetation cover, geosystem, etc. ). Helicopter-born oblique photographs and field data helped to reduce the uncertainty associated with photo-interpretation. UQAR and DFO conducted field sampling campaigns targeting the mediolittoral (4,390 stations) and the lower mediolittoral and infralittoral zones (2,959 stations), respectively , which validated some of the attributes identified by photo-interpretation and provided detailed information on community structure . The geodatabase of the Mapping of coastal ecosystems is hosted and managed by UQAR on their SIGEC-Web cartographic platform: https://ldgizc.uqar.ca/Web/sigecweb Credits © DFO (2023, Fisheries and Oceans Canada) Provencher-Nolet, L., Paquette, L., Pitre, L.D., Grégoire, B. and Desjardins, C. 2024. Cartographie des macrophytes estuariens et marins du Québec. Rapp. Tech. Can. Sci. halieut. Aquat. 3617 : v + 99 p. Grégoire, B., Pitre, L.D., Provencher-Nolet, L., Paquette, L. and Desjardins, C. 2024. Distribution d’organismes marins de la zone côtière peu profonde du Québec recensés par imagerie sous-marine de 2017 à 2021. Rapp. tech. can. sci. halieut. aquat. 3616 : v + 78 p. Grégoire, B. 2022. Biodiversité du relevé côtier Planification pour une intervention environnementale intégrée dans l’estuaire et le golfe du Saint-Laurent (2017–2021). Observatoire global du Saint-Laurent. [Jeu de données] Jobin, A., Marquis, G., Provencher-Nolet, L., Gabaj Castrillo. M. J., Trubiano C., Drouet, M., Eustache-Létourneau, D., Drejza, S. Fraser, C. Marie, G. et P. Bernatchez (2021) Cartographie des écosystèmes côtiers du Québec maritime — Rapport méthodologique. Chaire de recherche en géoscience côtière, Laboratoire de dynamique et de gestion intégrée des zones côtières, Université du Québec à Rimouski. Rapport remis au ministère de l’Environnement et de la Lutte contre les changements climatiques, septembre 2021, 98 p.
-
This dataset was designed for Environment and Climate Change Canada's (ECCC) National Environmental Emergencies Center (NEEC) for oil spill preparedness and response. The polygons from this layer come from the coastal ecosystems geodatabase as part of the Mapping of coastal ecosystems of the Estuary and Gulf of St. Lawrence project. This layer represents semi-vegetated (25-75%) and vegetated (75-100%) zones of which marsh vegetation is the dominant. The study area includes all of the estuarine and maritime coasts of Quebec, with the exception of certain sectors, including most of the Lower North Shore and Anticosti Island, with the exception of villages of Kegaska, la Romaine, Chevery, Blanc-Sablon and Port-Menier. Some islands off the estuary and gulf coasts are part of the region covered, such as Île d'Orléans, Isle-aux-Coudres, Île Verte and Île Bonaventure. The mapping of coastal ecosystems was carried out jointly by the Laboratory for Dynamics and Integrated Coastal Zone Management (LDGIZC) of the University of Quebec at Rimouski as part of the Coastal Resilience Project (https: //ldgizc.uqar.ca/Web/projets/projet-resilience-cotiere) funded by the MELCC; and by the Fisheries and Oceans Canada team, as part of its Integrated marine response planning (IMRP) component of the Oceans Protection Plan (OPP), with the objective of updating the Marine Oil Spill Preparedness and Response Regime of Canada. The master geodatabase of coastal ecosystems is hosted and distributed by UQAR on their SIGEC-Web mapping platform: https://ldgizc.uqar.ca/Web/sigecweb The characterization of marshes was mainly carried out using photo-interpretation of RVBI aerial photos acquired by DFO (2015-2020) and oblique photos taken by helicopter acquired by UQAR in 2017. This dataset also includes the information from validation stations visited by UQAR (2018-2020), used to validate and refine the photo-interpretation.
-

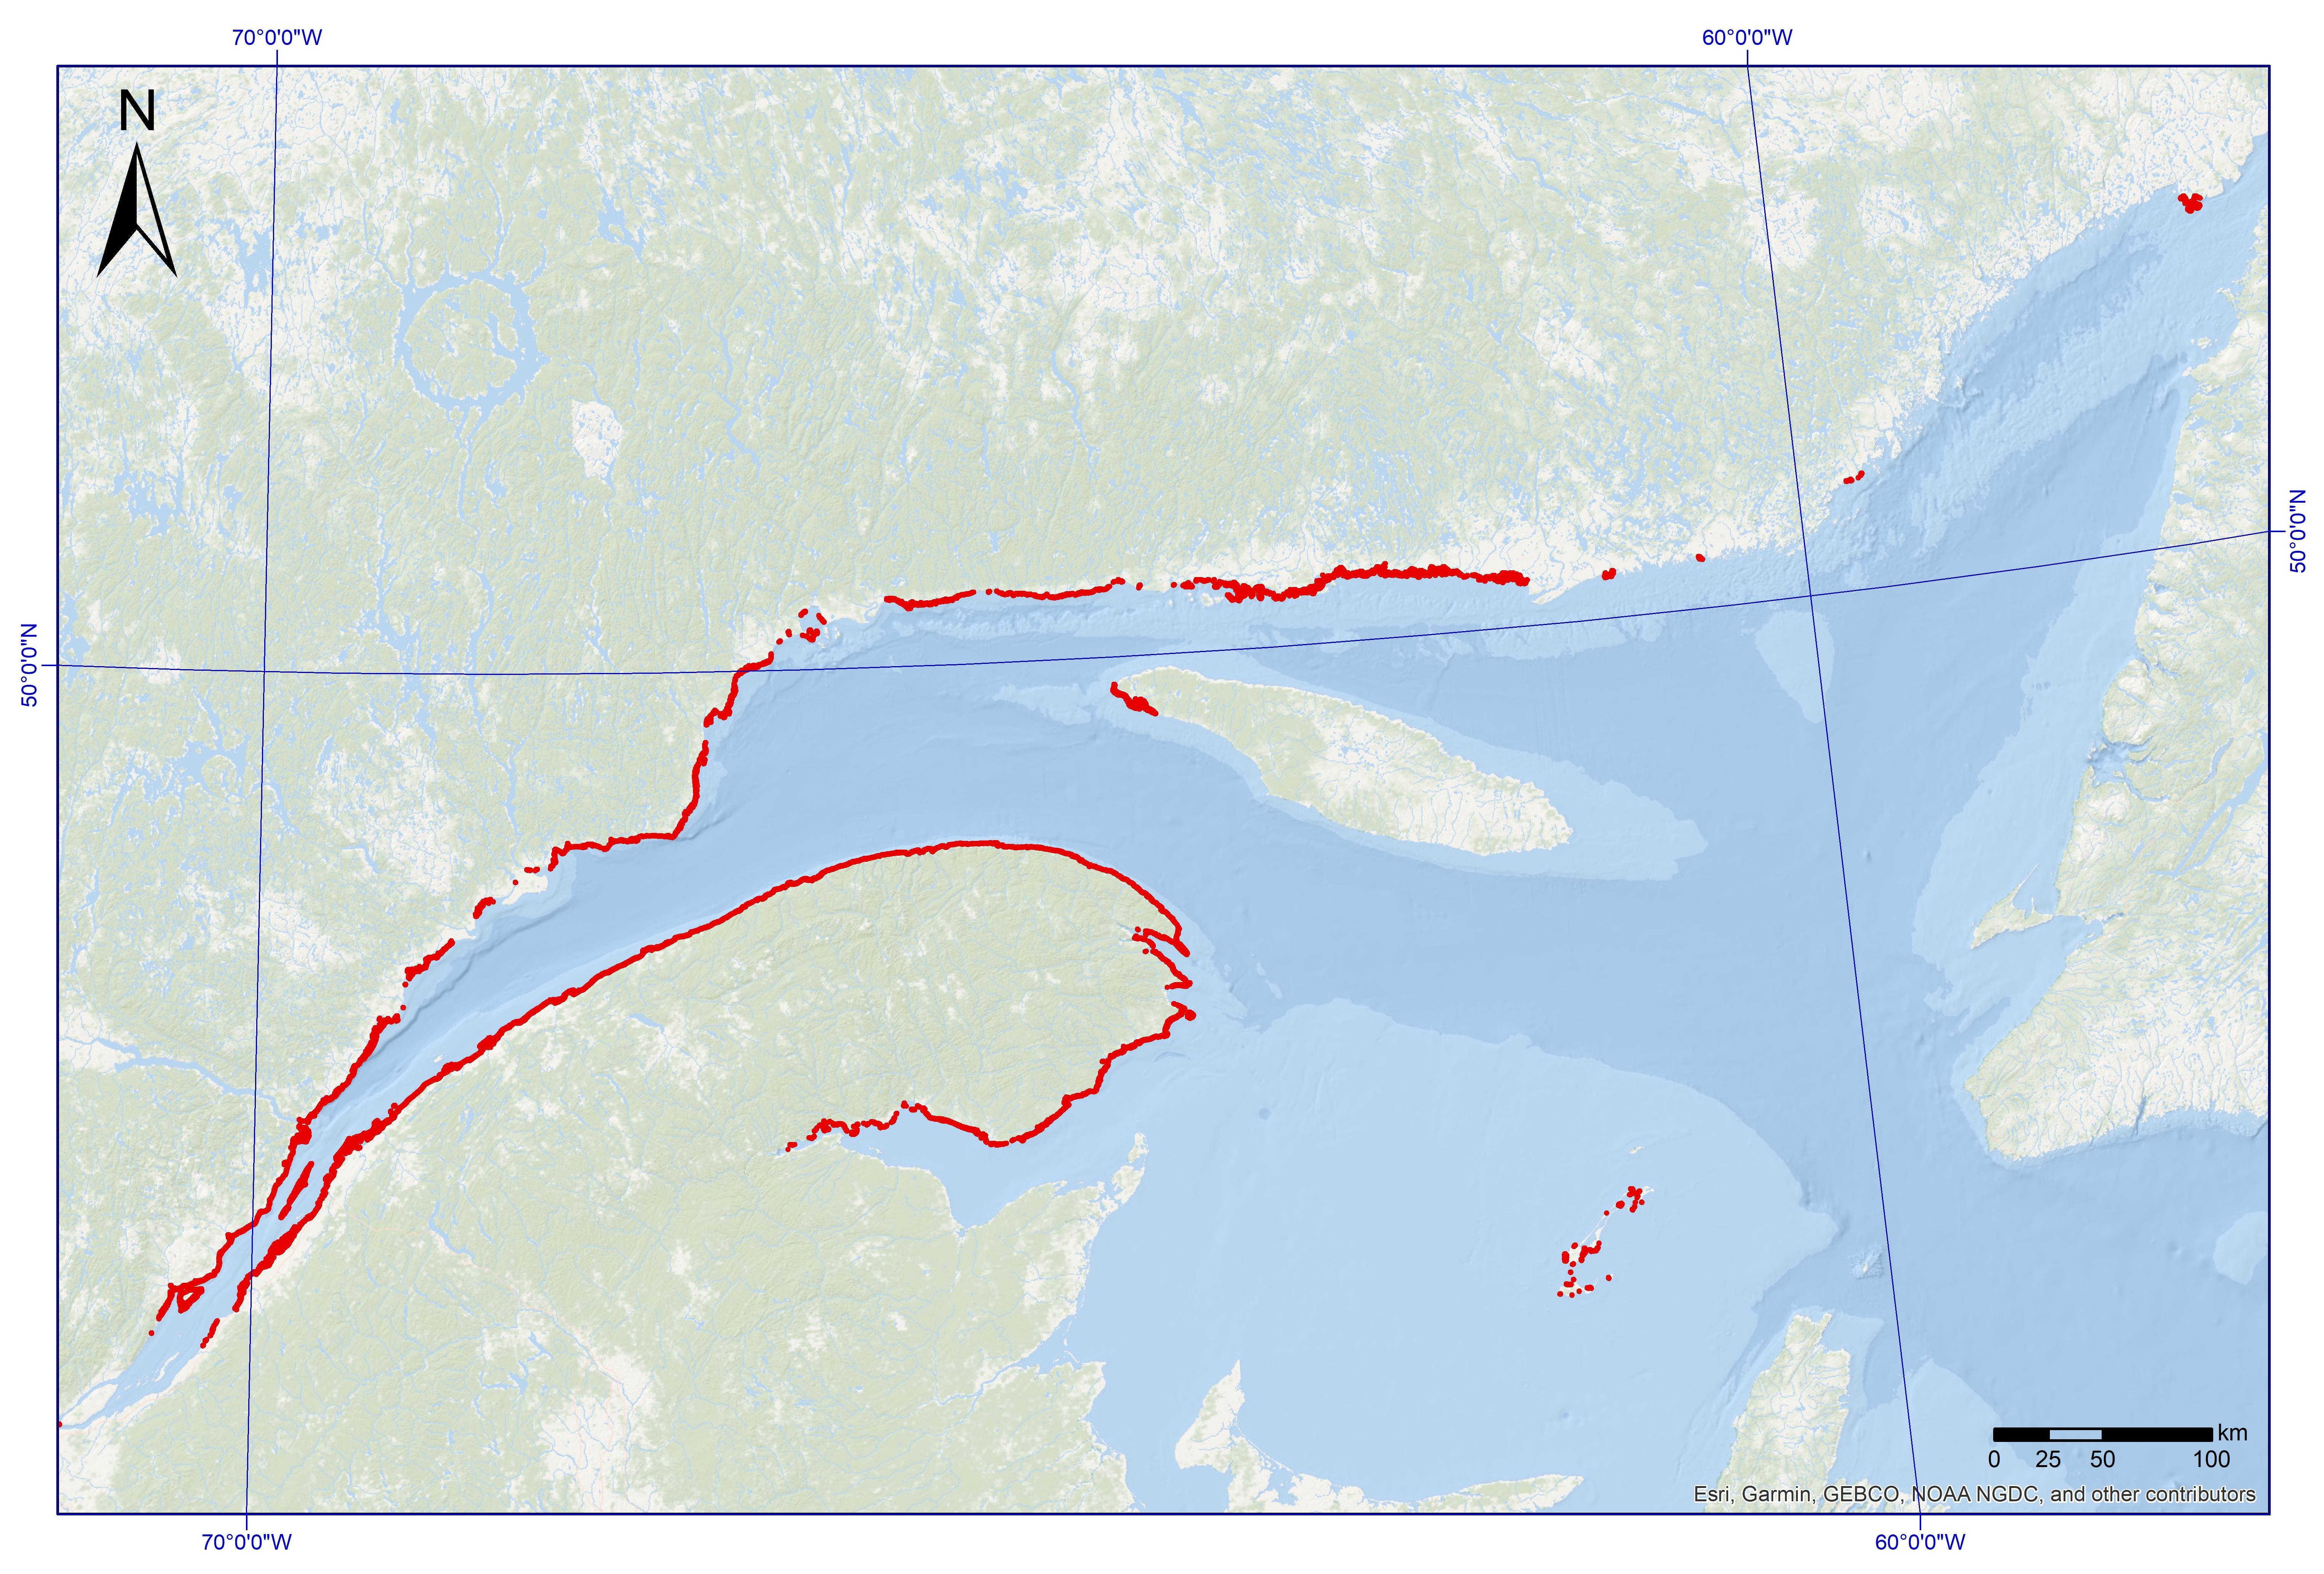
A research survey on Stimpson's surfclam (Mactromeris polynyma) was conducted from June 15 to June 26 2017 in the Estuary of the St. Lawrence River on the Forestville deposit (Fishing Area 1A). The primary objective of this survey was to investigate the spatial distribution of pre-commercial (< 80 mm) and commercial (≥ 80 mm) sizes of Stimpson's surfclams as well as to assess the abundance and diversity of benthic species associated with the sandy habitat of the Stimpson's surfclam. Only benthic species data associated with Stimpson's surfclam habitat are presented in this dataset. Data were collected according to a systematic sampling design consisting of 77 stations, between 7 and 45 m depth. Stations were spaced 200 m apart and dispersed along a total of 18 transects perpendicular to the bathymetry. Transects were parallel and spaced 500 m apart. Specimens were collected using a hydraulic dredge of the "New England" type with a total length of 2.29 meters and a total width of 1.68 meters, of which 1.35 meters was knife width. The dredge was lined with a 19 millimeter mesh Vexar™ to harvest small individuals. The hauls were made at a speed of 0.2-0.3 knots for a duration of 2 to 3 minutes. Start and end positions were recorded to calculate the distance traveled at each tow using the geosphere library in R. The average tow distance was approximately 25 m. The area covered at each stroke was the product of the width of the dredge blade and the distance. The three files provided (DarwinCore format) are complementary and are linked by the "eventID" key. The "event_information" file includes generic event information, including date and location. The "additional_information_event_and_occurrence" file includes sample size, sampling protocol and sampling effort, among others. The "taxon_occurrence" file includes the taxonomy of the species observed, identified to the species or lowest possible taxonomic level. For abundance and biomass estimates, contact Virginie Roy (virginie.roy@dfo-mpo.gc.ca). For quality controls, all taxonomic names were checked against the World Register of Marine Species (WoRMS) to match recognized standards. The WoRMS match was placed in the "scientificNameID" field of the occurrence file. Special cases were noted in "identificationRemarks" and selected specimens were confirmed using field photos. Data quality checks were performed using the R obistools and worrms libraries. All sampling locations were spatially validated.
-
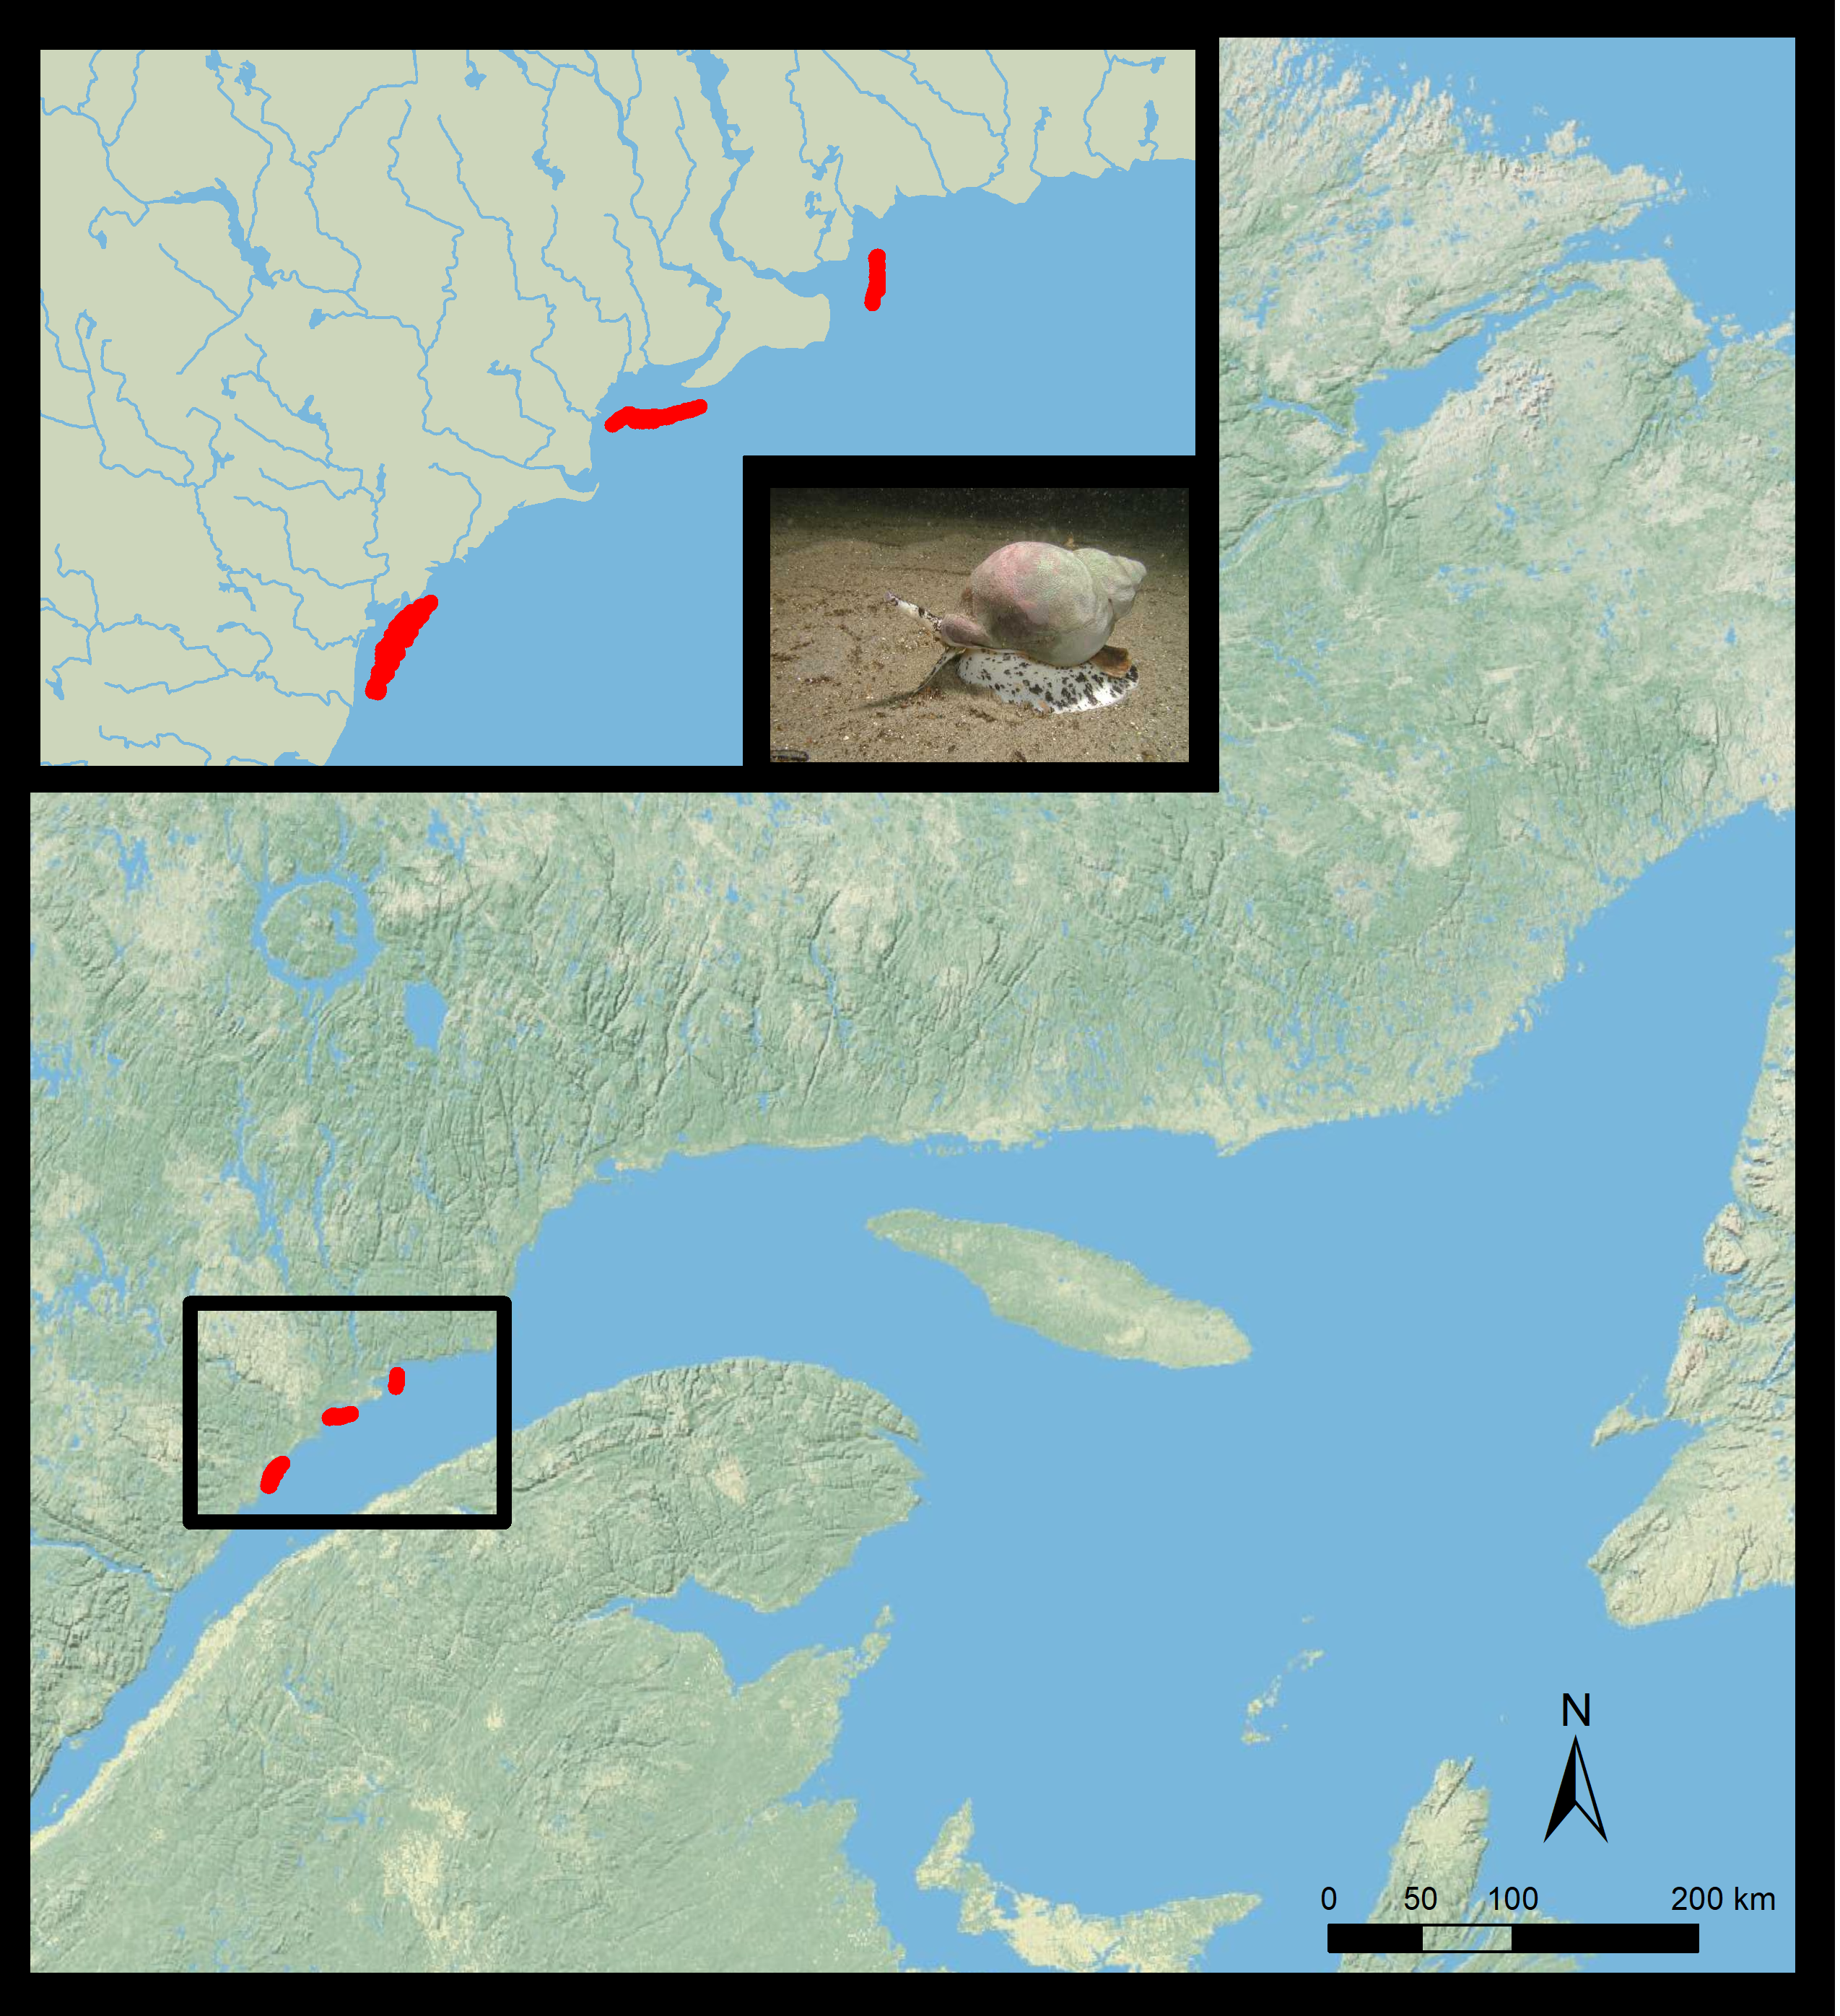
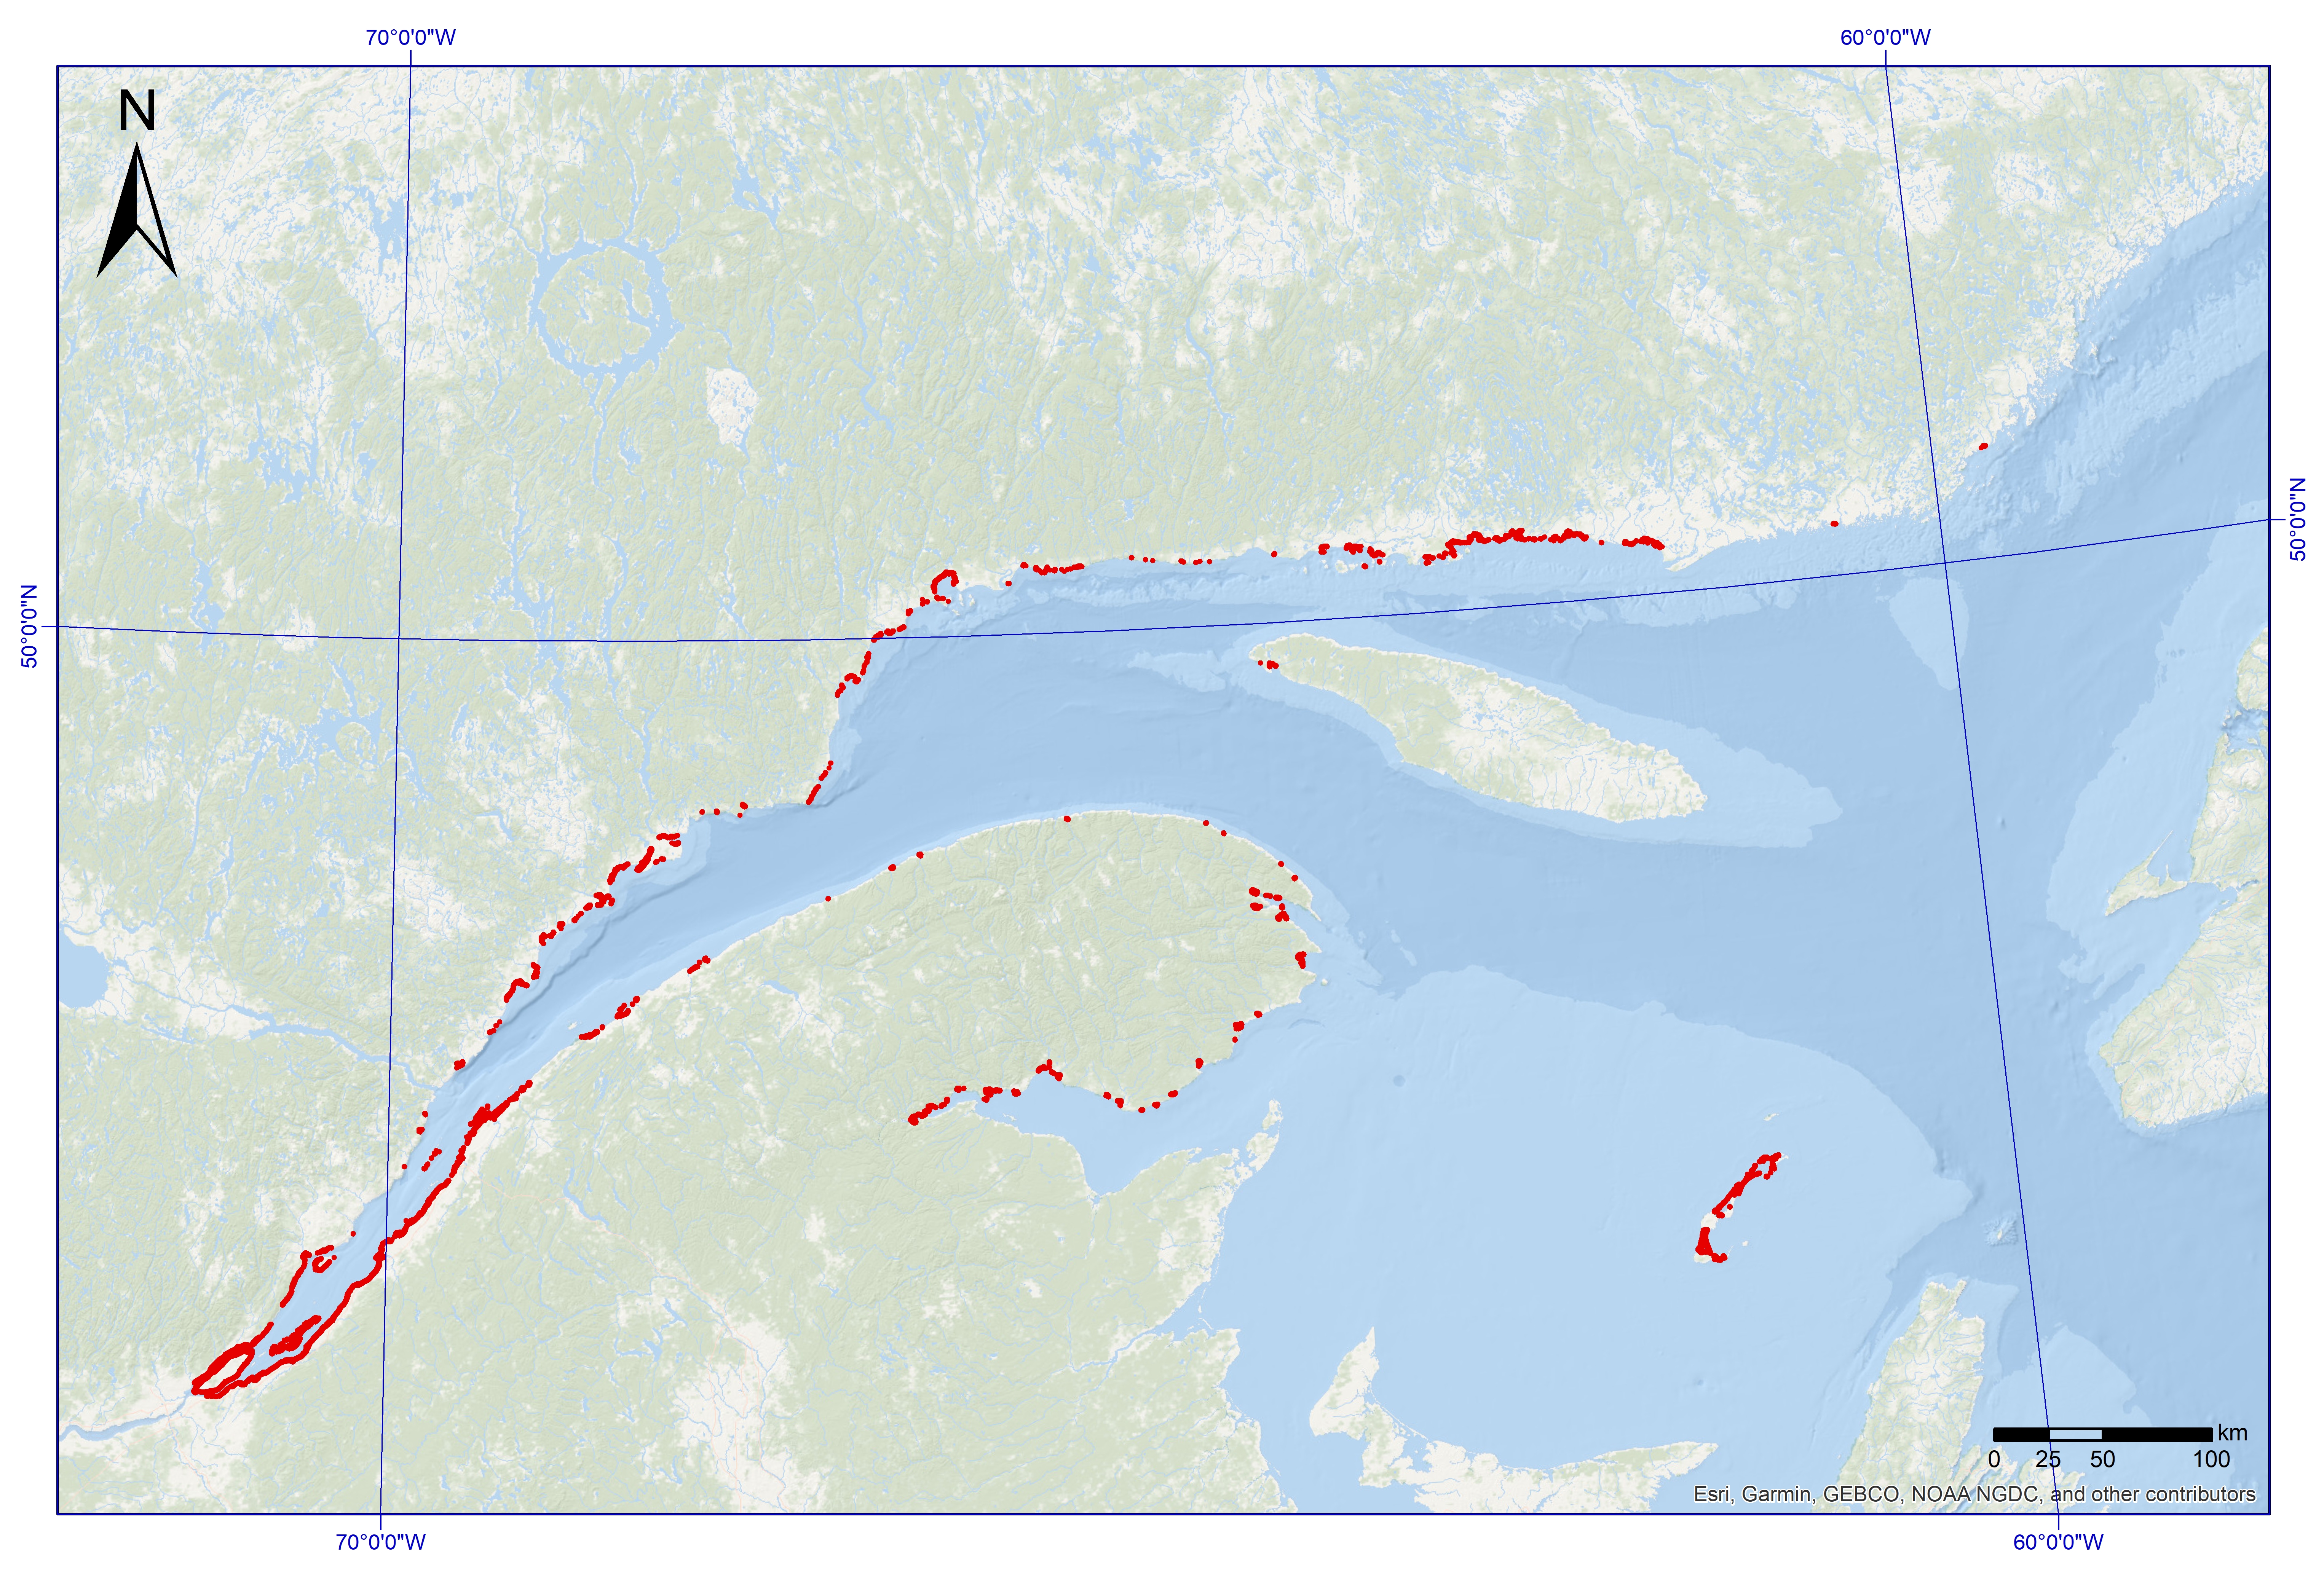
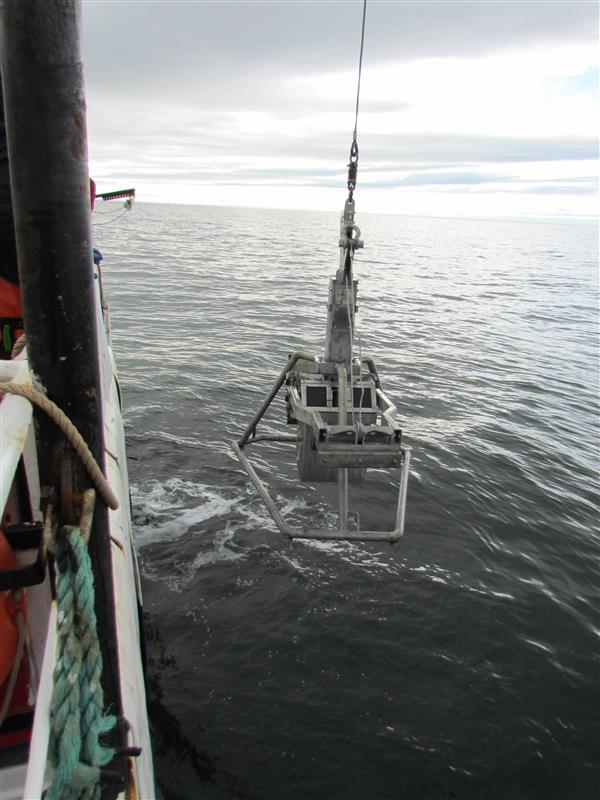
A research survey on the common whelk (Buccinum undatum) has been conducted biennially in three sectors of the St. Lawrence Estuary since 2005 to assess the abundance of whelk and benthic species associated with whelk habitat. Only data for benthic species associated with whelk habitat are presented in this dataset. The survey was initiated in 2005 following the intensive fishery of the early 2000s in the Upper North Shore region. The three sectors covered by the survey were based on the distribution of commercial fishing effort from 2001 to 2004. Surveys were conducted between mid-July and early August from 2005 to 2019 on the North Shore of the St. Lawrence Estuary between Portneuf-sur-Mer and Baie-Comeau according to a fixed station sampling design. Three sectors were surveyed at each survey: Forestville (69°03'11"W-48°39'24"N and 68°56'02"W-48°46'16"N), Pointe-aux-Outardes (68°35'53"W-48°59'32"N and 68°25'30"W-49°01'06"N) and Baie-Comeau (68°06'04"W-49°08'40"N and 68°05'10"W-49°12'26"N). Since 2007, the sampling plan consists of 55 stations in Forestville, 26 stations in Pointe-aux-Outardes and 11 stations in Baie-Comeau. The targeted depth interval at the three sectors was approximately 5 to 40 m. Specimens were collected using a Digby-type scallop dredge with a total width of 3.04 m consisting of four 19 mm mesh Vexar™ lined baskets to harvest small individuals. Start and end positions were recorded to calculate the distance traveled at each tow using the geosphere library in R. Since 2011, the average tow distance was approximately 300 m. The area covered at each tow was the product of the dredge width and distance. The three files provided (DarwinCore format) are complementary and are linked by the "eventID" key. The "event_information" file includes generic event information, including date and location. The "additional_information_event_and_occurrence" file includes sample size, sampling protocol and sampling effort, among others. The "taxon_occurrence" file includes the taxonomy of the species observed, identified to the species or lowest possible taxonomic level. For abundance and biomass estimates, contact Virginie Roy (virginie.roy@dfo-mpo.gc.ca). For quality controls, all taxonomic names were checked against the World Register of Marine Species (WoRMS) to match recognized standards. The WoRMS match was placed in the "scientificNameID" field of the occurrence file. Special cases were noted in "identificationRemarks" and selected specimens were confirmed using field photos. Data quality checks were performed using the R obistools and worrms libraries. All sampling locations were spatially validated.
-

Kelp features were taken from digitized survey source fieldsheets produced by the Canadian Hydrographic Service (CHS). The area covered by this dataset encompasses various surveyed areas along the western coast of North America in British Columbia coastal waters. CHS has an extensive collection of hydrographic survey data in the form of field sheets based on over 100 years of surveying in Canada. Data has been collected using a wide range of methods and systems, from lead-line to modern day multi-transducer and multibeam systems. Positions have been established using the different types of terrestrial systems and methods available over many years - up to the latest advanced satellite positioning systems. Fieldsheets that had not been previously digitizted were imported into ESRI ArcMap and georeferenced directly to WGS84 using CHS georeferencing standards and principles (charts.gc.ca). In order to minimize error, a hierarchy of control points was used, ranging from high survey order control points to comparing conspicuous stable rock features apparent in satellite imagery. The georeferencing result was further validated against satellite imagery, CHS charts and fieldsheets, the CHS-Pacific High Water Line (charts.gc.ca), and adjacent and overlapping Fieldsheets. Finally, the kelp features were digitized, and corresponding chart information (category of kelp, scale, source, title, year, and comments) was added as attributes to each feature. When digitizing kelp features the points were located at the optical center of the feature being digitized. This dataset includes a point and a polygon layer. Kelp that is located on land is historically valid. Symbolized kelp is not always an exact location but indicates that kelp is present in the area. The symbol is a proxy. The kelp attribute field does not distinguish between different types of kelp. The field has three variables that are kelp, seaweed and Aquatic Plants. Seaweed is the general name for marine plants of the Algae class which grow in long narrow ribbons. (International Maritime Dictionary, 2nd Ed.) Kelp is one of an order (laminariales) of usually large, blade-shaped or vine-like brown algae. (IHO Dictionary, S-32, 5th Edition, 2611) Aquatic Plants – Aquatic plants are used as to represent vegetation in fresh water rivers and lakes. Geographically encompasses the kelp in the Western Coastal waters of North America (mainly Canada) and Temporally overlaps/continues from data extracted from the British Admiralties.
-
This dataset documents the infauna occurrences collected from 2021 to 2023 during the Canadian Beaufort Sea Marine Ecosystem Assessment (CBS-MEA) conducted by the Department of Fisheries and Oceans (DFO). This scientific program focuses on the integration of oceanography, food web linkages, physical-biological couplings, and spatial and interannual variabilities.The program also aims to expand the baseline coverage of species diversity, abundances, and habitat associations in previously unstudied areas of the Beaufort Sea and Western Canadian Archipelago. The study took place mainly in the Canadian Beaufort Sea and the Amundsen Gulf. Sampling is done along transects at fixed stations in the study area. Catches are collected using a 50 x 50 cm box-corer. 2 or 3 box core is collected per station to obtain replicates. A total of 29 stations were sampled for infauna in 2021, 15 in 2022 and 25 in 2023 between 10-653 m depth. Half of the box corer (0.125 m2) is sampled for infauna taxonomy. The first 20 cm of sediment are collected and sieved through a 0.5 mm mesh sieve. The samples are preserved in seawater-formaldehyde solution (10 % v/v). In the lab, infauna is identified to the lowest taxon level possible. The data are presented in two files: The "Activité_endofaune_CBSMEA_infauna_event_en" file which contains information about missions, stations and deployments, which are presented under a hierarchical activity structure. The "Occurrence_endofaune_CBSMEA_infauna_en" file that contains the taxonomic occurrences.
-

A research survey on snow crab (Chionoecetes opilio) was conducted from July 1 to July 17, 2018 on the Lower North Shore of the Gulf of St. Lawrence between Havre-Saint-Pierre and Blanc-Sablon. The main objective of this survey was to assess the abundance of snow crab and benthic species associated with snow crab habitat. Only data for benthic species associated with snow crab habitat are presented in this dataset. Data were collected according to a fixed station sampling design consisting of 61 stations, between 46 and 230 meters depth. Specimens were collected using a beam trawl with a total width of 2.8 meters and a total height of 0.76 meters. The codend was lined with a 16 millimeter stretched mesh net in order to harvest the small individuals. The hauls were made at a target speed of 2 knots and a target duration of 10 minutes depending on seabed conditions. Start and end positions were recorded to calculate the distance traveled on each tow using the geosphere library in R. The average tow distance was approximately 25 m. The area covered at each tow was the product of the trawl opening and the distance traveled. The two files provided (DarwinCore format) are complementary and are linked by the "eventID" key. The "Activity_Information" file includes generic activity information, including date and location. The "occurrence_taxon" file includes the taxonomy of the species observed, identified to the species or lowest possible taxonomic level. To obtain the abundance and biomass assessment, contact Cedric Juillet (cedric.juillet@dfo-mpo.gc.ca). For quality controls, all taxonomic names were checked against the World Register of Marine Species (WoRMS) to match recognized standards. The WoRMS match was placed in the "ScientificIDname" field of the occurrence file. Special cases were noted in the "commentsIdentification" field and selected specimens were confirmed with field photos. Data quality checks were performed using the R obistools and Worms libraries. All sampling locations were spatially validated.