 Arctic SDI catalogue
Aquatic ecosystems
Type of resources
Available actions
Topics
Keywords
Contact for the resource
Provided by
Years
Formats
Representation types
Update frequencies
status
Service types
-
-
-

This shapefile dataset was designed using polygons extracted from the Cartography of Coastal Ecosystems of Maritime Quebec geodatabase (2022, Laboratory for Dynamics and Integrated Management of Coastal Zones, Fisheries and Oceans Canada), described in the paragraph below. It consists of polygons with eelgrass and incorporates attributes describing the vegetation cover, the composition of the seagrass beds, the associated ecosystem name, the imagery data that allowed photo-interpretation and the presence or absence of field data. A unique sequence number associated with each polygon makes it possible to trace the paired polygon of the geodatabase of coastal ecosystems to attribute values not detailed in this shapefile. The study area includes all of the estuarine and maritime coasts of Quebec, with the exception of certain sectors, including most of the Lower North Shore and Anticosti Island, with the exception of villages of Kegaska, la Romaine, Chevery, Blanc-Sablon and Port-Menier. Some islands off the estuary and gulf coasts are part of the region covered, such as Île d'Orléans, Isle-aux-Coudres, Île Verte and Île Bonaventure. The Mapping of Coastal Ecosystems of Maritime Quebec was carried out jointly by the Laboratory for Dynamics and Integrated Coastal Zone Management (LDGIZC) of the University of Quebec at Rimouski as part of the Coastal Resilience Project; and by the Fisheries and Oceans Canada team, as part of the Integrated Marine Response Planning Program (IMRP). A classification of coastal ecosystems was carried out on more than 4,200 km of coastal corridor, focusing on estuarine and maritime coasts of Quebec located between the limit of the upper foreshore and the shallow infralittoral (about 10m deep). The mapping method developed is based on semi-automated segmentation and a photo-interpretation of coastal ecosystems, using very high resolution multispectral photographs (RBVI) acquired between 2015 and 2020 by DFO. The classification of polygons is based on the assignment of predefined value classes for the biological and physical attributes under study (e.g., substrates, plant type, vegetation cover, geosystem, etc. ). Helicopter-born oblique photographs and field data helped to reduce the uncertainty associated with photo-interpretation. UQAR and DFO conducted field sampling campaigns targeting the mediolittoral (4,390 stations) and the lower mediolittoral and infralittoral zones (2,959 stations), respectively , which validated some of the attributes identified by photo-interpretation and provided detailed information on community structure . The geodatabase of the Mapping of coastal ecosystems is hosted and managed by UQAR on their SIGEC-Web cartographic platform: https://ldgizc.uqar.ca/Web/sigecweb Credits © DFO (2023, Fisheries and Oceans Canada) Provencher-Nolet, L., Paquette, L., Pitre, L.D., Grégoire, B. and Desjardins, C. 2024. Cartographie des macrophytes estuariens et marins du Québec. Rapp. Tech. Can. Sci. halieut. Aquat. 3617 : v + 99 p. Grégoire, B., Pitre, L.D., Provencher-Nolet, L., Paquette, L. and Desjardins, C. 2024. Distribution d’organismes marins de la zone côtière peu profonde du Québec recensés par imagerie sous-marine de 2017 à 2021. Rapp. tech. can. sci. halieut. aquat. 3616 : v + 78 p. Grégoire, B. 2022. Biodiversité du relevé côtier Planification pour une intervention environnementale intégrée dans l’estuaire et le golfe du Saint-Laurent (2017–2021). Observatoire global du Saint-Laurent. [Jeu de données] Jobin, A., Marquis, G., Provencher-Nolet, L., Gabaj Castrillo. M. J., Trubiano C., Drouet, M., Eustache-Létourneau, D., Drejza, S. Fraser, C. Marie, G. et P. Bernatchez (2021) Cartographie des écosystèmes côtiers du Québec maritime — Rapport méthodologique. Chaire de recherche en géoscience côtière, Laboratoire de dynamique et de gestion intégrée des zones côtières, Université du Québec à Rimouski. Rapport remis au ministère de l’Environnement et de la Lutte contre les changements climatiques, septembre 2021, 98 p.
-
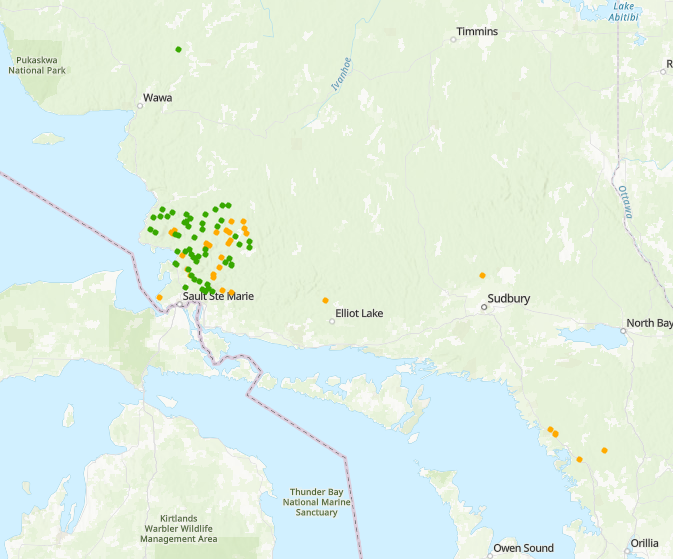
This program summarizes long term water chemistry and chlorophyll a monitoring in north central Ontario lakes developed under Canada’s Long Range Transport of Air Pollutants (LRTAP) initiative to understand and track lake acidification caused by atmospheric deposition. Centered on the intensively studied Turkey Lakes Watershed since 1979 and complemented by broader headwater and mesoscale lake networks around Sault Ste. Marie, Ontario, as well as a few locations near Parry Sound, Ontario, the monitoring integrates catchment scale approaches to link atmospheric inputs, watershed processes, and aquatic responses. Water chemistry measurements quantify acid–base status, major ions, nutrients, and trace metals to diagnose sensitivity to acidification, episodic stress during events such as spring snowmelt, and long term chemical recovery following emission controls. Chlorophyll a is used alongside chemistry to indicate phytoplankton biomass, lake productivity, and overall water quality, providing biological context for fish habitat and ecosystem condition. Together, these coordinated datasets support both detailed process studies and regional assessments of lake sensitivity, productivity, and ecological recovery across a heterogeneous landscape.
-
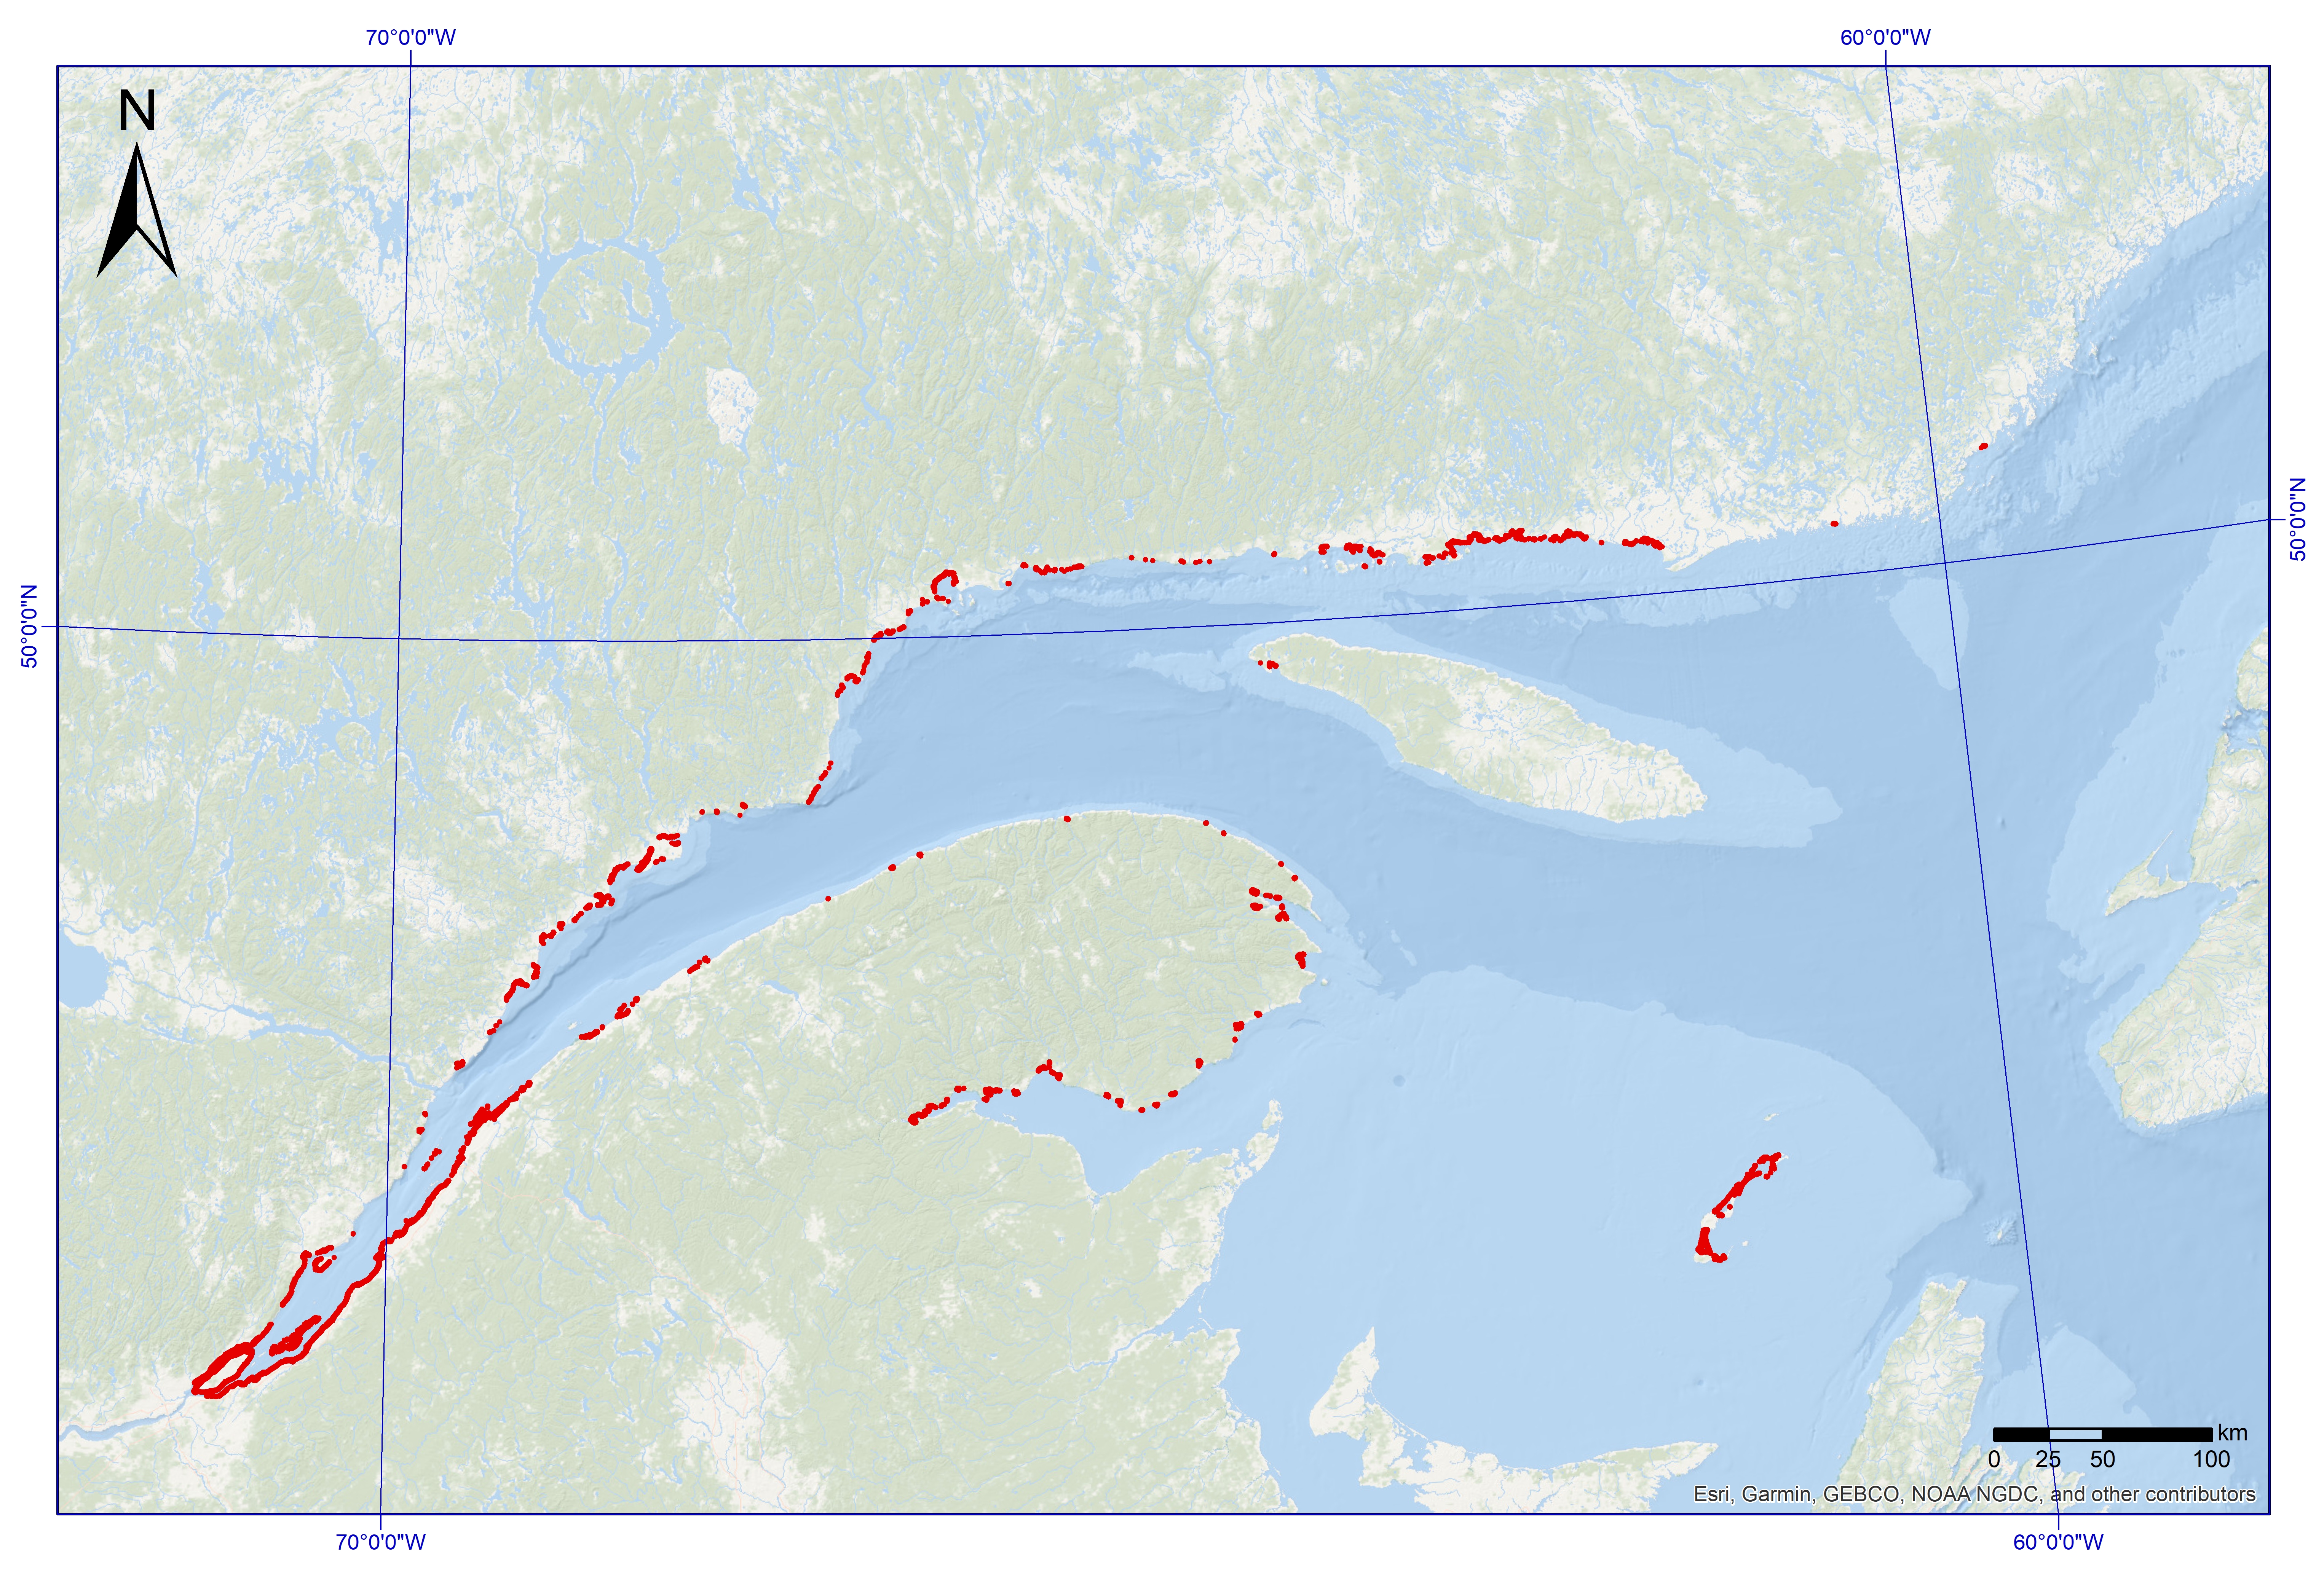
This dataset was designed for Environment and Climate Change Canada's (ECCC) National Environmental Emergencies Center (NEEC) for oil spill preparedness and response. The polygons from this layer come from the coastal ecosystems geodatabase as part of the Mapping of coastal ecosystems of the Estuary and Gulf of St. Lawrence project. This layer represents semi-vegetated (25-75%) and vegetated (75-100%) zones of which marsh vegetation is the dominant. The study area includes all of the estuarine and maritime coasts of Quebec, with the exception of certain sectors, including most of the Lower North Shore and Anticosti Island, with the exception of villages of Kegaska, la Romaine, Chevery, Blanc-Sablon and Port-Menier. Some islands off the estuary and gulf coasts are part of the region covered, such as Île d'Orléans, Isle-aux-Coudres, Île Verte and Île Bonaventure. The mapping of coastal ecosystems was carried out jointly by the Laboratory for Dynamics and Integrated Coastal Zone Management (LDGIZC) of the University of Quebec at Rimouski as part of the Coastal Resilience Project (https: //ldgizc.uqar.ca/Web/projets/projet-resilience-cotiere) funded by the MELCC; and by the Fisheries and Oceans Canada team, as part of its Integrated marine response planning (IMRP) component of the Oceans Protection Plan (OPP), with the objective of updating the Marine Oil Spill Preparedness and Response Regime of Canada. The master geodatabase of coastal ecosystems is hosted and distributed by UQAR on their SIGEC-Web mapping platform: https://ldgizc.uqar.ca/Web/sigecweb The characterization of marshes was mainly carried out using photo-interpretation of RVBI aerial photos acquired by DFO (2015-2020) and oblique photos taken by helicopter acquired by UQAR in 2017. This dataset also includes the information from validation stations visited by UQAR (2018-2020), used to validate and refine the photo-interpretation.
-

This dataset was designed for Environment and Climate Change Canada's (ECCC) National Environmental Emergencies Center (NEEC) for oil spill preparedness and response. The polygons from this layer come mainly from the coastal ecosystems geodatabase as part of the Mapping of coastal ecosystems of the Estuary and Gulf of St. Lawrence project. This layer represents semi-vegetated and vegetated zones of which eelgrass is the dominant vegetation. The study area includes all of the estuarine and maritime coasts of Quebec, with the exception of certain sectors, including most of the Lower North Shore and Anticosti Island, with the exception of villages of Kegaska, la Romaine, Chevery, Blanc-Sablon and Port-Menier. Some islands off the estuary and gulf coasts are part of the region covered, such as Île d'Orléans, Isle-aux-Coudres, Île Verte and Île Bonaventure. The Mapping of coastal ecosystems of the Estuary and Gulf of St. Lawrence was carried out jointly by the Laboratory for Dynamics and Integrated Coastal Zone Management (LDGIZC) of the University of Quebec at Rimouski as part of the Coastal Resilience Project (https: //ldgizc.uqar.ca/Web/projets/projet-resilience-cotiere) funded by the MELCC; and by the Fisheries and Oceans Canada team, as part of its Integrated marine response planning (IMRP) component of the Oceans Protection Plan (OPP), with the objective of updating the Marine Oil Spill Preparedness and Response Regime of Canada. The master geodatabase of coastal ecosystems is hosted and distributed by UQAR on their SIGEC-Web mapping platform: https://ldgizc.uqar.ca/Web/sigecweb The characterization of eelgrass beds was mainly carried out using photo-interpretation of RVBI aerial photos acquired by DFO (2015-2020) and oblique photos taken by helicopter by UQAR in 2017. This dataset also includes the information from validation stations visited by UQAR (2018-2020). Data from sampling stations, carried out aboard small boats during DFO field campaigns (2017-2021), were also used to validate and refine the photo-interpretation. This dataset also includes eelgrass beds characterized in the Basse-Côte-Nord (MRC Le Golfe-de-Saint-Laurent) by the Agence Mamu Innu Kaikusseht (AMIK) as part of the project ''Involvement of Innu communities in the protection of species at risk and their habitats 2010-2011''. These data were produced during aerial overflights at low altitude (200m and 400m) of the foreshore, as 2 observers circumscribed and documented the covering of eelgrass beds. Credits © UQAR-MPO-AMIK (2023, Laboratoire de dynamique et de gestion intégrée des zones côtières, Pêches et Océans Canada, Agence Mamu Innu Kaikusseht) Provencher-Nolet, L., Paquette, L., Pitre, L.D., Grégoire, B. and Desjardins, C. 2024. Cartographie des macrophytes estuariens et marins du Québec. Rapp. Tech. Can. Sci. halieut. Aquat. 3617 : v + 99 p. Grégoire, B., Pitre, L.D., Provencher-Nolet, L., Paquette, L. and Desjardins, C. 2024. Distribution d’organismes marins de la zone côtière peu profonde du Québec recensés par imagerie sous-marine de 2017 à 2021. Rapp. tech. can. sci. halieut. aquat. 3616 : v + 78 p. Grégoire, B. 2022. Biodiversité du relevé côtier Planification pour une intervention environnementale intégrée dans l’estuaire et le golfe du Saint-Laurent (2017–2021). Observatoire global du Saint-Laurent. [Jeu de données] Nadeau, V., Le Breton, S. 2011. Inventaire aérien des herbiers de zostère de la Basse-Côte-Nord du Golfe du Saint-Laurent. Agence Mamu Innu Kaikusseht. 25 p. Jobin, A., Marquis, G., Provencher-Nolet, L., Gabaj Castrillo. M. J., Trubiano C., Drouet, M., Eustache-Létourneau, D., Drejza, S. Fraser, C. Marie, G. et P. Bernatchez (2021) Cartographie des écosystèmes côtiers du Québec maritime — Rapport méthodologique. Chaire de recherche en géoscience côtière, Laboratoire de dynamique et de gestion intégrée des zones côtières, Université du Québec à Rimouski. Rapport remis au ministère de l’Environnement et de la Lutte contre les changements climatiques, septembre 2021, 98 p.
-
The selection of an Area of Interest marks the beginning of the Oceans Act Marine Protected Area (MPA) establishment process led by Fisheries and Oceans Canada. The process includes completing detailed ecological and socioeconomic assessments, setting conservation objectives, determining boundaries and management measures, and eventually developing the regulations under section 35 of the Oceans Act. Stakeholders are involved in each step of this process. There is considerable scientific evidence that marine protected areas provide a number of ecological benefits, including the enhanced recruitment of fish species, including those of commercial value, through the protection of spawning areas, larval sources, habitats and migration routes. A well-designed MPA network can scale these benefits up to the regional level, and provide benefits that individual marine protected areas cannot provide on their own. For example, strategically placing marine protected areas in a network can protect key stops along a species’ migration route, and protect geographically distinct habitats that serve important life history functions. The United Nations Food and Agricultural Organization has recognized the use of marine protected areas as complementary to conventional fisheries management measures in helping to achieve sustainable fisheries management objectives. ----- Le choix d'un site d'intérêt marque le début du processus de création des zones de protection marines (ZPM) en vertu de la Loi sur les océans placé sous la responsabilité de Pêches et Océans Canada. Le processus comprend la réalisation d'évaluations écologiques et socioéconomiques détaillées, l'établissement d’objectifs de conservation, la détermination de limites et de mesures de gestion, et l'élaboration de règlements en vertu de l'article 35 de la Loi sur les océans. Les parties intéressées prennent part à chaque étape du processus. Les preuves scientifiques des avantages écologiques que présentent les zones de protection marines sont nombreuses. Entre autres, elles accroissent le recrutement des espèces de poisson, y compris de celles qui ont une valeur commerciale, grâce à la protection des frayères, des sources larvaires, des habitats et des routes migratoires. Un réseau de ZPM bien conçu peut décupler les avantages au niveau régional et susciter des bienfaits que les zones de protection marines ne peuvent pas procurer individuellement. Par exemple, la constitution d'un réseau de ZPM dans des zones stratégiques permet de protéger des points clés le long de la route migratoire d'une espèce et de protéger des habitats géographiques distincts qui remplissent des fonctions importantes du cycle biologique. L'Organisation des Nations Unies pour l'alimentation et l'agriculture a reconnu que l'utilisation de zones de protection marines en complément des mesures conventionnelles de gestion des pêches pouvait faciliter l'atteinte des objectifs en matière de gestion durable des pêches.
-

Proxied dataset of inshore lobster commercial fishing for 2012 - 2021 in the Newfoundland and Labrador region. Only lobster harvested from the Newfoundland and Labrador region are included, based on species sought. Commercial data for the inshore lobster fishery does not require a set of coordinates be provided for catch records. With zero georeferenced inshore lobster records, the inshore lobster fishery leaves a major data gap in one of Newfoundland and Labradors largest fisheries. The Gulf region created a lobster proxy mapping tool, which associated each commercial lobster record with the most likely 10km2 hexagon grid cell based on a number of weighted variables. The tool was adopted by the Newfoundland and Labrador region and altered to work with its own variables which include human use, habitat, accessibility, area/location, home port distance, traditional ecological knowledge and depth. Each hexagon represents the summed total weight of all records associated with a particular hexagon. The best available commercial data used in this model is derived from landings data and may not include catches that have resulted in cash/wharf sales. As a result, there are some areas of Newfoundland and Labrador that may be under represented in this dataset where wharf sales may be high. Therefore, this dataset should be viewed as a general estimation on lobster harvesting patterns within Newfoundland and Labrador.
-

A research survey of scallops (mainly sea scallop Placopecten magellanicus, but also Icelandic Scallop Chlamys islandica) using a dredge was carried out by DFO (Fisheries and Oceans Canada) every 1 or 2 years since 1992 in the Magdalen Islands (fishing area 20). The main objective of this research survey was to assess Sea Scallop stocks. Another objective was to document taxa associated with scallop habitat according to a fixed random sampling plan. Occurrences for the year 2021 and 2022 are presented by species (or taxon) by station. Starting in 2021, catches were weighed, and specimens photographed, with information available upon request. The taxonomic and geographical validity of the data was checked and the World Register of Marine Species served as the taxonomic authority for naming all taxa recorded during the survey. Epibenthic invertebrates (mainly molluscs, echinoderms and crustaceans) as well as demersal fish were identified from the dredge catches. The historical dataset is available at the following link : https://open.canada.ca/data/en/dataset/71732ad5-5c70-4dbf-916d-a94e1380c53b The study area is located south of the Magdalen Islands and the sampling of scallop beds is carried out at depths of generally around 25 to 35 m. A random selection of sampling stations is carried out from a fixed station grid. Sampling is done along transects at these randomly drawn stations in the study area. Sampling is done with a lined Digby scallop dredge (20 mm mesh) over approximately 500 m along the seabed. The four baskets of the dredge are examined for all scallops, and starting in 2022, also for all fishes. One basket (first on the starboard side) is sorted and examined for associated species. Most specimens are counted by taxa. Those that are too small and numerous, or colonial, are noted for presence or relative abundance. Special cases are occasionally conserved for taxonomic analysis, for example, ascidians (to monitor for invasive species) and sponges (to document new species). The availability of photos and some conserved specimens enables future review. Changes are anticipated in the identifications, notably for Bryozoan, Hydrozoa, and Porifera, that are currently the focus of research efforts.
-
A research survey on American lobster (Homarus americanus) has been conducted annually in the Magdalen Islands since 1995 to assess the abundance and structure of lobster populations in this area. Starting in 2007, the main objective was modified to include the diversity and abundance of benthic species associated with lobster habitat. Only benthic species data associated with lobster habitat are presented in this dataset. Surveys were generally conducted during the first two weeks of September from 2007 to 2020 on the entire south side of the Magdalen Islands, from Grosse-Île to Havre-Aubert. The sampling plan consists of 70 trawl tows on 50 fixed stations, between 4 and 35 meters in depth. Some stations had double tows. Specimens were collected using a Nephrops-type door trawl with a total width of 3.04 meters consisting of four Vexar™ lined baskets of 19 millimeter mesh size in order to harvest small individuals. Start and end positions were recorded to calculate the distance traveled at each tow using the geosphere library in R. The year 2011 is not included in the dataset, as biodiversity data were not recorded. Since 2017, the average tow distance has been reduced from 1000 meters to 500 meters. The opening of the trawl is also noted every minute throughout the duration of the tow so that the area sampled can be calculated. The area covered in each tow was the product of the trawl opening and the distance traveled. The two files provided (DarwinCore format) are complementary and are linked by the "eventID" key. The "Event_data" file includes generic activity information, including date and location. The "Occurrence" file includes the taxonomy of the observed species, identified to the species or lowest possible taxonomic level. For abundance and biomass estimates, contact Benoît Bruneau (Benoit.Bruneau@dfo-mpo.gc.ca). For quality controls, all taxonomic names were checked against the World Register of Marine Species (WoRMS) to match recognized standards. The WoRMS match was placed in the "ScientificnameID" field of the occurrence file. Special cases were noted in the "identificationRemarks" field and selected specimens were confirmed with field photos mentioned in "associatedMedia". Data quality checks were performed using the R obistools and WORMS libraries. All sampling locations were spatially validated.