 Arctic SDI catalogue
remote sensing
Type of resources
Categories
Available actions
Topics
Keywords
Contact for the resource
Provided by
Years
Formats
Representation types
Update frequencies
status
Resolution
-

__LiDAR__ (__Li__ght __D__etection __A__nd __R__anging) is a modern survey method that produces three-dimensional spatial information in the form of a data point cloud. LiDAR is an active remote sensing system; it produces its own energy to acquire information, versus passive systems, like cameras, that only receive energy. LiDAR systems are made up of a scanner, which is a laser transmitter and receiver; a GNSS (GPS) receiver; and an inertial navigation system (INS). These instruments are mounted to an aircraft. The laser scanner transmits near-infrared light to the ground. The light reflects off the ground and returns to the scanner. The scanner measures the time interval and intensity of the reflected signals. This information is integrated with the positional information provided by the GNSS and INS to create a three-dimensional point cloud representing the surface. A LiDAR system can record millions of points per second, resulting in high spatial resolution, which allows for differentiation of many fine terrain features. Point clouds collected with LiDAR can be used to create three-dimensional representations of the Earth’s surface, such as Digital Elevation Models (DEMs) and Digital Surface Models (DSMs). DEMs model the elevation of the ground without objects on the surface, and DSMs model ground elevations as well as surface objects such as trees and buildings. LidarBC's **Open LiDAR Data Portal** (see link under Resources) is an initiative to provide **open** public access to LiDAR and associated datasets collected by the Government of British Columbia. The data in the portal is released as Open Data under the [**Open Government Licence – British Columbia**](https://www2.gov.bc.ca/gov/content/data/open-data/open-government-licence-bc) (OGL-BC). Four Government of British Columbia business areas and one department of the Government of Canada make LiDAR data available through the portal: * [**GeoBC**](https://www2.gov.bc.ca/gov/content/data/about-data-management/geobc) * [**Emergency Management and Climate Readiness**](https://www2.gov.bc.ca/gov/content/safety/emergency-management) (EMCR) * [**BC Timber Sales**](https://www2.gov.bc.ca/gov/content/industry/forestry/bc-timber-sales) (BCTS) * [**Forest Analysis and Inventory Branch**](https://www2.gov.bc.ca/gov/content/industry/forestry/managing-our-forest-resources/forest-inventory) (FAIB) * [**Natural Resources Canada**](https://www.nrcan.gc.ca/home) (NRCan) GeoBC is the provincial branch that oversees and manages LidarBC’s Open LiDAR Data Portal, including storage, distribution, maintenance, and updates. Please direct questions to **LiDAR@gov.bc.ca**.
-

The start-of-season date (SOSD) marks the date when the vegetation growing season starts in the time profile of the Plant Phenology Index (PPI). The start-of-season occurs, by definition, when the PPI value reaches 25% of the season amplitude during the green-up period. The Plant Phenology Index (PPI) is a physically based vegetation index, developed for improving the monitoring of the vegetation growth cycle. The PPI index values, withwith daily inputs, are first used in a function fitting to derive the PPI Seasonal Trajectories. From these Seasonal Trajectories, a suite of 13 Vegetation Phenology and Productivity (VPP) parameters are then computed and provided, for up to two seasons each year. The SOSD is one of the 13 parameters. The Start-of-Season Date (SOSD) time series dataset is made available as raster files with 500 x 500m resolution, in ETRS89-LAEA projection corresponding to the MCD43 tiling grid.
-
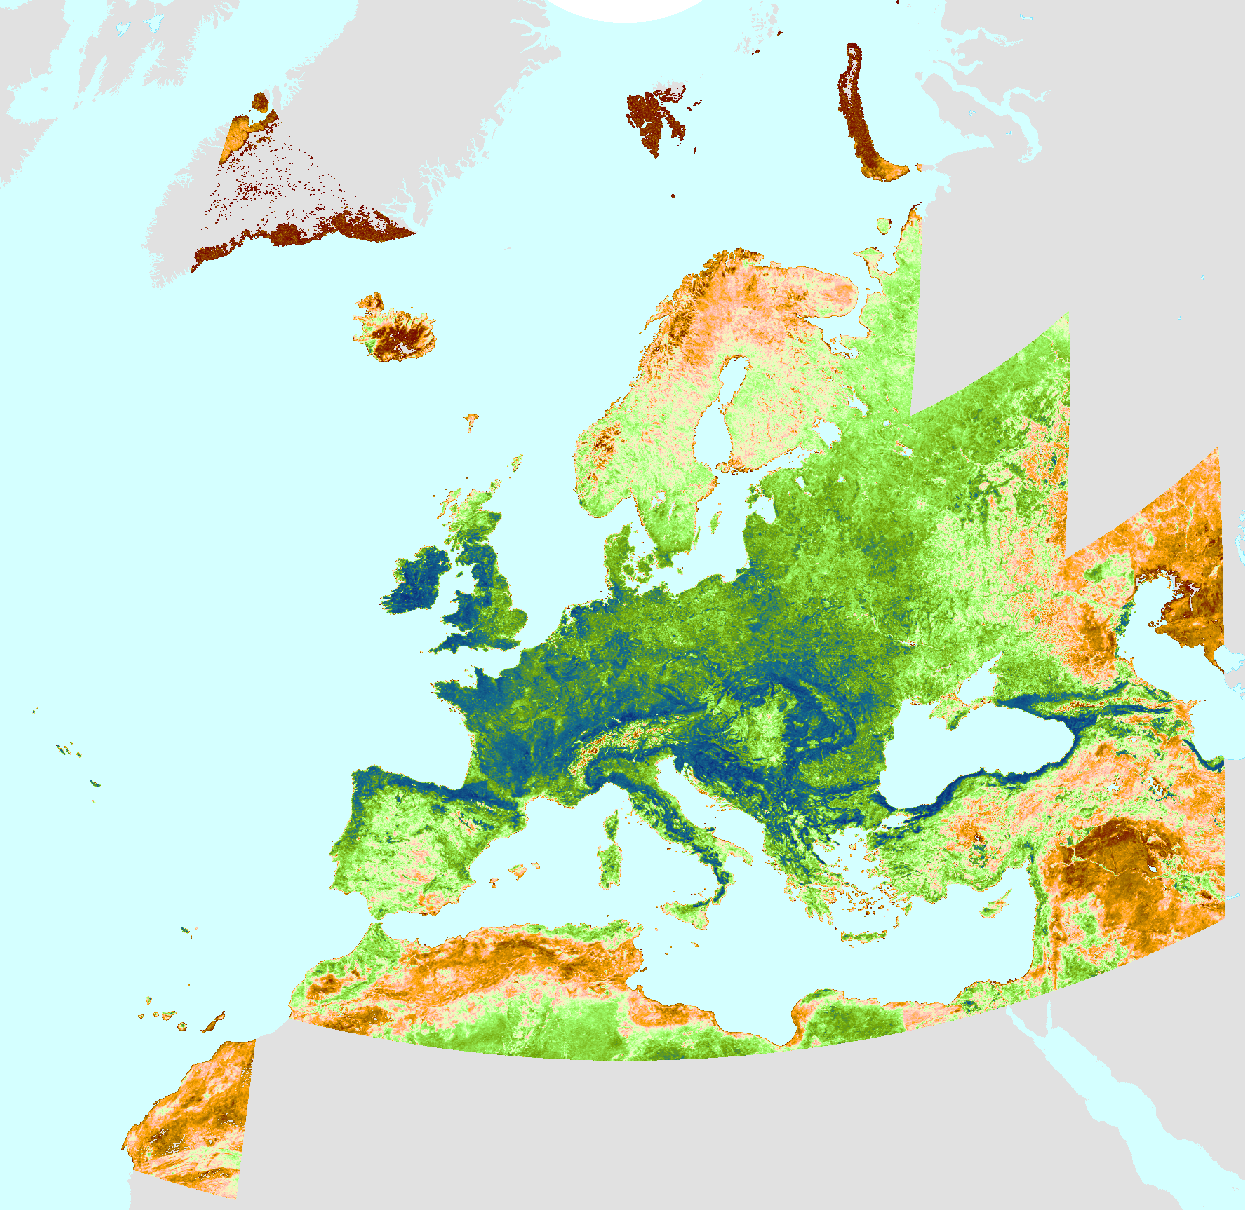
The season amplitude (AMPL), one of the Vegetation Phenology and Productivity (VPP) parameters, is a product of the pan-European Medium Resolution Vegetation Phenology and Productivity (MR-VPP) component of the Copernicus Land Monitoring Service (CLMS). The AMPL is the difference between the maximum and minimum Plant Phenology Index (PPI) values reached during the season. The Plant Phenology Index (PPI) is a physically based vegetation index, developed for improving the monitoring of the vegetation growth cycle. The PPI index values, with daily inputs, are first used in a function fitting to derive the PPI Seasonal Trajectories. From these Seasonal Trajectories, a suite of 13 Vegetation Phenology and Productivity (VPP) parameters are then computed and provided, for up to two seasons each year. The AMPL is one of the 13 parameters. The AMPL time series dataset is made available as raster files with 392 x 392m resolution, in ETRS89-LAEA projection corresponding to the MCD43 tiling grid. IMPORTANT: The full access to open and free data for this resource will be made available upon request.
-
Medium Resolution Vegetation Phenology and Productivity: Season maximum date 2000-2025 (raster 392m)
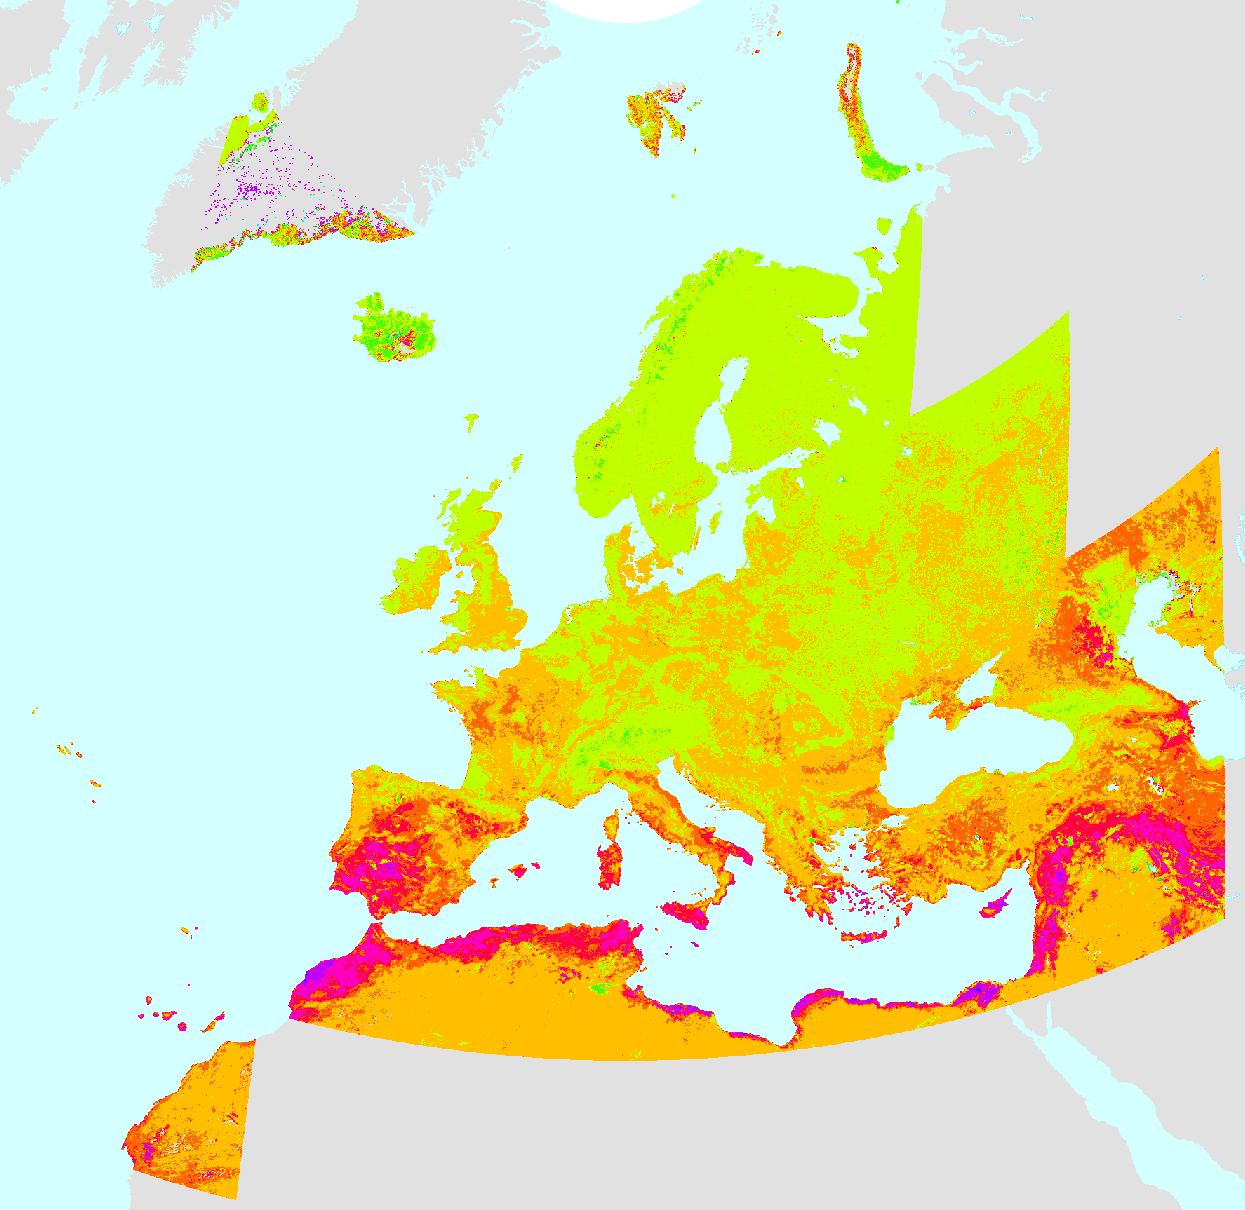
The season maximum date (MAXD), one of the Vegetation Phenology and Productivity (VPP) parameters, is a product of the pan-European Medium Resolution Vegetation Phenology and Productivity (MR-VPP) component of the Copernicus Land Monitoring Service (CLMS). MAXD is the date (day of year) when vegetation reaches its maximum greenness or productivity during a growing season. The Plant Phenology Index (PPI) is a physically based vegetation index, developed for improving the monitoring of the vegetation growth cycle. The PPI index values, The PPI index values, withwith daily inputs, are first used in a function fitting to derive the PPI Seasonal Trajectories. From these Seasonal Trajectories, a suite of 13 Vegetation Phenology and Productivity (VPP) parameters are then computed and provided, for up to two seasons each year. The SOSD is one of the 13 parameters. The MAXD time series dataset is made available as raster files with 392 x 392m resolution, in ETRS89-LAEA projection corresponding to the MCD43 tiling grid. IMPORTANT: The full access to open and free data for this resource will be made available upon request.
-

The Quality Flag of the Plant Phenology Index is one of the products of the pan-European Medium Resolution Vegetation Phenology and Productivity (MR-VPP) component of the Copernicus Land Monitoring Service (CLMS). The Plant Phenology Index (PPI) is a physically based vegetation index for improved monitoring of plant phenology, that is developed from a simplified solution to the radiative transfer equation by Jin and Eklundh (2014) and that has a linear relationship with green leaf area index. The PPI Seasonal Trajectories (ST) product is derived from a TIMESAT-based function fitting of the time series of the PPI vegetation index and thus provides a filtered time series of PPI, with regular 5-day PPI outputs. The Quality Flag indicates the quality of the PPI seasonal trajectory computation, in the form of a confidence level. The QFLAG dataset is made available as raster files with 392 x 392m resolution, in ETRS89-LAEA projection corresponding to the MCD43 tiling grid. IMPORTANT: The full access to open and free data for this resource will be made available upon request.
-
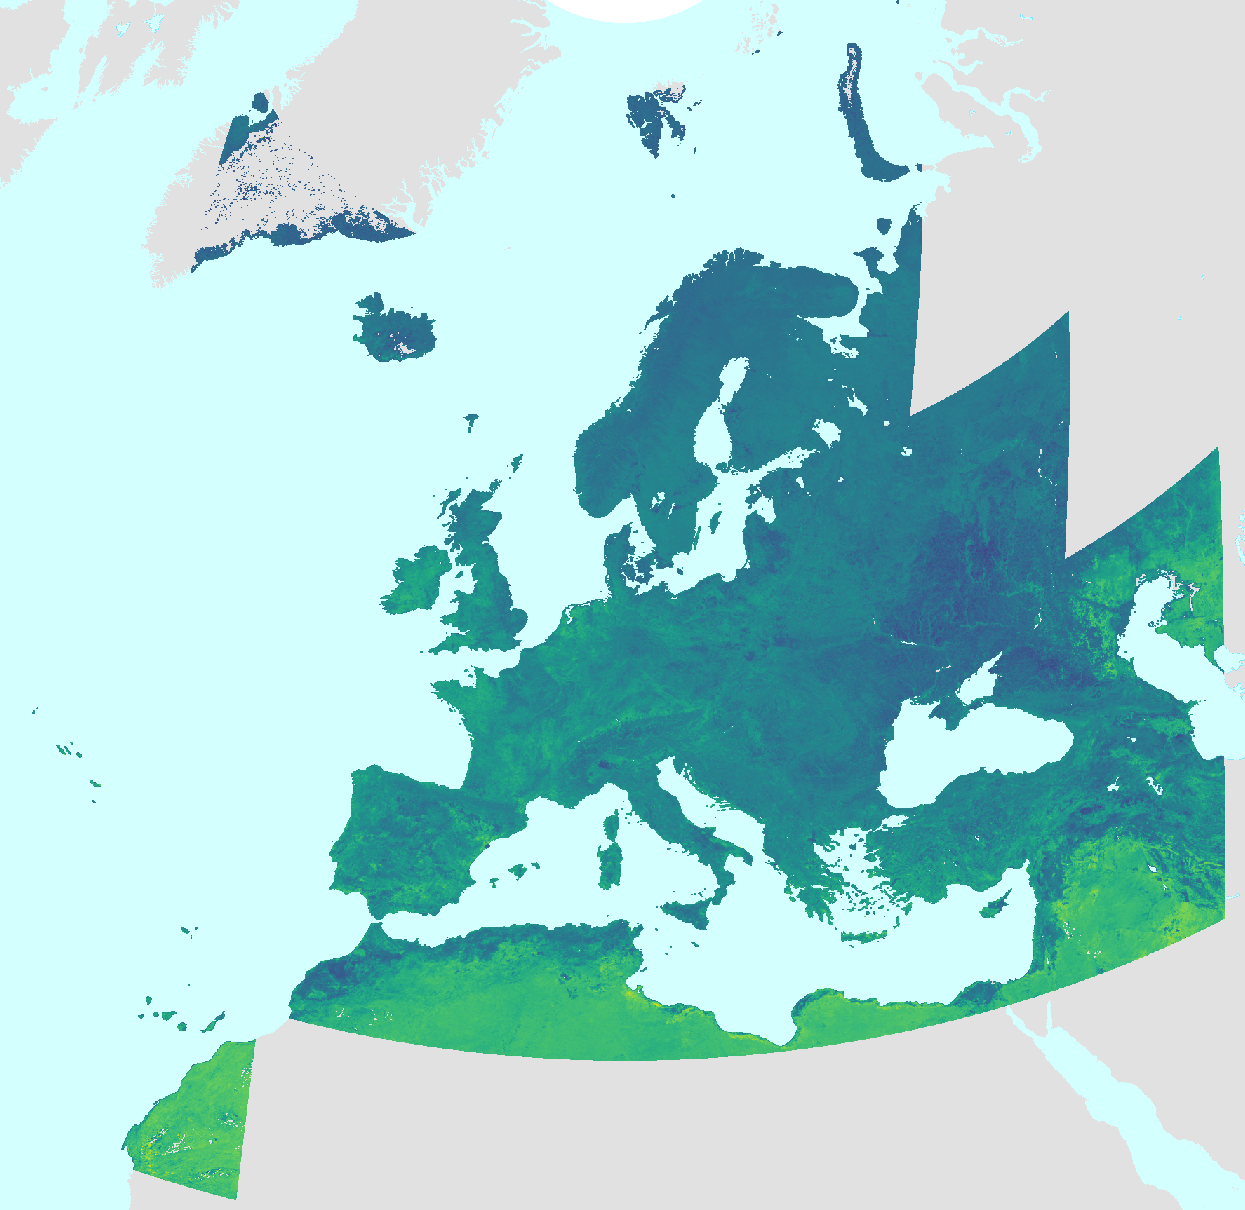
The season length (LENGTH), one of the Vegetation Phenology and Productivity (VPP) parameters, is a product of the pan-European High Resolution Vegetation Phenology and Productivity (MR-VPP) component of the Copernicus Land Monitoring Service (CLMS). The LENGTH is the number of days between the start and end dates of the vegetation growing season in the time profile of the Plant Phenology Index (PPI). The Plant Phenology Index (PPI) is a physically based vegetation index, developed for improving the monitoring of the vegetation growth cycle. The PPI index values, withwith daily inputs, are first used in a function fitting to derive the PPI Seasonal Trajectories. From these Seasonal Trajectories, a suite of 13 Vegetation Phenology and Productivity (VPP) parameters are then computed and provided, for up to two seasons each year. The LENGTH is one of the 13 parameters. The LENGTH time series dataset is made available as raster files with 392 x 392m resolution, in ETRS89-LAEA projection corresponding to the MCD43 tiling grid. IMPORTANT: The full access to open and free data for this resource will be made available upon request.
-
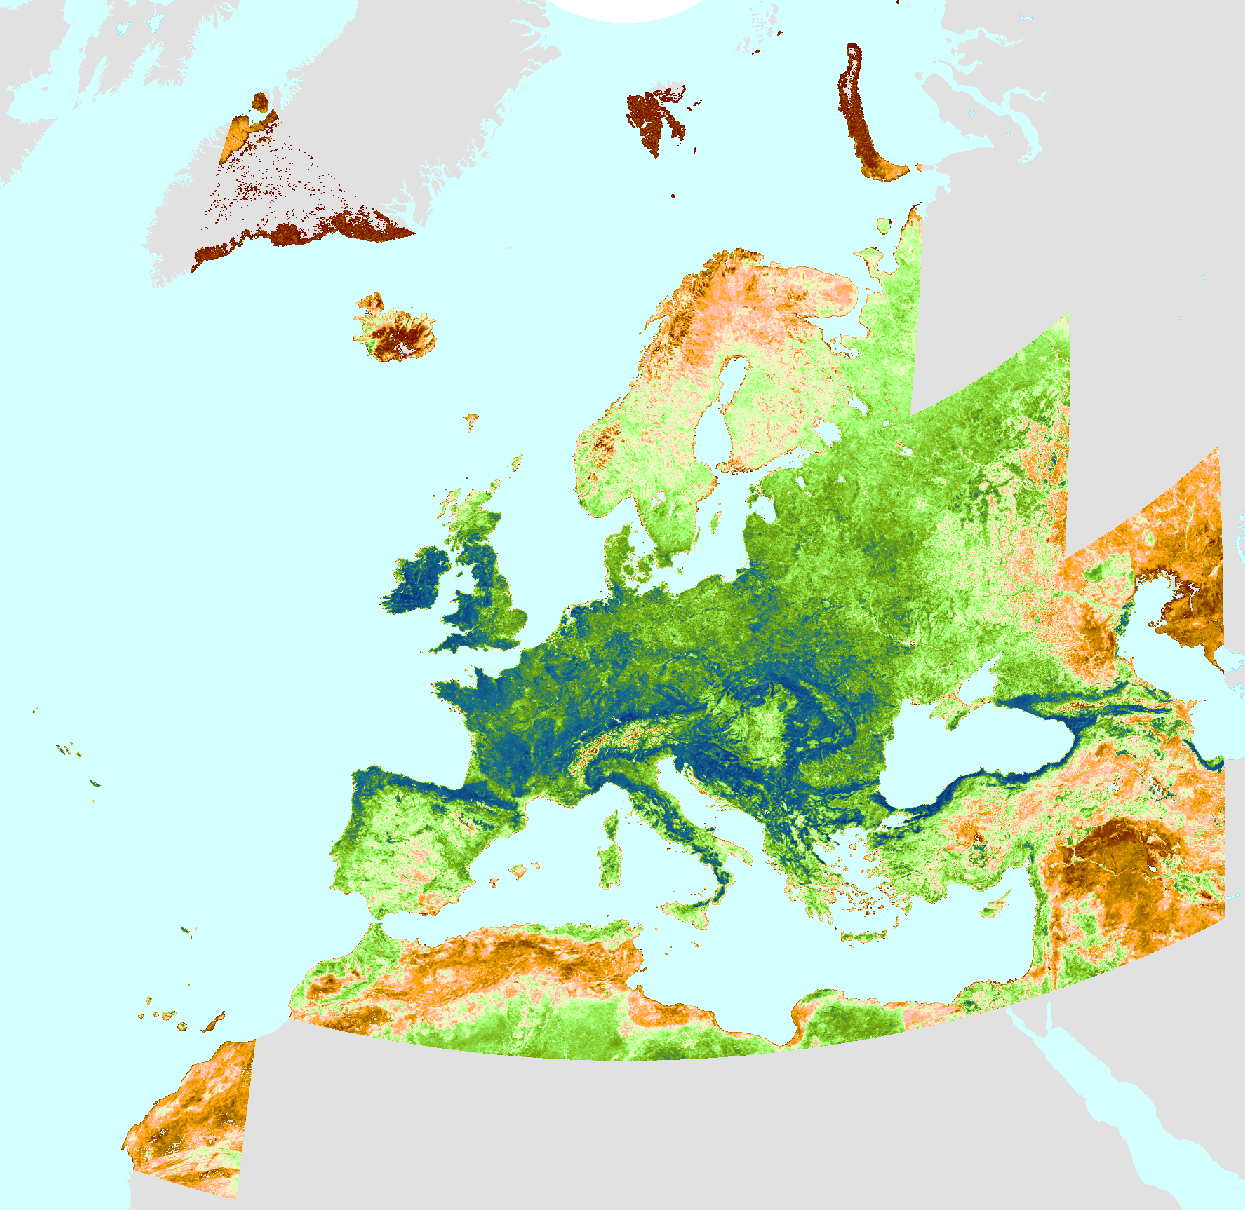
The start-of-season date (SOSD) marks the date when the vegetation growing season starts in the time profile of the Plant Phenology Index (PPI). The start-of-season occurs, by definition, when the PPI value reaches 25% of the season amplitude during the green-up period. The Plant Phenology Index (PPI) is a physically based vegetation index, developed for improving the monitoring of the vegetation growth cycle. The PPI index values, with daily inputs, are first used in a function fitting to derive the PPI Seasonal Trajectories. From these Seasonal Trajectories, a suite of 13 Vegetation Phenology and Productivity (VPP) parameters are then computed and provided, for up to two seasons each year. The SOSD is one of the 13 parameters. The Start-of-Season Date (SOSD) time series dataset is made available as raster files with 392 x 392m resolution, in ETRS89-LAEA projection corresponding to the MCD43 tiling grid. IMPORTANT: The full access to open and free data for this resource will be made available upon request.
-

The Season Length (LENGTH), one of the Vegetation Phenology and Productivity (VPP) parameters, is a product of the pan-European High Resolution Vegetation Phenology and Productivity (HR-VPP) component of the Copernicus Land Monitoring Service (CLMS). The Season Length is the number of days between the start and end dates of the vegetation growing season in the time profile of the Plant Phenology Index (PPI). The Plant Phenology Index (PPI) is a physically based vegetation index, developed for improving the monitoring of the vegetation growth cycle. The PPI index values, with 5-day satellite revisit cycle, are first used in a function fitting to derive the PPI Seasonal Trajectories, which is a filtered time series with regular 10-day time step. From these Seasonal Trajectories, a suite of 13 Vegetation Phenology and Productivity (VPP) parameters are then computed and provided, for up to two seasons each year. The Season Length is one of the 13 parameters. The full list is available in the table 3 of the Product User Manual in the below link section. A complementary quality indicator (QFLAG) provides a confidence level, that is described in table 4 of the same manual. The LENGTH dataset is made available as raster files with 10 x 10m and 100 x 100m resolutions, in ETRS89-LAEA projection corresponding to the HRL grid, for those tiles that cover the EEA38 countries and the United Kingdom and for two seasons in each year from 2017 onwards. It is updated in the first quarter of each year.
-
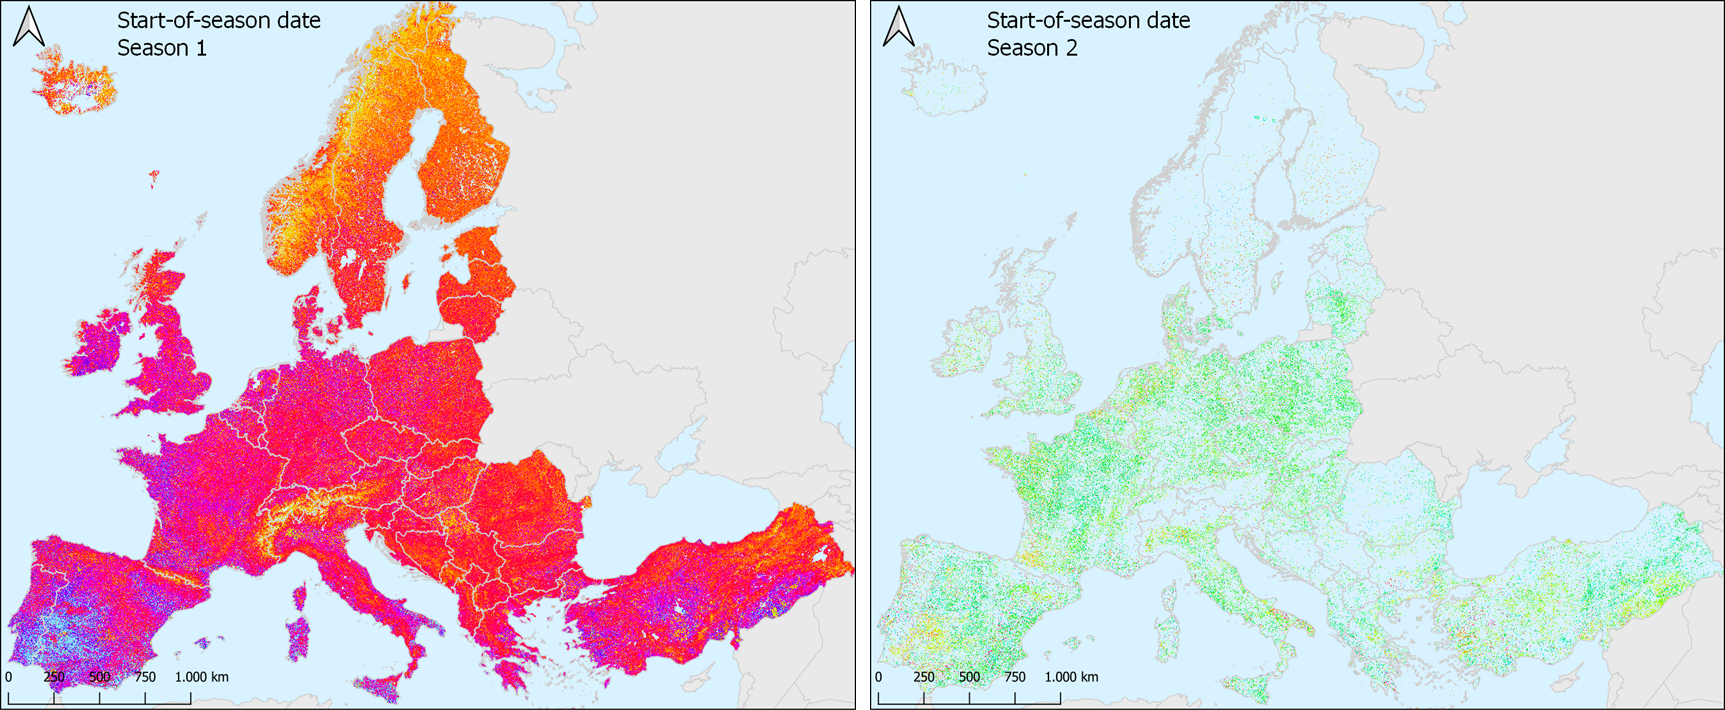
The Start-of-Season Date (SOSD), one of the Vegetation Phenology and Productivity (VPP) parameters, is a product of the pan-European High Resolution Vegetation Phenology and Productivity (HR-VPP) component of the Copernicus Land Monitoring Service (CLMS). The Start-of-Season Date (SOSD) marks the date when the vegetation growing season starts in the time profile of the Plant Phenology Index (PPI). The start-of-season occurs, by definition, when the PPI value reaches 25% of the season amplitude during the green-up period. The Plant Phenology Index (PPI) is a physically based vegetation index, developed for improving the monitoring of the vegetation growth cycle. The PPI index values, with 5-day satellite revisit cycle, are first used in a function fitting to derive the PPI Seasonal Trajectories, which is a filtered time series with regular 10-day time step. From these Seasonal Trajectories, a suite of 13 Vegetation Phenology and Productivity (VPP) parameters are then computed and provided, for up to two seasons each year. The Start-of-Season Date is one of the 13 parameters. The full list is available in the table 3 of the Product User Manual in the below link section. A complementary quality indicator (QFLAG) provides a confidence level, that is described in table 4 of the same manual. The SOSD dataset is made available as raster files with 10 x 10m and 100 x 100m resolutions, in ETRS89-LAEA projection corresponding to the HRL grid, for those tiles that cover the EEA38 countries and the United Kingdom and for two seasons in each year from 2017 onwards. It is updated in the first quarter of each year.
-
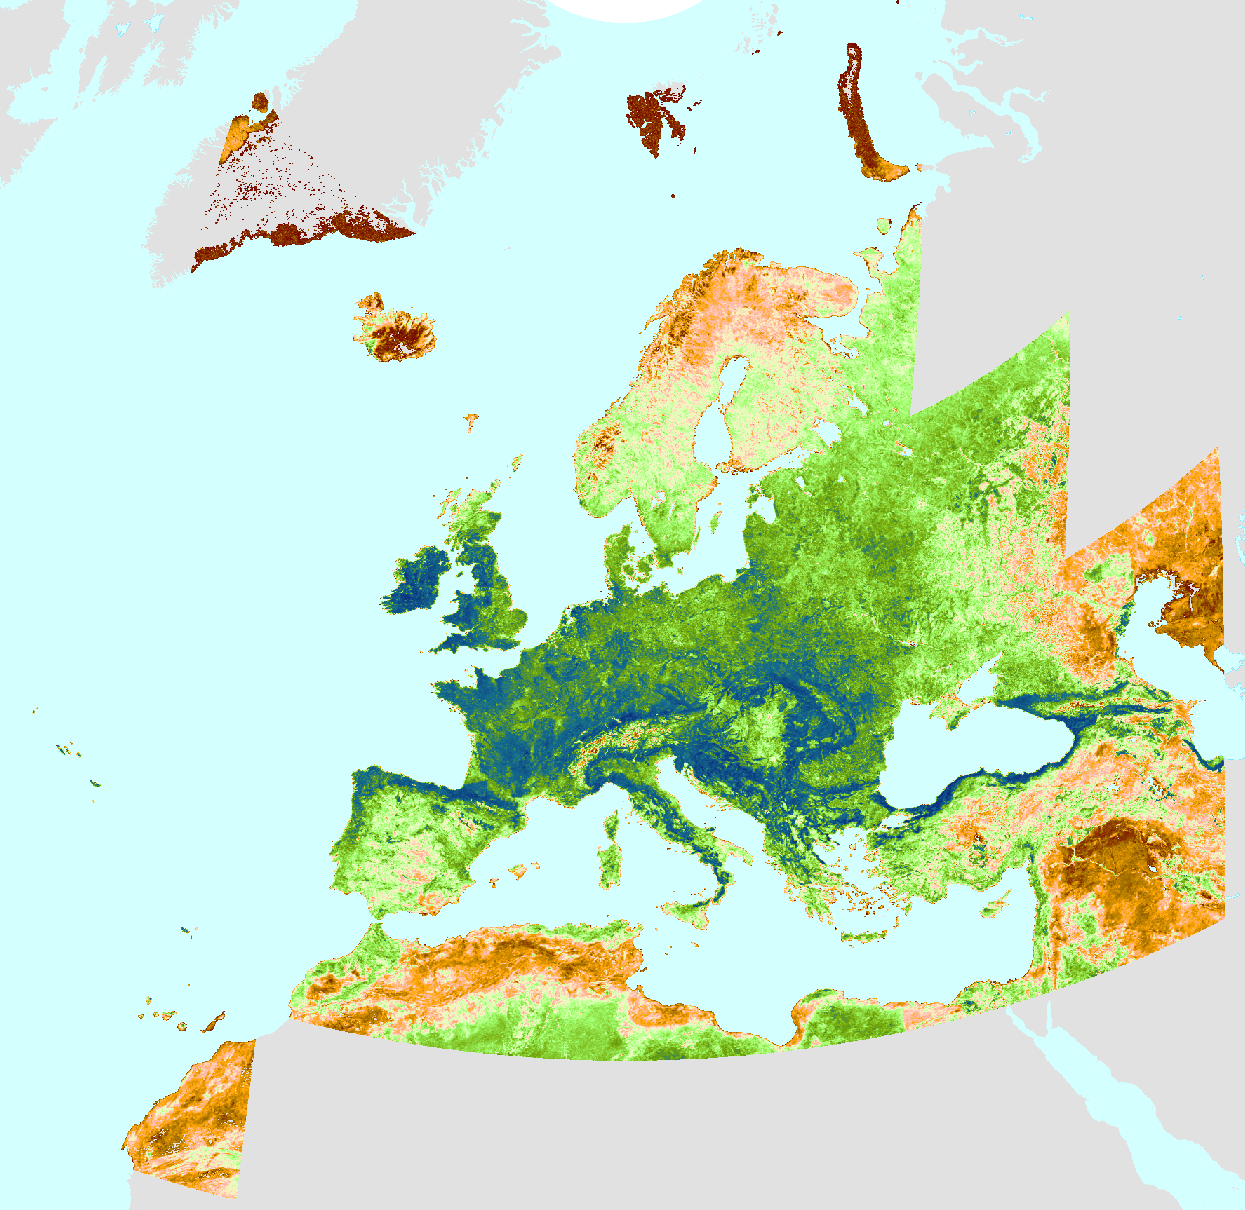
The seasonal productivity (SPROD), one of the Vegetation Phenology and Productivity (VPP) parameters, is a product of the pan-European Medium Resolution Vegetation Phenology and Productivity (MR-VPP) component of the Copernicus Land Monitoring Service (CLMS). The SPROD defined as the cumulative sum of daily deviations from the base level between the start and end of the growing season. The Plant Phenology Index (PPI) is a physically based vegetation index, developed for improving the monitoring of the vegetation growth cycle. The PPI index values, withwith daily inputs, are first used in a function fitting to derive the PPI Seasonal Trajectories. From these Seasonal Trajectories, a suite of 13 Vegetation Phenology and Productivity (VPP) parameters are then computed and provided, for up to two seasons each year. The SPROD is one of the 13 parameters. The SPROD time series dataset is made available as raster files with 500 x 500m resolution, in ETRS89-LAEA projection corresponding to the MCD43 tiling grid.