 Arctic SDI catalogue
European Commission
Type of resources
Available actions
Topics
Keywords
Contact for the resource
Provided by
Years
Formats
Scale
Resolution
-
The European Ground Motion Service (EGMS) is a component of the Copernicus Land Monitoring Service. EGMS provides consistent, regular, standardised, harmonised and reliable information regarding natural and anthropogenic ground motion phenomena over the Copernicus Participating States and across national borders, with millimetre accuracy. This set of metadata describes the second product level of EGMS: Calibrated. This product is considered the main EGMS product as it serves the needs of most users. but the measurement points are referenced to a model derived from global navigation satellite system data. Thus, the measurements are not relative anymore and are considered as absolute. The calibrated product makes it possible to compare ground motion measurements from adjacent areas belonging to different products of the same level. EGMS Calibrated is visualised as a vector map of measurement points, colour-coded by average velocity, and distributed to users in comma-separated values format. Each point is associated with a time series of displacement, i.e. a plot with values of displacement per acquisition of the satellite. The product is generated for both ascending and descending orbits.
-

This metadata covers the Ice Cover Duration (ICD) product is generated once a year and it provides an estimated number of ice covered days for each pixel in the inland waters at European scale. The product is derived from Water/Ice Cover (WIC) products, both from Sentinel-1 and Sentinel-2 observations. It has a spatial resolution of 20 m x 20 m. It is also available in another projection as tiles aligned with the Pan-European High-Resolution Layers in the European 20 m x 20 m grid (ETRS89 LAEA - EPSG: 3035). ICD is one of the products of the pan-European High-Resolution Water Snow & Ice portfolio (HR-WSI), which are provided at high spatial resolution from the Sentinel-2 and Sentinel-1 constellations data from September 1, 2016 onwards.
-

Small Woody Features are important vectors of biodiversity and provide information on fragmentation of habitats with a direct potential for restoration while also providing a link to hazard protection and green infrastructure, amongst others. VHR_IMAGE_2021 made available in the ESA Copernicus DWH was the main data source for the detection of small woody features identifiable within the given image resolution. The Small Woody Features layer contains woody linear and patchy elements but will not be further differentiated into trees, hedges, bushes and scrub. The spatial pattern shall be limited to linear structures and isolated patches on the basis of geometric characteristics. This product is a vector dataset distributed as OGC GeoPackage files, compliant with the EEA reference grid (100km x 100km).
-
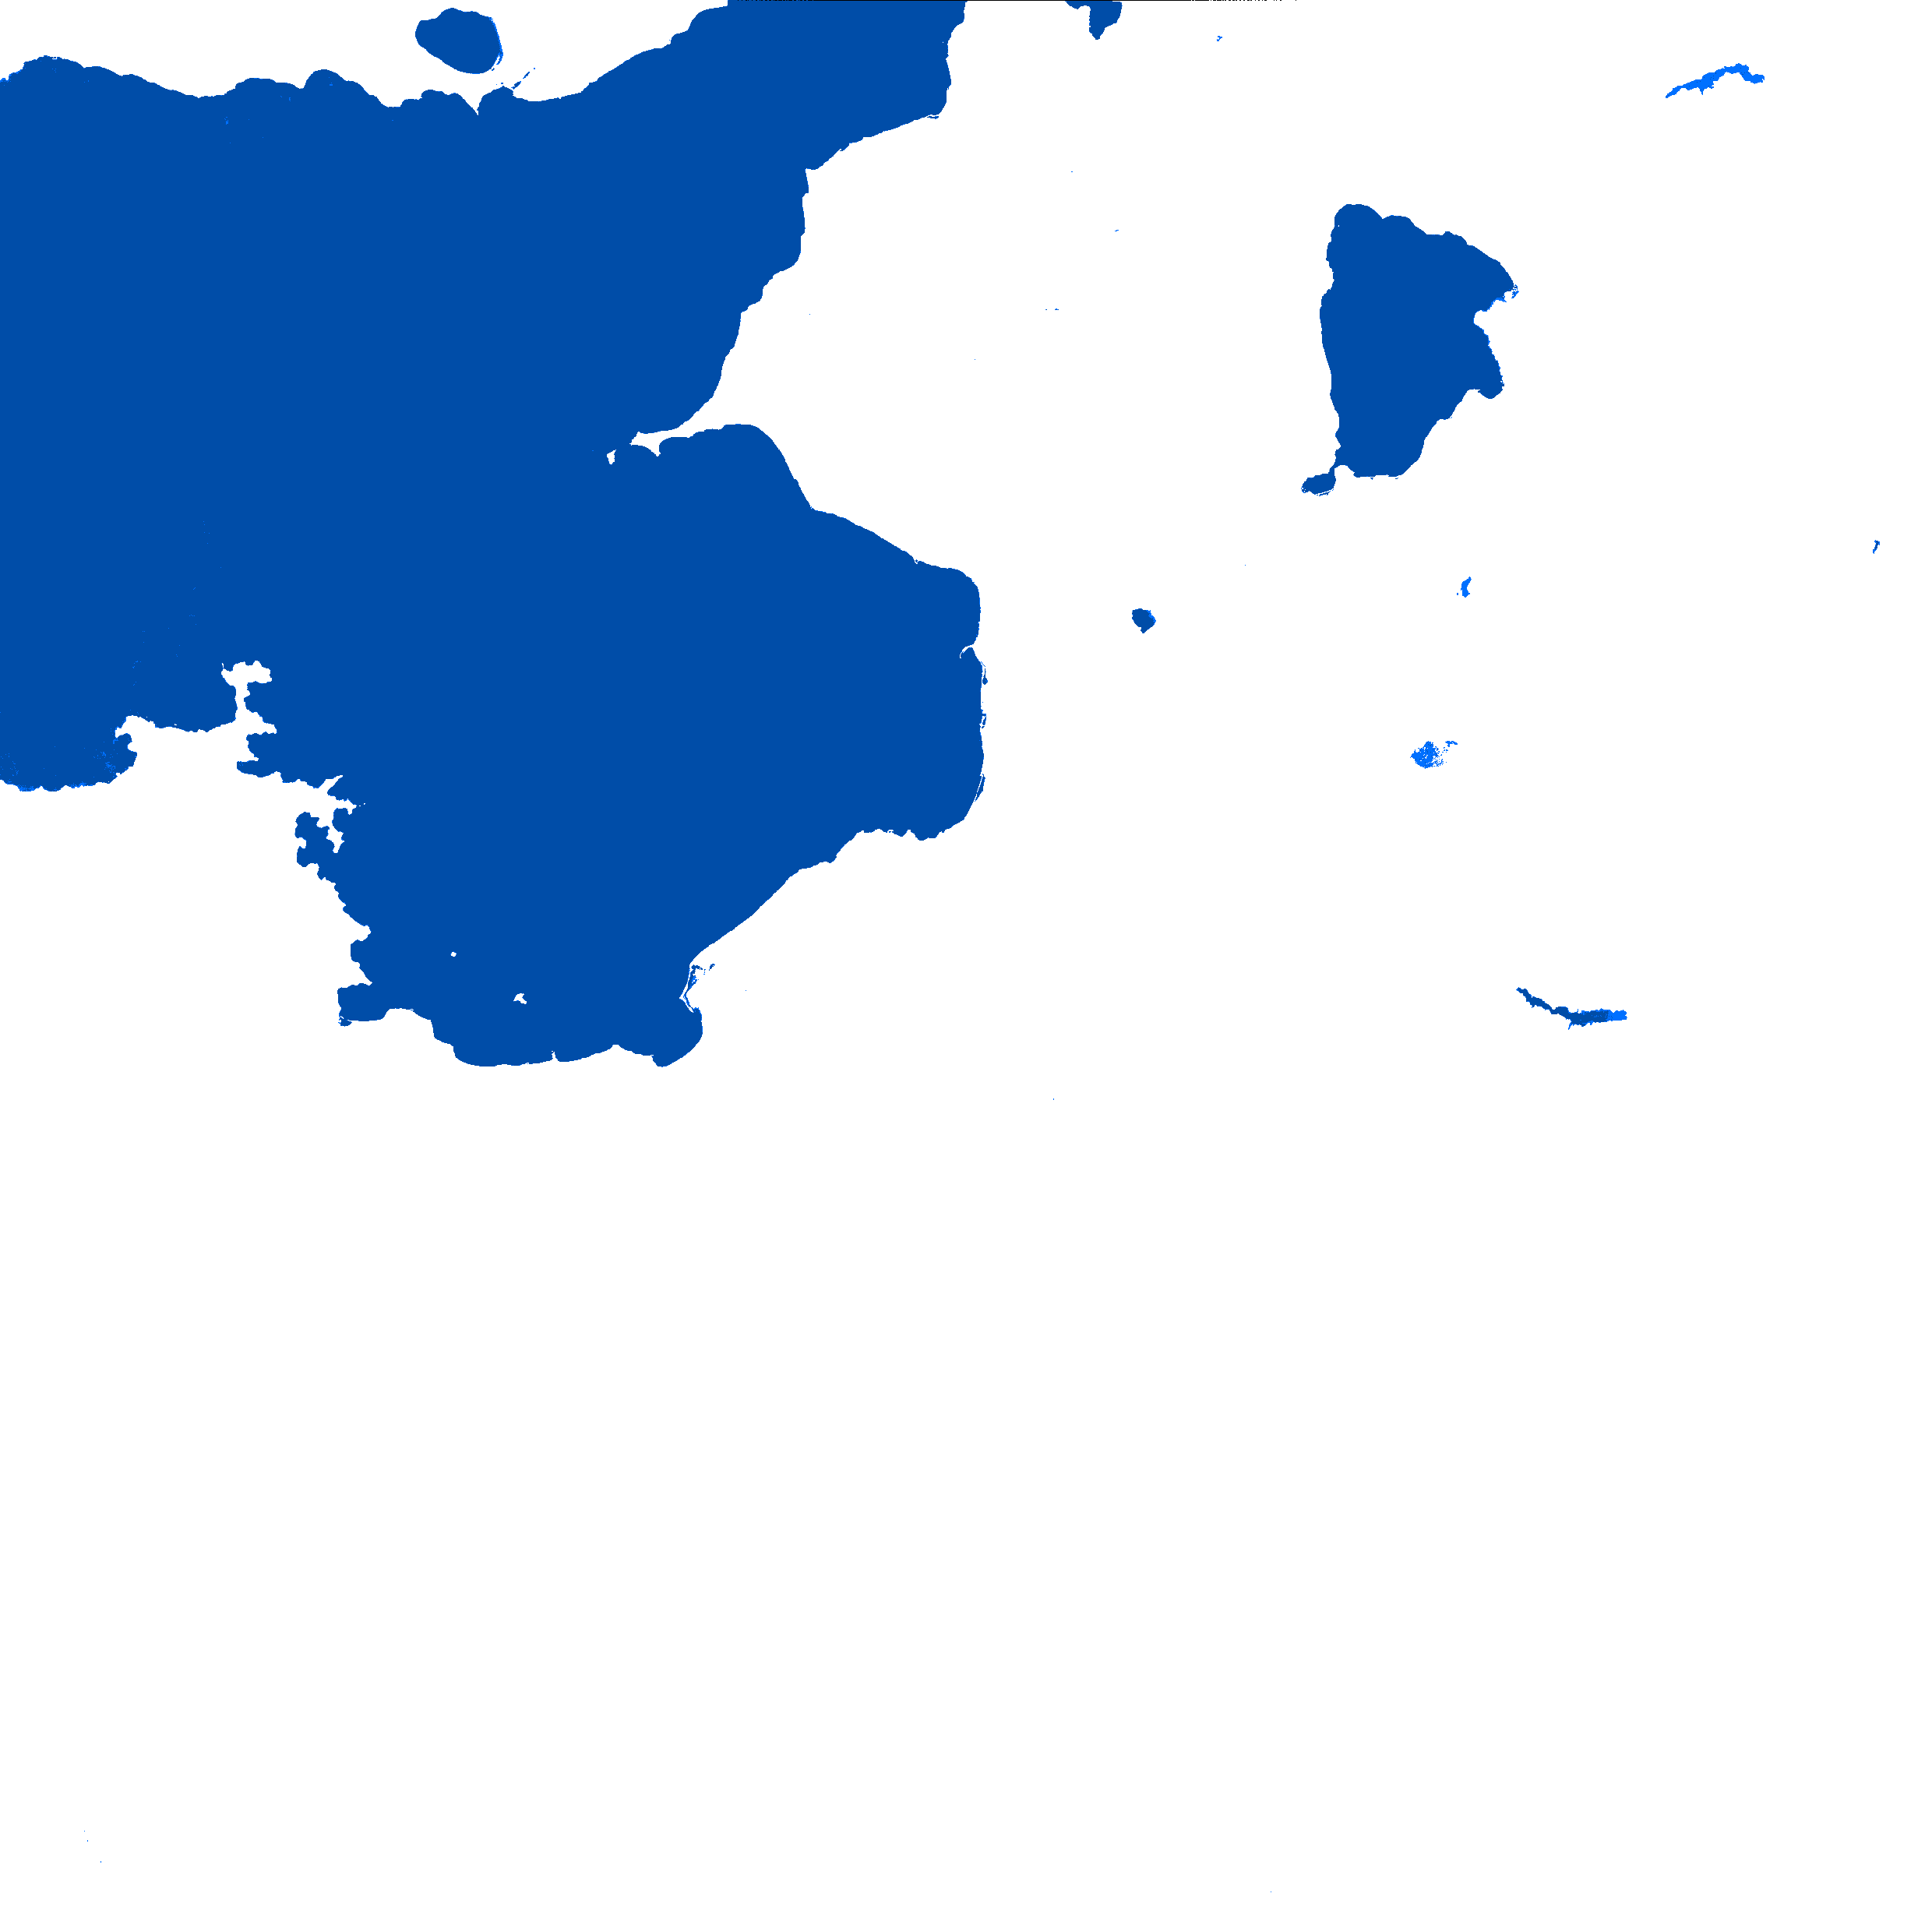
This is the metadata covering the Water Layer (WL) product. The WL is one of the products of the pan-European High-Resolution Water Snow & Ice portfolio (HR-WSI), which are provided at high spatial resolution from the Sentinel-2 and Sentinel-1 constellations data from September 1, 2016 onwards.. The WL is generated for the 2021 & 2024 reference year. It is a a multi-annual product based on the information covering the period (e.g. 2016-2021). In the context of the HR-WSI, the water and dry frequency masks are derived from intermediate outputs of the WCD workflow, the monthly surface water masks in combination with the WIC S2 NRT product. It provides detailed information about the presence and condition of water surfaces across Europe. There are 5 major classes like: - Dry (always or mostly dry with minor instances of wet) - permanent water (always contains water) - temporary water ( temporary water surfaces, aliteration of dry and water) - sea water (oceans and sea) - clouds It is also generated in different spatial resolutions (10m and 100m) and projections (LAEA & WGS84/UTM). The High Resolution Water Layer portfolio consists of the WL, the Water Presence Index (WPI), the Water confidence layer (WCL) and the Rolling archive (WLRA). The WL is provided in a package (zip) containing the WL, the WPI and the WCL: The WCL is displaying a measure of confidence between 0 and 100%. It identifies the likelihood of (in)correctness on pixel level based on information gained during production for the WL for the respective reference year. It is also generated in different spatial resolutions (10m and 100m) and projections (LAEA & WGS84/UTM). The Water Presence Index (WPI) product is one of the products of the pan-European High-Resolution Water Snow & Ice portfolio (HR-WSI), which are provided at high spatial resolution from the Sentinel-2 and Sentinel-1 constellations data from September 1, 2016 onwards. The High Resolution Water Layer portfolio consists of the Water Layer (WL), the Water Presence Index (WPI), the Water confidence layer (WCL) and the Rolling archive (WLRA). The WPI is generated for the 2021 reference year. It is a a multi-annual product based on the information covering a7-year period (e.g. 2016-2021). In the context of the HR-WSI, the water and dry frequency masks are derived from intermediate outputs of the WCD workflow, the monthly surface water masks in combination with the WIC S2 NRT product. It provides detailed information about the presence and condition of water surfaces across Europe. It is also generated in different spatial resolutions (10m and 100m) and projections (LAEA & WGS84/UTM).
-

Urban Atlas Land Cover/Land Use 2021 provides reliable, inter-comparable, high-resolution land use and land cover data for 790 Functional Urban Areas (FUA) with more than 50,000 inhabitants for the 2021 reference year in EEA38 countries (EU, EFTA, Western Balkans countries, as well as Türkiye) and the United Kingdom.
-
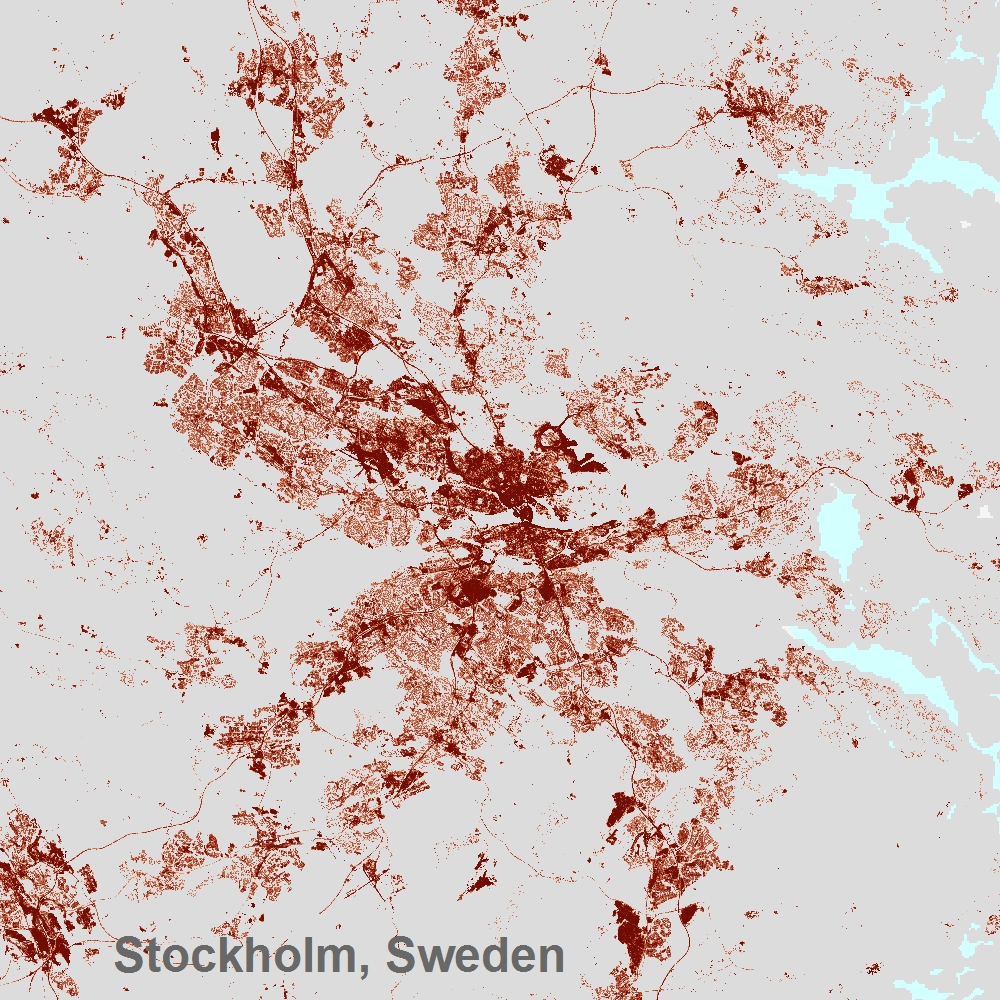
The High Resolution Layer on Imperviousness Density 2018 with 100 m resolution is a thematic product showing the sealing density in the range from 0-100% in an aggregated version (100m) for the period 2018 (including data from 2017-2019) for the EEA-38 area and the United Kingdom. The production of the high resolution imperviousness layers is coordinated by EEA in the frame of the EU Copernicus programme. The high resolution imperviousness products capture the percentage and change of soil sealing. Built-up areas are characterized by the substitution of the original (semi-) natural land cover or water surface with an artificial, often impervious cover. These artificial surfaces are usually maintained over long periods of time. A series of high resolution imperviousness datasets (for the 2006, 2009, 2012, 2015 and 2018 reference years) with all artificially sealed areas was produced using automatic derivation based on calibrated Normalized Difference Vegetation Index (NDVI). This series of imperviousness layers constitutes the main status layers. They are per-pixel estimates of impermeable cover of soil (soil sealing) and are mapped as the degree of imperviousness (0-100%). Imperviousness change layers were produced as a difference between the reference years (2006-2009, 2009-2012, 2012-2015, 2015-2018 and additionally 2006-2012, to fully match the CORINE Land Cover production cycle) and are presented 1) as degree of imperviousness change (-100% -- +100%), in 20m and 100m pixel size, and 2) a classified (categorical) 20m change product. The dataset in 100 meter aggregate raster (fully conformant with the EEA reference grid) is provided as a full EEA38 and United Kingdom mosaic.
-

The high resolution imperviousness products capture the percentage and change of soil sealing. Built-up areas are characterized by the substitution of the original (semi-) natural land cover or water surface with an artificial, often impervious cover. These artificial surfaces are usually maintained over long periods of time. A series of high resolution imperviousness datasets (for the 2006, 2009, 2012, 2015 and 2018 reference years) with all artificially sealed areas was produced using automatic derivation based on calibrated Normalized Difference Vegetation Index (NDVI). This series of imperviousness layers constitutes the main status layers. They are per-pixel estimates of impermeable cover of soil (soil sealing) and are mapped as the degree of imperviousness (0-100%). Imperviousness change layers were produced as a difference between the reference years (2006-2009, 2009-2012, 2012-2015, 2015-2018 and additionally 2006-2012, to fully match the CORINE Land Cover production cycle) and are presented 1) as degree of imperviousness change (-100% -- +100%), in 20m and 100m pixel size, and 2) a classified (categorical) 20m change product.
-
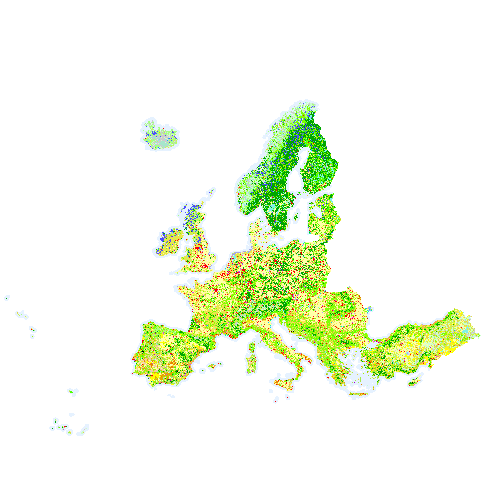
Corine Land Cover 2018 (CLC2018) is one of the Corine Land Cover (CLC) datasets produced within the frame the Copernicus Land Monitoring Service referring to land cover / land use status of year 2018. CLC service has a long-time heritage (formerly known as "CORINE Land Cover Programme"), coordinated by the European Environment Agency (EEA). It provides consistent and thematically detailed information on land cover and land cover changes across Europe. CLC datasets are based on the classification of satellite images produced by the national teams of the participating countries - the EEA members and cooperating countries (EEA39). National CLC inventories are then further integrated into a seamless land cover map of Europe. The resulting European database relies on standard methodology and nomenclature with following base parameters: 44 classes in the hierarchical 3-level CLC nomenclature; minimum mapping unit (MMU) for status layers is 25 hectares; minimum width of linear elements is 100 metres. Change layers have higher resolution, i.e. minimum mapping unit (MMU) is 5 hectares for Land Cover Changes (LCC), and the minimum width of linear elements is 100 metres. The CLC service delivers important data sets supporting the implementation of key priority areas of the Environment Action Programmes of the European Union as e.g. protecting ecosystems, halting the loss of biological diversity, tracking the impacts of climate change, monitoring urban land take, assessing developments in agriculture or dealing with water resources directives. part of the European Copernicus Programme coordinated by the European Environment Agency, providing environmental information from a combination of air- and space-based observation systems and in-situ monitoring.
-
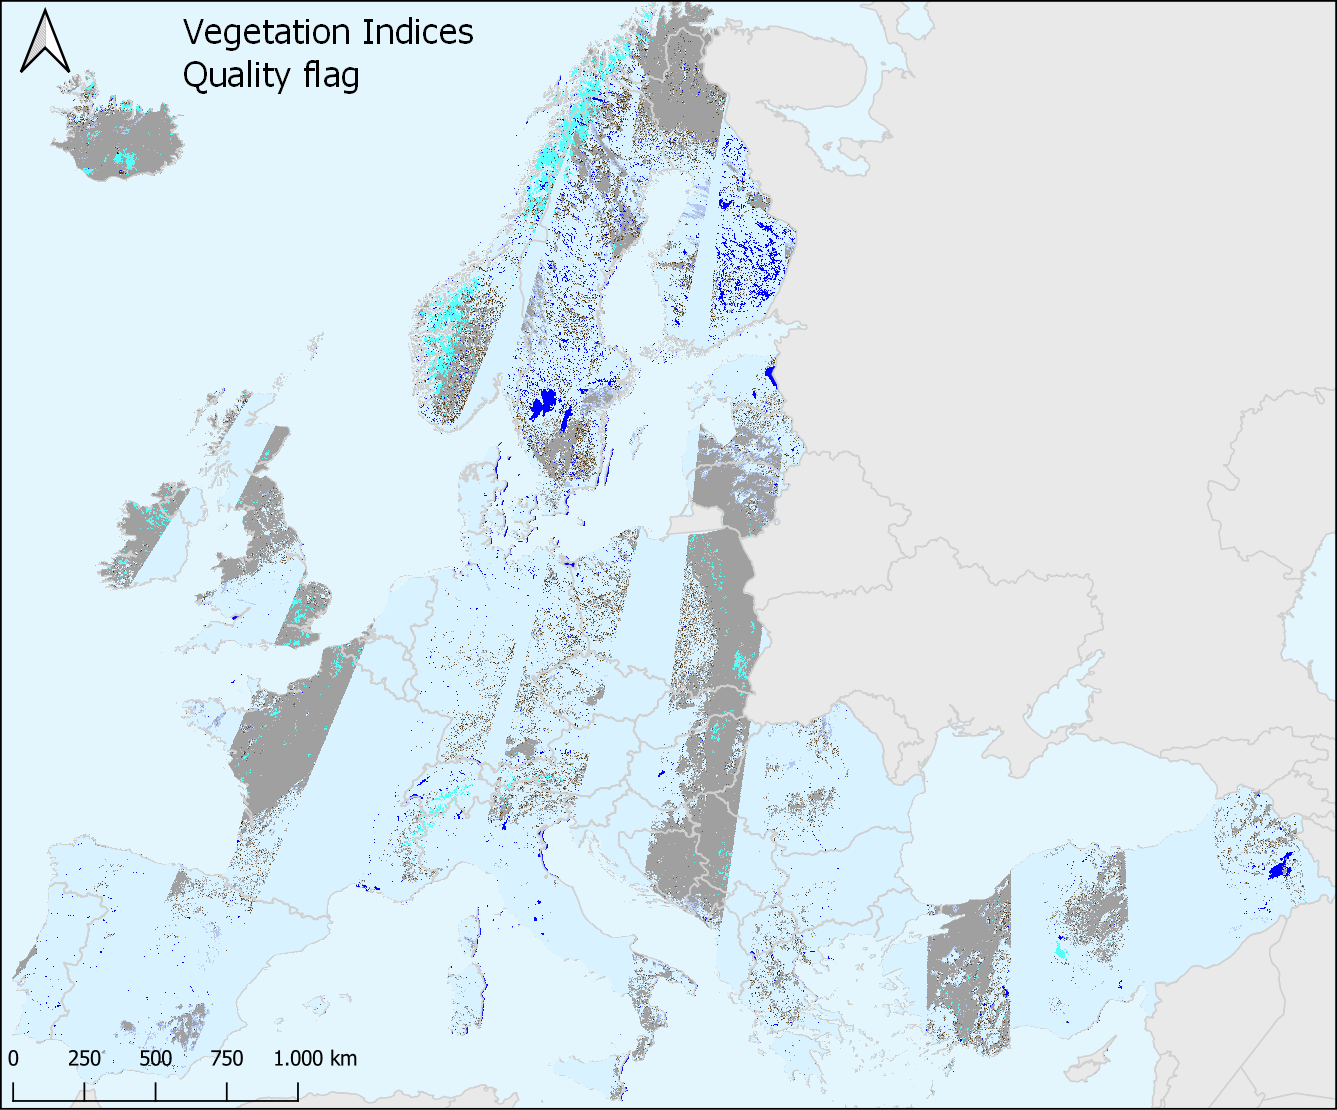
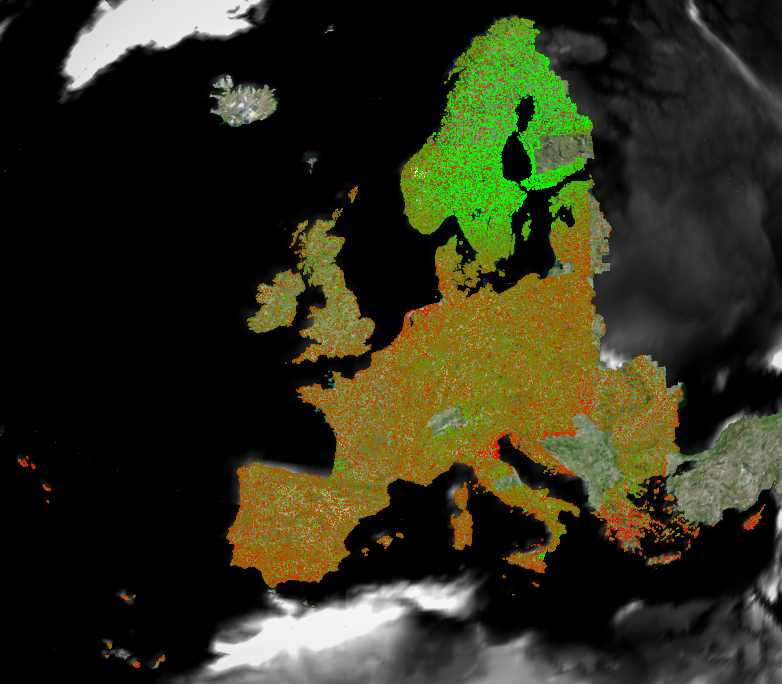
This metadata refers to the Quality Flag (QFLAG2) dataset, one of the near real-time (NRT) Vegetation Index products of the pan-European High Resolution Vegetation Phenology and Productivity (HR-VPP), component of the Copernicus Land Monitoring Service (CLMS). The Quality Flag (QFLAG2) is a quality indicator that assists users with the screening of clouds, shadows from clouds and topography, other dark areas, snow and water surfaces in their analysis of the four related Vegetation Indices datasets: the Plant Phenology Index (PPI), the Normalized Difference Vegetation Index (NDVI), the Leaf Area Index (LAI) and the Fraction of Absorbed Photosynthetically Active Radiation (FAPAR). The QFLAG2 dataset is made available as raster files with 10 x 10m resolution, in UTM/WGS84 projection corresponding to the Sentinel-2 tiling grid, for those tiles that cover the EEA38 countries and the United Kingdom and for the period from October 2016 until today, with daily updates.
-

Corine Land Cover Change 2012-2018 (CHA1218) is one of the Corine Land Cover (CLC) datasets produced within the frame the Copernicus Land Monitoring Service referring to changes in land cover / land use status between the years 2012 and 2018. CLC service has a long-time heritage (formerly known as "CORINE Land Cover Programme"), coordinated by the European Environment Agency (EEA). It provides consistent and thematically detailed information on land cover and land cover changes across Europe. CLC datasets are based on the classification of satellite images produced by the national teams of the participating countries - the EEA members and cooperating countries (EEA39). National CLC inventories are then further integrated into a seamless land cover map of Europe. The resulting European database relies on standard methodology and nomenclature with following base parameters: 44 classes in the hierarchical 3-level CLC nomenclature; minimum mapping unit (MMU) for status layers is 25 hectares; minimum width of linear elements is 100 metres. Change layers have higher resolution, i.e. minimum mapping unit (MMU) is 5 hectares for Land Cover Changes (CHA), and the minimum width of linear elements is 100 metres. The CLC service delivers important data sets supporting the implementation of key priority areas of the Environment Action Programmes of the European Union as e.g. protecting ecosystems, halting the loss of biological diversity, tracking the impacts of climate change, monitoring urban land take, assessing developments in agriculture or dealing with water resources directives. part of the European Copernicus Programme coordinated by the European Environment Agency, providing environmental information from a combination of air- and space-based observation systems and in-situ monitoring.