 Arctic SDI catalogue
Marine biology
Type of resources
Topics
Keywords
Contact for the resource
Provided by
Years
Formats
Representation types
Update frequencies
status
Service types
-

PURPOSE: To provide access to detailed stomach content data and associated metadata from Atlantic Bluefin Tuna sampled in the southern Gulf of St. Lawrence from 2018 to 2023. These data support fisheries science by contributing to analyses of predator–prey dynamics, diet composition, and ecosystem understanding, as well as informing stock assessment and fisheries management activities within Fisheries and Oceans Canada. DESCRIPTION: This dataset contains metadata and stomach content information collected from Atlantic Bluefin Tuna (ABFT) caught from mid-August to late September in the commercial fishery in the southern Gulf of St. Lawrence between 2018 and 2023. Stomach samples were primarily obtained from fish harvested near the eastern end of Prince Edward Island, with additional samples collected from the Miscou/Baie‑des‑Chaleurs area in 2018 and 2019. SAMPLING METHODS: Fish were measured to the nearest curved fork length (cm) and weighed to the nearest round weight (kg). Stomachs were obtained directly from harvesters or through a fish buyer and were stored at −20 ◦C before being processed in the laboratory. Stomachs identification numbers were cross-referenced with ABFT tag numbers recorded by fish provider in order to obtain logbook and port data (catch location, time, weight length, sex, gear, etc.) for each sample. Stomachs were thawed in the laboratory and the content was sorted and identified to the lowest possible taxonomic level. For each stomach, prey were weighed collectively as a taxonomic group and individually to the nearest 0.1 g. Dead bait used to capture ABFT, identified by cut marks, were recorded and weighed but excluded from the analysis. Live bait items cannot be identified from stomach content analyses. Only a few otoliths were found in 2018 and their degraded quality precluded performing ageing or species identification. Rare and small prey items such as algae and rocks were classified in the category “other”. Fish remains that could not be identified were classified in the category “Unidentified teleostei remains”. For 2019 to 2023, when stomach content items could not be visually identified and when tissue was available, tissue samples were collected and stored at −20 °C for DNA barcoding analysis. DNA extraction, mitochondrial cytochrome oxidase subunit 1 amplification, Sanger sequencing and species assignation were performed at the Plateforme d’Analyses Génomiques and Plateforme Bio-informatique of the Institut de Biologie Intégrative et des Systèmes (PAG-IBIS, Université Laval, Quebec city, QC, Canada, http://www.ibis.ulaval.ca/en/services-2/genomic-analysis-platform/). DNA was extracted from 20 mg of muscle tissue using the Omega Bio-tek E-Z-96 Tissue DNA Kit (Omega Bio-tek, Norcross GA, USA) following manufacturer instructions. The mitochondrial cytochrome oxidase subunit 1 region was amplified and sequenced as described in Hashemzadeh Segherloo et al., 2021). Sanger forward and reverse reads were analyzed independently using the Basic Local Alignment Search Tool against non-redundant sequences to identify the top hit for each sequence. When samples could not be identified by a top hit sequence they were classified as “unidentifiable fish”. Prey items that were successfully identified using DNA barcoding were incorporated into the stomach content analysis database and used in all subsequent diet analyses (abundance, occurrence and weight). The weight of the items used in the database was the weight of the remains as they were, and not reconstructed weights calculated for a live animal of the species identified by the barcoding. USE LIMITATION: To ensure scientific integrity and appropriate use of the data, we would encourage you to contact the data custodian.
-

Aquatic invasive species pose economic and ecological threats to Canada's coastal waters. In response, Fisheries and Oceans Canada (DFO) has established monitoring programs to detect and track the spread of aquatic invasive species, including European Green Crab, in Canadian waters. Fukui traps have been deployed annually at both new and long-term monitoring locations throughout coastal British Columbia.
-
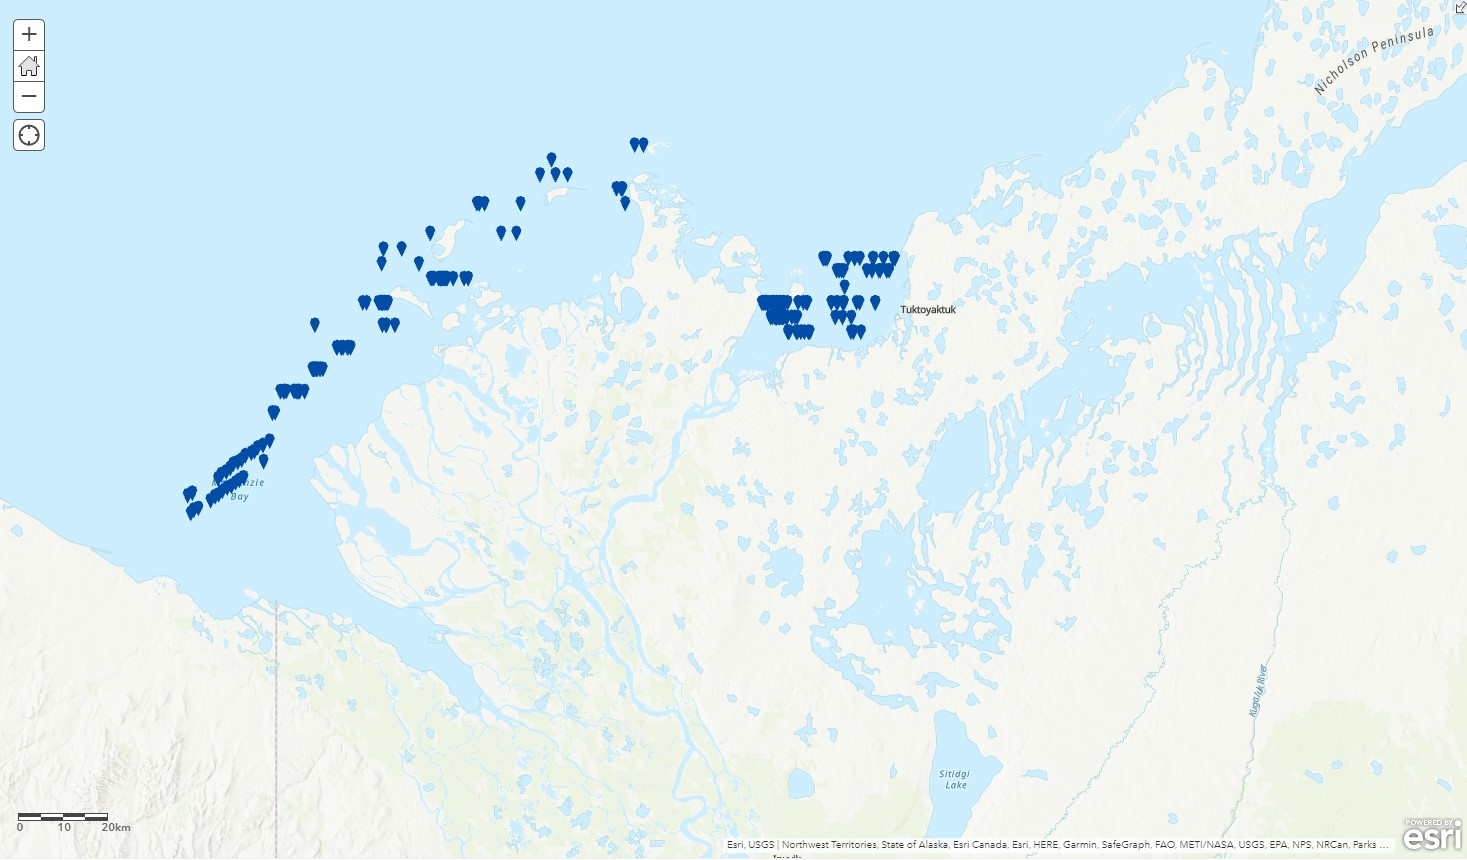
This record contains data on beluga whale locations in the Mackenzie estuary reported in Harwood, L.A. and P. Norton (1996). Aerial survey data from the southeast Beaufort Sea, Mackenzie River estuary and west. Amundsen Gulf, July 1992. Canadian Data Report of Fisheries and Aquatic Sciences No. 964
-

PURPOSE: Eastern Beaufort Sea beluga whales form one of the largest summering aggregations of the species in the Mackenzie Estuary. In 2010, the Tarium Niryutait Marine Protected Area (TNMPA) was designated to protect beluga whales and their habitats As a part of ongoing ecological monitoring efforts in the TN MPA, passive acoustic monitoring (PAM) was implemented in 2011 to act as continuous monitoring method, filling the temporal gaps associated with historical aerial surveys. Beginning in 2014, PAM effort increased each year, and oceanographic sensors were added to moorings to (1) better understand oceanographic conditions within the TN MPA and (2) examine the environmental parameters that drive beluga movement and habitat use patterns within the estuary. Several studies using this dataset have been completed, and others are ongoing. However, much more can be done with the acoustic and environmental data. The purpose of this report is to outline deployment methods and instrument settings for moorings to support the full use of the data collected. DESCRIPTION: Each summer, Eastern Beaufort Sea beluga whales form one of the largest aggregations of the species in the Mackenzie Estuary. In 2010, the Tarium Niryutait Marine Protected Area (TNMPA) was designated in the estuary to protect beluga whales and their habitats. As a part of ongoing ecological monitoring efforts in the TN MPA, passive acoustic monitoring (PAM) was implemented in 2011 to act as continuous monitoring method, filling the temporal gaps associated with historical aerial surveys. Beginning in 2014, PAM effort increased each year, and oceanographic sensors were added to each PAM mooring to (1) better understand oceanographic conditions (i.e., temperature, salinity, turbidity, and wave conditions) within the TN MPA and (2) to examine the environmental parameters that drive beluga movement and habitat use patterns within the estuary. Moorings have been deployed with varying configurations of oceanographic sensors in Kugmallit Bay since 2015, but typically record water temperature, salinity, depth, and wave conditions. In 2018, the program was expanded to the Niaqunnaq parcel of the MPA (Shallow Bay), and in 2021 it was expanded again to the Okeevik parcel of the MPA. These observatories have provided new knowledge about drivers of beluga habitat use in the TN MPA, in particular in Kittigaryuit, but more recently in Niaqunnaq and Okeevik.
-

A literature review, focusing on oil sand products (e.g., diluted bitumen), diluents, spill-treating agents, and crude oil toxicology and ecological studies, relevant to the northeast Pacific was compiled as part of the Government of Canada’s World Class Tanker Safety program. Of the 763 references identified, 14 involved diluted bitumen and other heavy crude oils, indicating the need for further research of these products in the marine environment. Diluent research suggests relatively fast evaporation and dispersion times for this component, however high toxicities may pose a threat to marine biota. Historical studies indicate older dispersant formulations had potential ecological implications, therefore newer formulations, which have not been studied in detail, require full assessment. Consistent utilization of toxicology standards remains elusive, hindering species sensitivity analyses. Exxon Valdez literature demonstrates highly variable impacts from a single oil type and the need for baseline data, recovery status, and suitable ecological end-point determination.
-

Polygons denoting concentrations of sea pens, small and large gorgonian corals and sponges on the east coast of Canada have been identified through spatial analysis of research vessel survey by-catch data following an approach used by the Northwest Atlantic Fisheries Organization (NAFO) in the Regulatory Area (NRA) on Flemish Cap and southeast Grand Banks. Kernel density analysis was used to identify high concentrations and the area occupied by successive catch weight thresholds was used to identify aggregations. These analyses were performed for each of the five biogeographic zones of eastern Canada. The largest sea pen fields were found in the Laurentian Channel as it cuts through the Gulf of St. Lawrence, while large gorgonian coral forests were found in the Eastern Arctic and on the northern Labrador continental slope. Large ball-shaped Geodia spp. sponges were located along the continental slopes north of the Grand Banks, while on the Scotian Shelf a unique population of the large barrel-shaped sponge Vazella pourtalesi was identified. The latitude and longitude marking the positions of all tows which form these and other dense aggregations are provided along with the positions of all tows which captured black coral, a non-aggregating taxon which is long-lived and vulnerable to fishing pressures. These polygons identify sea pen fields from the broader distribution of seapens in the region as sampled by Alfredo trawl gear in the Eastern Arctic biogeographic zone. A 0.25 kg minimum threshold for the sea pen catch was identified as the weight that separated the sea pen field habitat from the broader distribution of sea pens with these research vessel tow data and gear type.
-

This record contains two datasets: 1. Raw unfiltered geographic coordinates and accuracy estimates of ringed seals tagged in the Western Canadian Arctic and 2. The location estimate from state-space models using a 12-hr time step. In total, 17 ringed seals were captured, measured, weighed, and tagged with satellite-linked transmitters (SDR-10, SDR-16, SPLASH) in June and July of 1999, 2000, and 2010. The tags, manufactured by Wildlife Computers Ltd. (Redmond, Washington, USA), sent data to polar orbiting satellites. Data were then retrieved via the Argos system (Harris et al., 1990). Tags collected and relayed information on movement (geographic positions) and diving data of the instrumented animals.
-
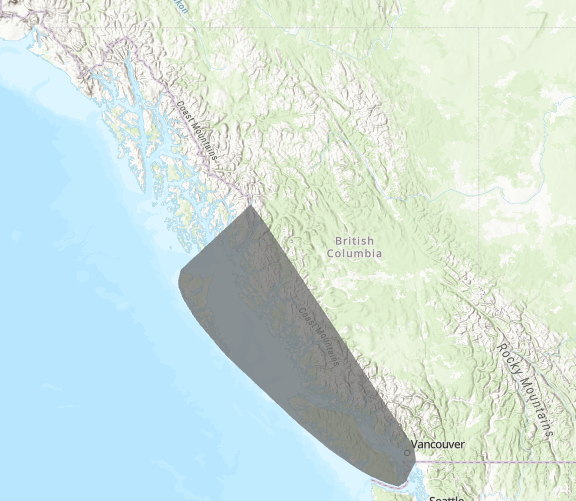
To ensure informed decision-making, management, and conservation of marine ecosystems along the British Columbia (BC) coastline, a comprehensive understanding of marine communities and habitats is necessary. Marine planning initiatives, including environmental incident response planning and the development of a marine protected area network, have long been challenged by significant gaps in our knowledge of the distribution of many nearshore marine species. This lack of critical information can impede our ability to effectively manage and protect vulnerable species and ecosystems. We developed a set of species distribution models (single-SDMs) using data collected from the benthic habitat mapping survey. These models correlate species occurrence data with environmental variables. We used these models to make predictions of the probability of occurrence of each species across the entire BC coast. A cluster analysis of the single-SDM predictions was then used to determine biotopes, which are distinct combinations of physical and chemical water properties and associated biological communities. We defined and mapped the spatial distribution and probability of nine nearshore macrofauna epibenthic biotopes along with three physiotopes based on environmental conditions. The definition of the biotopes includes correlated species, the type of substrate, and range of environmental conditions (slope, depth, current, temperature, salinity, and tidal current) occurring within each biotope. The biotopes defined here are a first, but important, step in quantitative bioregionalization for the Pacific region as the resolution of nearshore marine community information has been lacking in BC and has hindered marine spatial initiatives. This dataset contains 71 of the 72 single-SDMs (which excludes Northern abalone, an endangered species), the spatial distribution of 9 biotopes and 3 physiotopes, and the species richness calculated as the sum of occurrence probabilities across all 72 species.
-
Fleming Survey of Juvenile Atlantic Cod in Coastal Avalon and Northeast Newfoundland (NAFO Div. 3KL)

The Department of Fisheries established a survey of demersal juvenile Atlantic cod (*Gadus morhua*) in the nearshore (<10 m deep) in 1959. This survey aimed to characterize the distribution and abundance of juvenile Atlantic cod and was based upon Norway's Flodevigen sampling program which has been conducted continuously since 1919. A 25 m seine was used to sample juvenile Atlantic cod nursery locations on the Avalon Peninsula and Northeast coast of the island of Newfoundland in September and October. The survey continued until 1964 and became known as the Fleming survey, after original initiator Alistair Fleming. The survey was reinstated by Memorial University of Newfoundland from 1992 to 1997. Multiple tows were conducted at a subset of the original 55 Fleming sites located in St. Mary's Bay, Trepassey Bay, the Southern Shore, Conception Bay, Trinity Bay, Bonavista Bay, Gander Bay, New World Island, Fortune Harbour, Badger Bay, Halls Bay and Green Bay. This data set includes several different subsets, some of which span both Fleming Survey periods (1959-1964 and 1992-1997): I. JuvCodCatch60s90s: Catches of juvenile Atlantic cod (1959-1964, 1992-1997) from the first two consecutive tows at each site. This is a summary based on JuvCodLengths90s and FlemingSurveyData60s; II. JuvCodLength90s: Lengths of all individual juvenile Atlantic cod caught for each site (1992-1997); III. SiteEnvData60s90s: Station data for Fleming data 1992-1997; IV. FlemingSurveyData60s: Fleming survey data from 1959-1964 (note there are three record types pertaining to: station data "type 1"; general species catch data including juvenile Atlantic cod grouped by age class ("1+", "Zeroes", and "Total") "type 2; and juvenile Atlantic cod (species 223) listed in length bins "type 3"; and V. FlemingBycatch60s92to96: Bycatch data from 1959-1964 & 1992-1996 from first two tows at each site. This is a summary based partly on the FlemingSurveyData60s set.
-

The Coastal Biodiversity Trawl Survey for the Passamaquoddy Bay was conducted annually between July to October from 2009 to 2019. This survey was intended to monitor long-term change in local species presence, habitat utilization, and health. The sampling activities support coastal research in fisheries, aquaculture, marine protected areas, and ecosystem change. Data collected prior to 2013 are generally not recommended for comparative analysis due to changes in vessel, sampling effort, and protocols. For additional information please see: - Cooper, J.A. and Blanchard, M.J. 2016. Coastal Biodiversity Trawl of the Passamaquoddy Bay Area: 2009 to 2014. Can. Tech. Rep. Fish. Aquat. Sci. 3176: xi+52 p.