 Arctic SDI catalogue
North Atlantic Ocean
Type of resources
Available actions
Topics
Keywords
Contact for the resource
Provided by
Years
Formats
Representation types
Update frequencies
status
Service types
Resolution
-

PURPOSE: Freshwater discharge is used to force eastern Canadian ocean models DESCRIPTION: Neural network post-processed WRF-Hydro streamflow timeseries at 477 oceanic river outlets, where lat/lon are proxy position, riverlat/lon are outlet position, and oceanlat/lon are ocean pour points that are displaced slightly into the ocean (next to outlet position on the WRF-Hydro grid). The 477 eastern Canadian rivers were modelled using WRF-Hydro, which was forced by four CMIP models subject to WRF downscaling of atmospheric forcing. The four models are an NCAR Community Climate System Model (CCSM-4 SSP5 8.5) simulation (Meehl et al., 2012), two Met Office Hadley Centre Global Environmental Model (HadGEM2 SSP2 4.5 and SSP5 8.5) simulations (Collins et al., 2011), and a Max Planck Institute for Meteorology Earth System Model (MPI-ESM1.2-LR SSP5 8.5) simulation (Mauritsen et al., 2019). Variables and their descriptions are included in the NetCDF file. USE LIMITATION: To ensure scientific integrity and appropriate use of the data, we would encourage you to contact the data custodian.
-

The lobster recruitment project is run by the Fishermen and Scientist Research Society (FSRS) through DFO funding. Fishermen participating in the lobster recruitment project collect information about lobster in their fishing area by fishing 2-5 scientific project traps (SPTs) (fished in fixed locations) within the regular commercial season. The SPTs used in all fishing areas are smaller than commercial traps and designed to primarily catch juvenile lobsters below the legal-size limit. These traps are additional to the vessel's legal number of commercial traps. The lobster recruitment project has more than 120 fishers participating from all LFAs along the Atlantic coast of Nova Scotia from LFA 27 in Cape Breton to LFA 35 in the Bay of Fundy (excluding LFA 28, who have not participated to-date). The number of fishermen per LFA and number of SPTs per fisherman are decided on by the LFA Advisory Committees. This decision considers how much additional effort they were comfortable having in the LFA (i.e. number of SPTs) and from how many traps each fisher could be reasonably expected to collect data. It is also important to have fishers dispersed enough to maximize study footprint. DFO Science consults on project design. SAMPLING METHODS: The fishers record the number, sex and length of lobsters captured in each SPT, as well as presence of eggs, tags or v-notch. Bottom temperatures are monitored by placing a temperature recorder in one of their SPTs for the entire lobster season. Cite this data as: Tibbets-Scott, S., Zisserson, B. Data of: Fishermen and Scientist Research Society (FSRS) Lobster Recruitment Trap Project. Published: November 2020. Population Ecology Division, Fisheries and Oceans Canada, Dartmouth, N.S. https://open.canada.ca/data/en/dataset/a88f9b4d-b59a-44f6-ae7e-d36550266940
-

PURPOSE: To provide a permanent repository of key data series necessary to build a range-wide American eel stock assessment. DESCRIPTION: This collection presents data associated with the following report: Cairns, D.K. 2020. Landings, abundance indicators, and biological data for a potential range-wide American eel stock assessment. Canadian Data Report of Fisheries and Aquatic Science. No. 1311: v + 180 pp. Much of the data collection is from the Atlantic Provinces of Canada, particularly the Southern Gulf of St. Lawrence. The collection also includes data from elsewhere in the American eel's range in Canada, and also the United States and the Caribbean Basin. Files in the collection are as follows. Cairns2020_AnnexA_ReportTables.xlsx: This Excel file (file size 756 kb) contains all 37 tables in Cairns (2020) exactly as they appear in the report. Cairns2020_AnnexB_EelLengthsAgesEfishingRecords.xlsx: This Excel file (file size 3.1 mb) contains 20,047 records of American eel lengths and other biological data from the Canadian Atlantic Provinces, 1983-2017. Records include weights of 8,915 eels and ages of 2,212 eels. Records of 3,224 electrofishing sessions in the Miramichi River, New Brunswick, 1952-2019, and records of 2,590 electrofishing sessions in the Restigouche River, New Brunswick, 1972-2019 are included. Cairns2020_AnnexC_EelLengthsAgesDataDefinitions.csv: This .csv file (file size 4 kb) gives data definitions in English and French for the table of eel lengths and other biological data that is contained in Cairns2020_AnnexB_EelLengthsAgesEfishingRecords.xlsx and in Cairns2020_AnnexD_EelLengthsAges.csv. Cairns2020_AnnexD_EelLengthsAges.csv: This file (file size 2.0 mb) presents in .csv format the table of eel lengths and other biological data that is also presented in Cairns2020_AnnexB_EelLengthsAgesEfishingRecords.xlsx. Cairns2020_AnnexE_EelEFishingDataDefinitions.csv: This .csv file (file size 2 kb) gives data definitions in English and French for the table of eel electrofishing data that is contained in Cairns2020_AnnexB_EelLengthsAgesEfishingRecords.xlsx and in Cairns2020_AnnexD_EelLengthsAges.csv. Cairns2020_AnnexF_EelEFishing.csv: This file (file size 314 kb) presents in .csv format the table of eel electrofishing data that is also presented in Cairns2020_AnnexB_EelLengthsAgesEfishingRecords.xlsx. Cairns2020_AnnexG_OtolithImageMetadata.csv: This .csv file (file size 2 kb) provides metadata for the collection of eel otolith images. Files with names starting with EelOtos . . . . : These .tif, .jpg, and .bmp image files are in zipped format with a summed size of 5.3 gb. The files give magnified photos of 1,838 eel otoliths that have been prepared for age reading. Samples are from the Atlantic Provinces of Canada. Individual otolith codes in Cairns2020_AnnexB_EelLengthsAgesEfishingRecords.xlsx and in Cairns2020_AnnexC_EelLengthsAgesDataDefinitions.csv match the codes embedded in otolith image filenames. PARAMETERS COLLECTED: American eel landings, number caught, and effort of commercial and research fishing gear. American eel lengths, ages, sex and other biological data and sampling locations. NOTES ON QUALITY CONTROL: All keypunched records of landings, densities, and other data were verified against original sources. Landings and abundance indices were reviewed in a Department of Fisheries and Oceans scientific workshop and corrected as necessary. Length and age data were examined by length-weight and length age plots and implausible records were discarded. PHYSICAL SAMPLE DETAILS: No physical samples SAMPLING METHODS: Landings are from government fisheries agencies. Abundance indices are from commercial fyke, spear, and trap catch per unit effort, and from research ladder counts and electrofishing records. Mean elver lengths are compiled from published literature Sex ratios are compiled from published literature Locations of biological and genetic sampling are compiled from published literature American eel lengths are total length of live specimens. Ages are from otolith annulus readings Electrofishing records are from backpack electrofishing surveys in wadeable waters USE LIMITATION: To ensure scientific integrity and appropriate use of the data, we would encourage you to contact the data custodian.
-
Water_body_dissolved_inorganic_nitrogen - Monthly Climatology for the European Seas for the period 1960-2023 on the domain from longitude -45.0 to 70.0 degrees East and latitude 24.0 to 83.0 degrees North. Data Sources: observational data from SeaDataNet/EMODnet Chemistry Data Network. Description of DIVA analysis: The computation was done with the DIVAnd (Data-Interpolating Variational Analysis in n dimensions), version 2.7.12, using GEBCO 30sec topography for the spatial connectivity of water masses. Horizontal correlation length and vertical correlation length vary spatially depending on the topography and domain. Depth range: 0.0, 5.0, 10.0, 15.0, 20.0, 25.0, 30.0, 35.0, 40.0, 45.0, 50.0, 55.0, 60.0, 65.0, 70.0, 75.0, 80.0, 85.0, 90.0, 95.0, 100.0, 125.0, 150.0, 175.0, 200.0, 225.0, 250.0, 275.0, 300.0, 325.0, 350.0, 375.0, 400.0, 425.0, 450.0, 475.0, 500.0, 550.0, 600.0, 650.0, 700.0, 750.0, 800.0, 850.0, 900.0, 950.0, 1000.0, 1050.0, 1100.0, 1150.0, 1200.0, 1250.0, 1300.0, 1350.0, 1400.0, 1450.0, 1500.0, 1550.0, 1600.0, 1650.0, 1700.0, 1750.0, 1800.0, 1850.0, 1900.0, 1950.0, 2000.0, 2100.0, 2200.0, 2300.0, 2400.0, 2500.0, 2600.0, 2700.0, 2800.0, 2900.0, 3000.0, 3100.0, 3200.0, 3300.0, 3400.0, 3500.0, 3600.0, 3700.0, 3800.0, 3900.0, 4000.0, 4100.0, 4200.0, 4300.0, 4400.0, 4500.0, 4600.0, 4700.0, 4800.0, 4900.0, 5000.0, 5100.0, 5200.0, 5300.0, 5400.0, 5500.0 m. Units: umol/l. The horizontal resolution of the produced DIVAnd analysis is 0.25 degrees.
-
Water_body_silicate - Monthly Climatology for the European Seas for the period 1960-2023 on the domain from longitude -45.0 to 70.0 degrees East and latitude 24.0 to 83.0 degrees North. Data Sources: observational data from SeaDataNet/EMODnet Chemistry Data Network. Description of DIVA analysis: The computation was done with the DIVAnd (Data-Interpolating Variational Analysis in n dimensions), version 2.7.12, using GEBCO 30sec topography for the spatial connectivity of water masses. Horizontal correlation length and vertical correlation length vary spatially depending on the topography and domain. Depth range: 0.0, 5.0, 10.0, 15.0, 20.0, 25.0, 30.0, 35.0, 40.0, 45.0, 50.0, 55.0, 60.0, 65.0, 70.0, 75.0, 80.0, 85.0, 90.0, 95.0, 100.0, 125.0, 150.0, 175.0, 200.0, 225.0, 250.0, 275.0, 300.0, 325.0, 350.0, 375.0, 400.0, 425.0, 450.0, 475.0, 500.0, 550.0, 600.0, 650.0, 700.0, 750.0, 800.0, 850.0, 900.0, 950.0, 1000.0, 1050.0, 1100.0, 1150.0, 1200.0, 1250.0, 1300.0, 1350.0, 1400.0, 1450.0, 1500.0, 1550.0, 1600.0, 1650.0, 1700.0, 1750.0, 1800.0, 1850.0, 1900.0, 1950.0, 2000.0, 2100.0, 2200.0, 2300.0, 2400.0, 2500.0, 2600.0, 2700.0, 2800.0, 2900.0, 3000.0, 3100.0, 3200.0, 3300.0, 3400.0, 3500.0, 3600.0, 3700.0, 3800.0, 3900.0, 4000.0, 4100.0, 4200.0, 4300.0, 4400.0, 4500.0, 4600.0, 4700.0, 4800.0, 4900.0, 5000.0, 5100.0, 5200.0, 5300.0, 5400.0, 5500.0 m. Units: umol/l. The horizontal resolution of the produced DIVAnd analysis is 0.25 degrees.
-
Water body ammonium - Monthly Climatology for the European Seas for the period 1960-2020 on the domain from longitude -45.0 to 70.0 degrees East and latitude 24.0 to 83.0 degrees North. Data Sources: observational data from SeaDataNet/EMODnet Chemistry Data Network. Description of DIVA analysis: The computation was done with the DIVAnd (Data-Interpolating Variational Analysis in n dimensions), version 2.7.9, using GEBCO 30sec topography for the spatial connectivity of water masses. Horizontal correlation length and vertical correlation length vary spatially depending on the topography and domain. Depth range: 0.0, 5.0, 10.0, 15.0, 20.0, 25.0, 30.0, 35.0, 40.0, 45.0, 50.0, 55.0, 60.0, 65.0, 70.0, 75.0, 80.0, 85.0, 90.0, 95.0, 100.0, 125.0, 150.0, 175.0, 200.0, 225.0, 250.0, 275.0, 300.0, 325.0, 350.0, 375.0, 400.0, 425.0, 450.0, 475.0, 500.0, 550.0, 600.0, 650.0, 700.0, 750.0, 800.0, 850.0, 900.0, 950.0, 1000.0, 1050.0, 1100.0, 1150.0, 1200.0, 1250.0, 1300.0, 1350.0, 1400.0, 1450.0, 1500.0, 1550.0, 1600.0, 1650.0, 1700.0, 1750.0, 1800.0, 1850.0, 1900.0, 1950.0, 2000.0, 2100.0, 2200.0, 2300.0, 2400.0, 2500.0, 2600.0, 2700.0, 2800.0, 2900.0, 3000.0, 3100.0, 3200.0, 3300.0, 3400.0, 3500.0, 3600.0, 3700.0, 3800.0, 3900.0, 4000.0, 4100.0, 4200.0, 4300.0, 4400.0, 4500.0, 4600.0, 4700.0, 4800.0, 4900.0, 5000.0, 5100.0, 5200.0, 5300.0, 5400.0, 5500.0 m. Units: umol/l. The horizontal resolution of the produced DIVAnd analysis is 0.25 degrees.
-
Integrating Gut Microbiota and Population Genomics in White Hake (Urophycis tenuis): Supporting Data
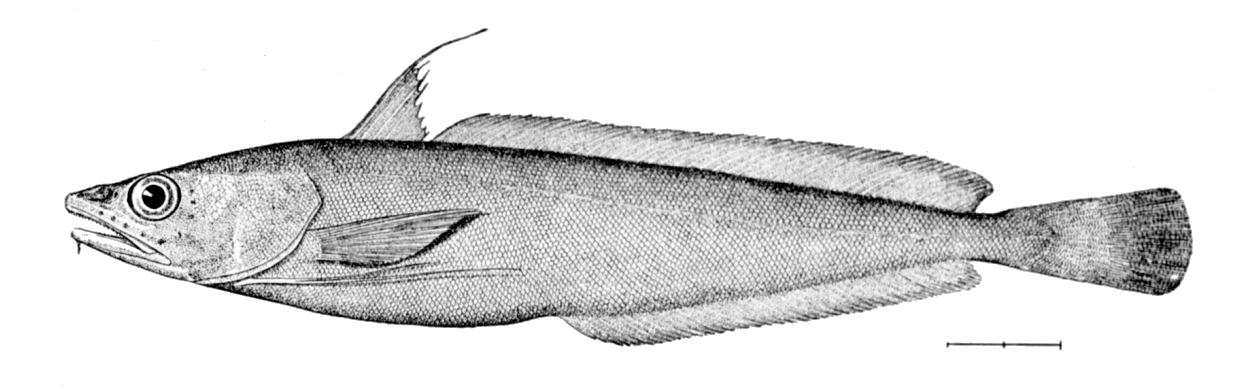
PURPOSE: The purpose of this work was to determine (1) how the population genomic structure relates to gut microbiota composition of White Hake (Urophycis tenuis), and (2) whether microbiota community variation provides complementary insights into population structure of this species in eastern Canada. DESCRIPTION: Integrating host-associated microbiota with genomic approaches offers an opportunity to better understand the multiple biological dimensions shaping population structure in marine fishes. A clear understanding of population structure and dynamics is essential for informed fisheries management and conservation decisions; however, while genomic approaches have greatly improved our ability to delineate biological populations, they provide only a partial representation of biological structure, as patterns of differentiation reflect both historical divergence and contemporary ecological conditions. Host-associated microbiota can influence population-level ecological processes by contributing functional, potentially heritable variation that shapes host phenotype and fitness. In this study, we combined genotyping-by-sequencing with 16S rRNA gene amplicon sequencing to examine how population genomic structure relates to gut microbiota composition and to evaluate whether microbiota community variation provides complementary insights into population structure in White Hake (Urophycis tenuis) in eastern Canada. Genomic analyses identified two populations with greater spatial overlap than previously reported. Variation partitioning revealed that host genetics explained a negligible proportion of microbiota variation compared to environmental factors and fish length, suggesting that ontogenetic shifts in habitat use and resource acquisition influence gut microbiota composition. Several taxa were differentially abundant among fish length categories used as a proxy for diet, including taxa with chitin-degrading potential such as Photobacterium and Lachnospirales, which were enriched in smaller fish known to consume a crustacean-dominated diet. Together, these results indicate that gut microbiota composition in White Hake primarily reflects ecological and life-history processes rather than host population structure. PARAMETERS COLLECTED: Environmental parameters were also collected at most sampling sites, including depth, water temperature, oxygen and salinity levels. PHYSICAL SAMPLE DETAILS: Fin samples were collected to characterize the fish genotypes. Intestine (rectum) samples were collected to study fish gut microbiome. SAMPLING METHODS: In 2022 and 2023, White Hake were sampled during Fisheries and Oceans Canada (DFO) annual bottom trawl ecosystem monitoring surveys. USE LIMITATION: To ensure scientific integrity and appropriate use of the data, we would encourage you to contact the data custodian.
-
Water_body_ammonium - Monthly Climatology for the European Seas for the period 1960-2023 on the domain from longitude -45.0 to 70.0 degrees East and latitude 24.0 to 83.0 degrees North. Data Sources: observational data from SeaDataNet/EMODnet Chemistry Data Network. Description of DIVA analysis: The computation was done with the DIVAnd (Data-Interpolating Variational Analysis in n dimensions), version 2.7.12, using GEBCO 30sec topography for the spatial connectivity of water masses. Horizontal correlation length and vertical correlation length vary spatially depending on the topography and domain. Depth range: 0.0, 5.0, 10.0, 15.0, 20.0, 25.0, 30.0, 35.0, 40.0, 45.0, 50.0, 55.0, 60.0, 65.0, 70.0, 75.0, 80.0, 85.0, 90.0, 95.0, 100.0, 125.0, 150.0, 175.0, 200.0, 225.0, 250.0, 275.0, 300.0, 325.0, 350.0, 375.0, 400.0, 425.0, 450.0, 475.0, 500.0, 550.0, 600.0, 650.0, 700.0, 750.0, 800.0, 850.0, 900.0, 950.0, 1000.0, 1050.0, 1100.0, 1150.0, 1200.0, 1250.0, 1300.0, 1350.0, 1400.0, 1450.0, 1500.0, 1550.0, 1600.0, 1650.0, 1700.0, 1750.0, 1800.0, 1850.0, 1900.0, 1950.0, 2000.0, 2100.0, 2200.0, 2300.0, 2400.0, 2500.0, 2600.0, 2700.0, 2800.0, 2900.0, 3000.0, 3100.0, 3200.0, 3300.0, 3400.0, 3500.0, 3600.0, 3700.0, 3800.0, 3900.0, 4000.0, 4100.0, 4200.0, 4300.0, 4400.0, 4500.0, 4600.0, 4700.0, 4800.0, 4900.0, 5000.0, 5100.0, 5200.0, 5300.0, 5400.0, 5500.0 m. Units: umol/l. The horizontal resolution of the produced DIVAnd analysis is 0.25 degrees.
-
Water_body_phosphate - Monthly Climatology for the European Seas for the period 1960-2023 on the domain from longitude -45.0 to 70.0 degrees East and latitude 24.0 to 83.0 degrees North. Data Sources: observational data from SeaDataNet/EMODnet Chemistry Data Network. Description of DIVA analysis: The computation was done with the DIVAnd (Data-Interpolating Variational Analysis in n dimensions), version 2.7.12, using GEBCO 30sec topography for the spatial connectivity of water masses. Horizontal correlation length and vertical correlation length vary spatially depending on the topography and domain. Depth range: 0.0, 5.0, 10.0, 15.0, 20.0, 25.0, 30.0, 35.0, 40.0, 45.0, 50.0, 55.0, 60.0, 65.0, 70.0, 75.0, 80.0, 85.0, 90.0, 95.0, 100.0, 125.0, 150.0, 175.0, 200.0, 225.0, 250.0, 275.0, 300.0, 325.0, 350.0, 375.0, 400.0, 425.0, 450.0, 475.0, 500.0, 550.0, 600.0, 650.0, 700.0, 750.0, 800.0, 850.0, 900.0, 950.0, 1000.0, 1050.0, 1100.0, 1150.0, 1200.0, 1250.0, 1300.0, 1350.0, 1400.0, 1450.0, 1500.0, 1550.0, 1600.0, 1650.0, 1700.0, 1750.0, 1800.0, 1850.0, 1900.0, 1950.0, 2000.0, 2100.0, 2200.0, 2300.0, 2400.0, 2500.0, 2600.0, 2700.0, 2800.0, 2900.0, 3000.0, 3100.0, 3200.0, 3300.0, 3400.0, 3500.0, 3600.0, 3700.0, 3800.0, 3900.0, 4000.0, 4100.0, 4200.0, 4300.0, 4400.0, 4500.0, 4600.0, 4700.0, 4800.0, 4900.0, 5000.0, 5100.0, 5200.0, 5300.0, 5400.0, 5500.0 m. Units: umol/l. The horizontal resolution of the produced DIVAnd analysis is 0.25 degrees.
-
Water body silicate - Monthly Climatology for the European Seas for the period 1960-2020 on the domain from longitude -45.0 to 70.0 degrees East and latitude 24.0 to 83.0 degrees North. Data Sources: observational data from SeaDataNet/EMODnet Chemistry Data Network. Description of DIVA analysis: The computation was done with the DIVAnd (Data-Interpolating Variational Analysis in n dimensions), version 2.7.9, using GEBCO 30sec topography for the spatial connectivity of water masses. Horizontal correlation length and vertical correlation length vary spatially depending on the topography and domain. Depth range: 0.0, 5.0, 10.0, 15.0, 20.0, 25.0, 30.0, 35.0, 40.0, 45.0, 50.0, 55.0, 60.0, 65.0, 70.0, 75.0, 80.0, 85.0, 90.0, 95.0, 100.0, 125.0, 150.0, 175.0, 200.0, 225.0, 250.0, 275.0, 300.0, 325.0, 350.0, 375.0, 400.0, 425.0, 450.0, 475.0, 500.0, 550.0, 600.0, 650.0, 700.0, 750.0, 800.0, 850.0, 900.0, 950.0, 1000.0, 1050.0, 1100.0, 1150.0, 1200.0, 1250.0, 1300.0, 1350.0, 1400.0, 1450.0, 1500.0, 1550.0, 1600.0, 1650.0, 1700.0, 1750.0, 1800.0, 1850.0, 1900.0, 1950.0, 2000.0, 2100.0, 2200.0, 2300.0, 2400.0, 2500.0, 2600.0, 2700.0, 2800.0, 2900.0, 3000.0, 3100.0, 3200.0, 3300.0, 3400.0, 3500.0, 3600.0, 3700.0, 3800.0, 3900.0, 4000.0, 4100.0, 4200.0, 4300.0, 4400.0, 4500.0, 4600.0, 4700.0, 4800.0, 4900.0, 5000.0, 5100.0, 5200.0, 5300.0, 5400.0, 5500.0 m. Units: umol/l. The horizontal resolution of the produced DIVAnd analysis is 0.25 degrees.