 Arctic SDI catalogue
United Kingdom
Type of resources
Available actions
Topics
Keywords
Contact for the resource
Provided by
Years
Formats
Scale
Resolution
-

This metadata refers to the CORINE Land Cover Plus Land Use, Land-Use Change and Forestry Instance (CLCplus LULUCF Instance), an annually updated, pan-European, spatially consistent and seamless geospatial proxy for land use reporting under the LULUCF regulation. The product is delivered as a single raster layer with a spatial resolution of 100 m, derived from multiple pan-European Copernicus Land Monitoring Service (CLMS) high resolution input datasets. The LULUCF Instance is available for the reference years 2018, 2021, 2022 and 2023, with production moving to an annual update cycle starting from the 2021 product. Each raster cell represents a dominant LULUCF land-use class, assigned according to thematic and spatial rulesets implemented during the extraction process. While each pixel corresponds primarily to one of the six main LULUCF land use categories - forest land, grassland, cropland, settlements, wetlands, and other lands - the dataset further differentiates these categories into sub classes, resulting in a total of 27 classes. This classification structure supports greenhouse gas reporting and other applications within the LULUCF sector by providing a harmonised and policy relevant representation of land use across Europe. It is crucial to understand that this product is fundamentally different from other CLMS products, as it is not based directly on satellite image classification or visual interpretation. Instead, it is produced through the combination and integration of existing CLMS data layers. Consequently, the dataset does not introduce fundamentally new information; rather, its novelty lies in the expert driven integration of multiple sources to produce a LULUCF oriented land use representation.
-

The Copernicus High Resolution Forest Layer Tree Cover Change Mask (TCCM) 2015-2018 raster product provides information on the change between the reference years 2015 and 2018 and consists of 4 thematic classes (unchanged areas with no tree cover / new tree cover / loss of tree cover / unchanged areas with tree cover) at 20m spatial resolution and covers EEA38 area and the United Kingdom. The production of the High Resolution Forest layers was coordinated by the European Environment Agency (EEA) in the frame of the EU Copernicus programme. The High Resolution Forest product consists of three types of (status) products and additional change products. The status products are available for the 2012, 2015 and 2018 reference years: 1. Tree cover density providing level of tree cover density in a range from 0-100%; 2. Dominant leaf type providing information on the dominant leaf type: broadleaved or coniferous; 3. A Forest type product. The forest type product allows to get as close as possible to the FAO forest definition. In its original (20m) resolution it consists of two products: 1) a dominant leaf type product that has a MMU of 0.5 ha, as well as a 10% tree cover density threshold applied, and 2) a support layer that maps, based on the dominant leaf type product, trees under agricultural use and in urban context (derived from CLC and high resolution imperviousness 2009 data). For the final 100m product trees under agricultural use and urban context from the support layer are removed.
-
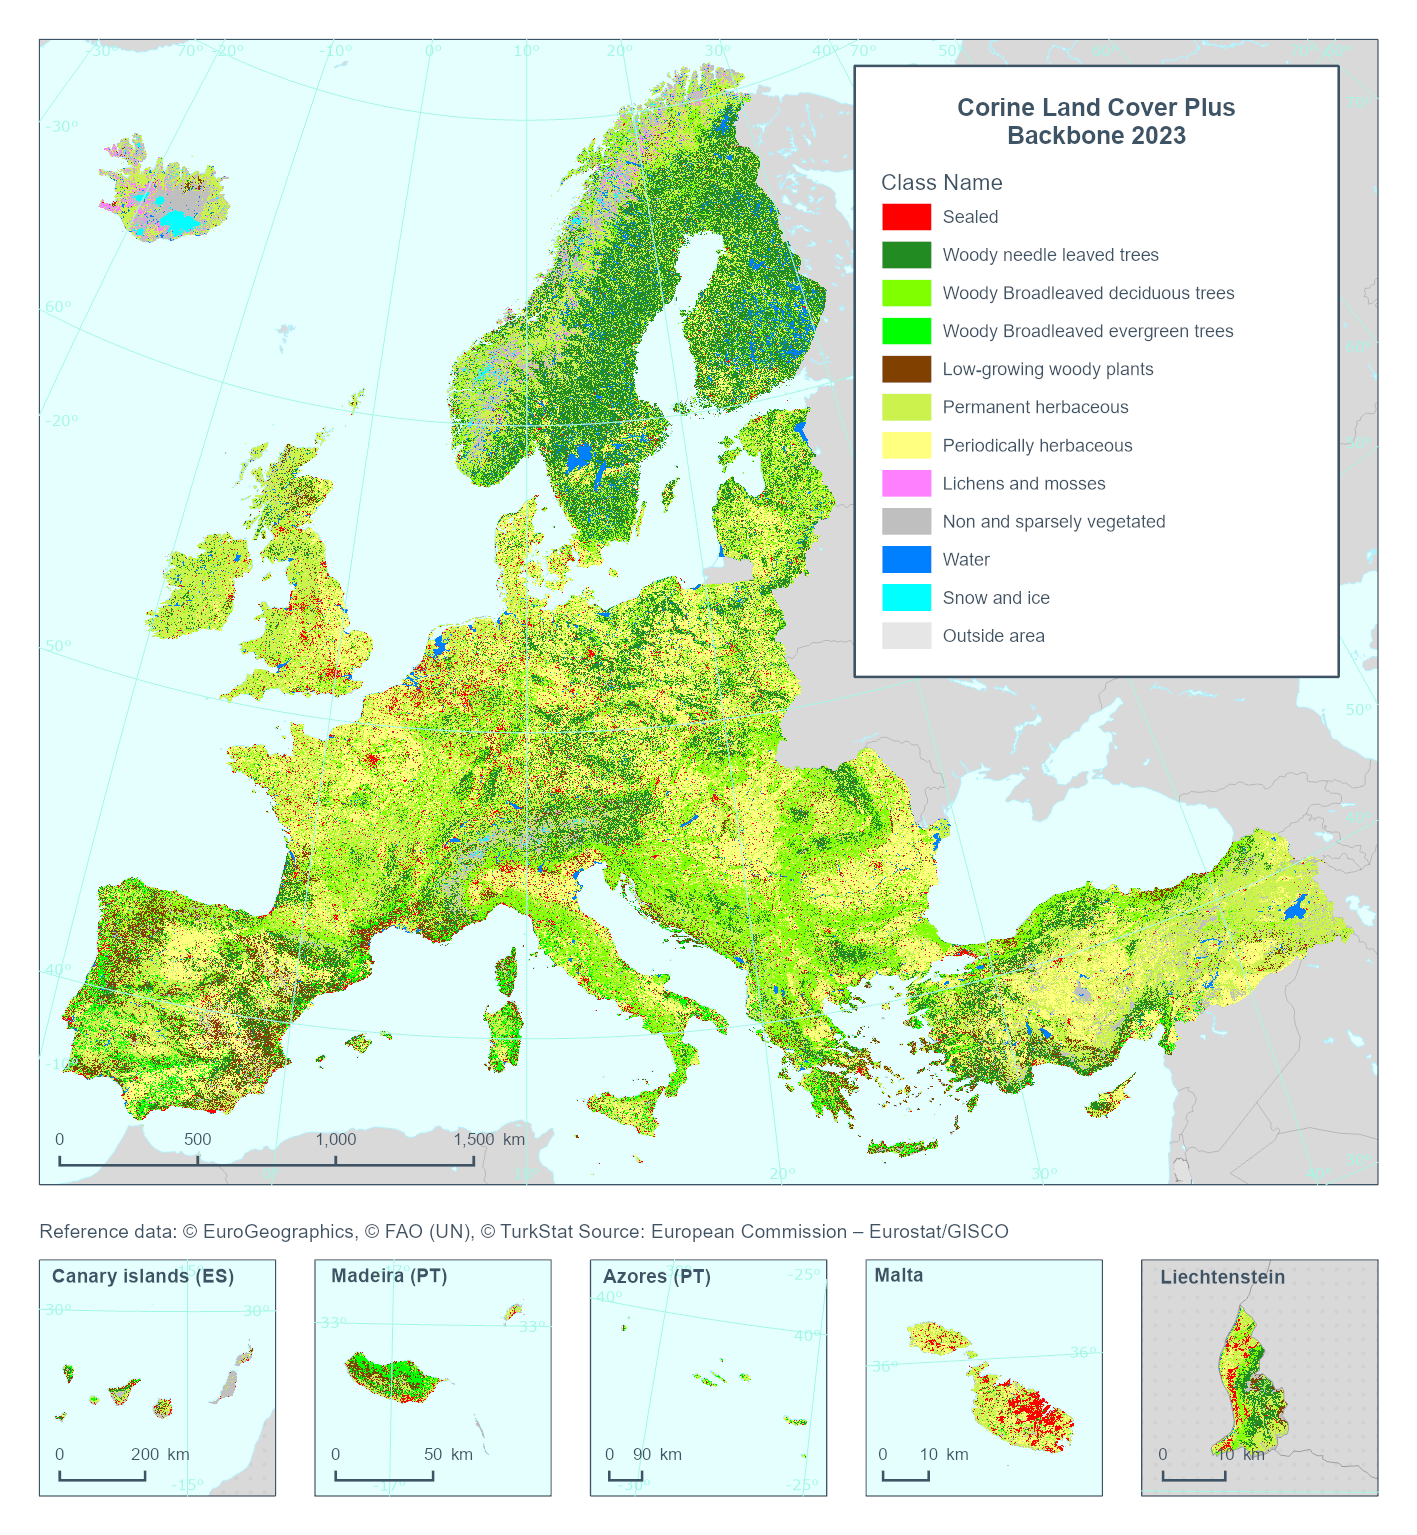
This metadata refers to the Corine Land Cover plus Backbone (CLCplus Backbone), a spatially detailed, large-scale, Earth Observation-based land cover inventory which is produced by the Copernicus Land Monitoring Service (CLMS). The CLCplus Backbone is a high-resolution raster land cover map based on Sentinel-2 satellite time series. Each 10m-pixel contains the dominant land cover among the 11 basic land cover classes. See pixel class codes in the 'Additional Information' section below. The product is available from the 2018 reference year, with a first update produced for the 2021 reference year and moved to an update cycle of 2 years from 2021 onwards.
-
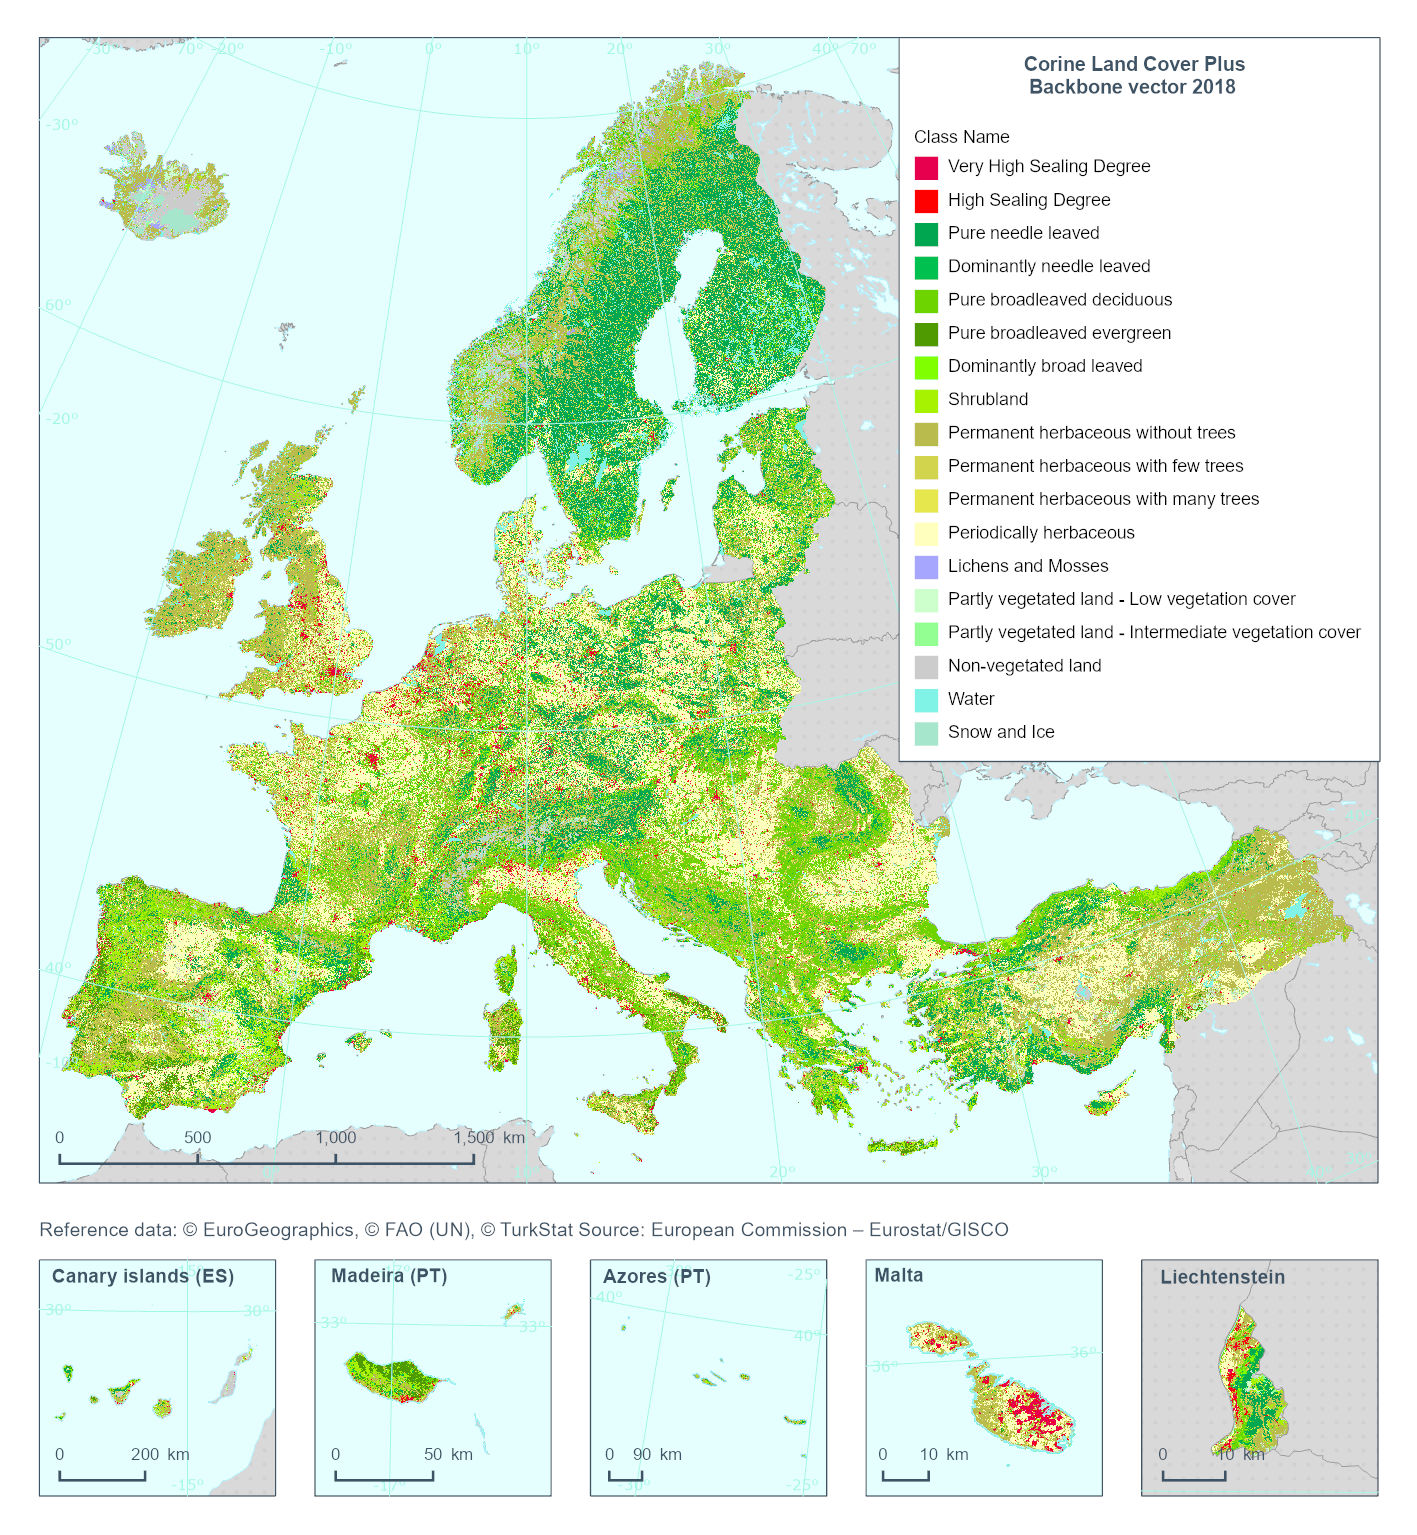
This metadata refers to the 'Corine Land Cover Plus Backbone' (CLCplus Backbone), a spatially detailed, large-scale, Earth Observation-based land cover inventory which is produced by the Copernicus Land Monitoring Service (CLMS). The CLCplus Backbone vector is a land cover map that contains vector polygon geometries (minimum mapping unit: 0.5 ha; minimum mapping width: 20 m) and is based on Sentinel satellite time series and a combination of existing reference datasets for geometries containing transportation and hydrological networks. Each polygon represents aggregated landscape objects and contains their dominant land cover among the 18 basic land cover classes. See polygon class codes in the additional information section. In addition, polygons are enriched with land cover fractions from the CLCplus Backbone raster as well as aggregated attributes based on other CLMS and Copernicus products (e.g. topography). CLCplus Backbone vector is an independent product and its thematic and geometric contents differ from CLCplus Backbone raster and Corine Land Cover. The CLCplus Backbone vector is available for the 2018 reference year.
-
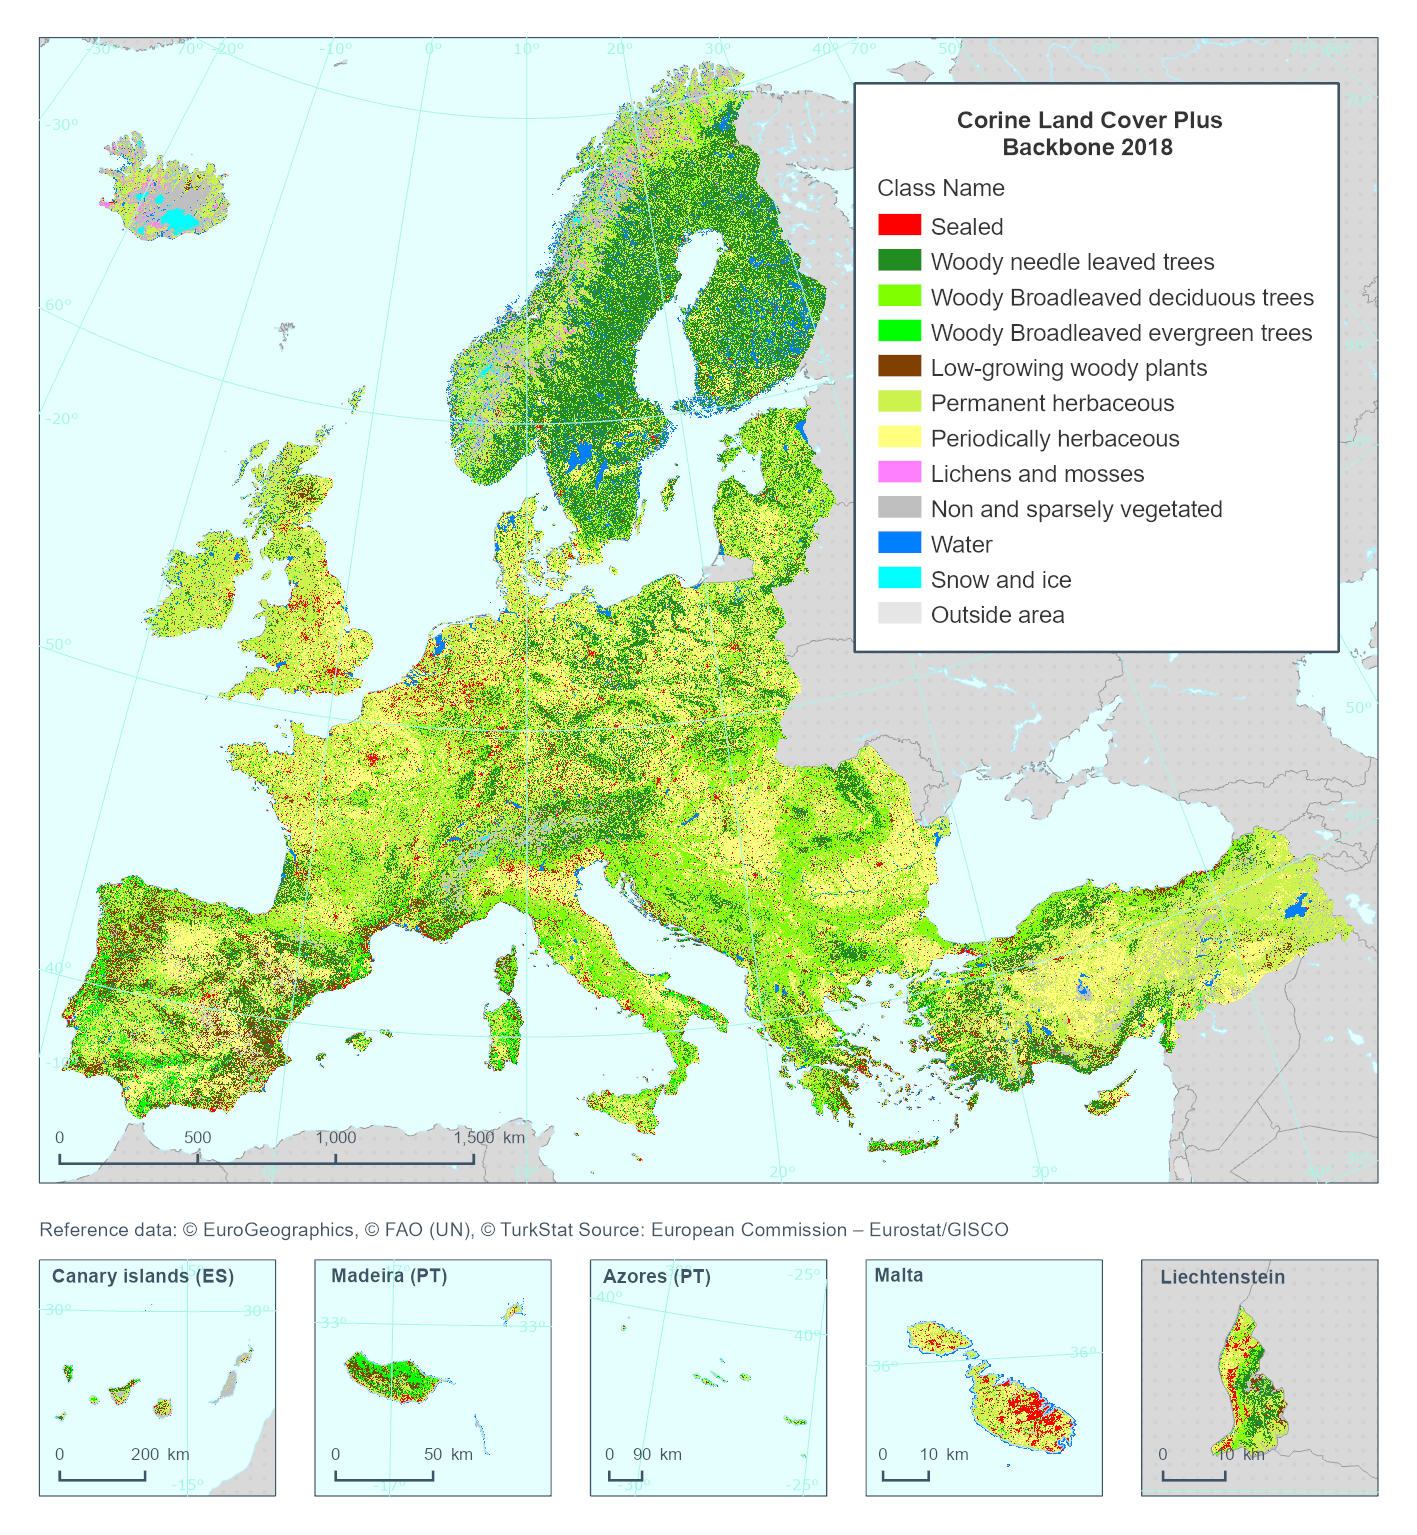
This metadata refer to the 'Corine Land Cover plus Backbone' (CLCplus Backbone) which is a spatially detailed, large scale, Earth Observation-based land cover inventory. The CLCplus Backbone Raster Product is a 10m pixel-based land cover map based on Sentinel satellite time series from July 2017 to June 2019. For each pixel it shows the dominant land cover among the 11 basic land cover classes. The product has a three years update cycle and is available for the 2018 reference year.
-
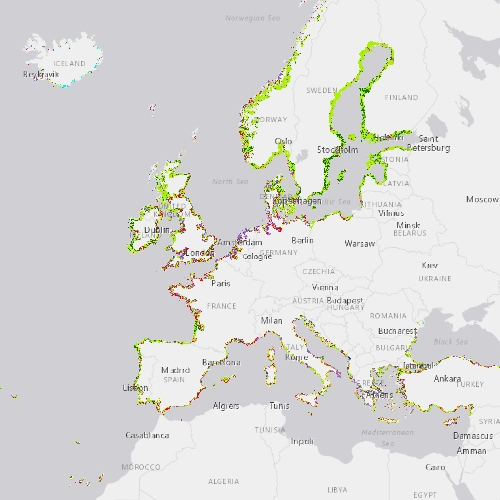
The Coastal Zones LC/LU Change (CZC) 2012-2018 is providing the Land Cover / Land Use (LC/ LU) change for areas along the coastline of the EEA38 countries and the United Kingdom, between the reference years 2012 and 2018. The Coastal Zones product monitors landscape dynamics in European coastal territory to an inland depth of 10 km with a total area of approximately 730,000 km², with all the relevant areas (estuaries, coastal lowlands, nature reserves). The production of the coastal zone layers was coordinated by the European Environment Agency (EEA) in the frame of the EU Copernicus programme, as part of the Copernicus Land Monitoring Service (CLMS) Local Component. The Coastal Zones Change product covers a buffer zone of coastline derived from EU-Hydro v1.1. The Land Cover/Land Use (LC/LU) Change layer is extracted from Very High Resolution (VHR) satellite data and other available data. The reference years for the change are 2012 and 2018. The class definitions follow the pre-defined nomenclature on the basis of Mapping and Assessment of Ecosystems and their Services (MAES) typology of ecosystems (Level 1 to Level 4) and CORINE Land Cover adapted to the specific characteristics of coastal zones. The classification provides 71 distinct thematic classes with a Minimum Mapping Unit (MMU) of 0.5 ha and a Minimum Mapping Width (MMW) of 10 m. The status product is available for the 2012 and 2018 reference years. This CZC dataset is distributed in vector format, in a single OGC GeoPackage file covering the area of interest.
-

Urban Atlas Building Block Height 2021 is a 10 m high resolution raster layer containing height information generated for selected cities and urban areas as part of the Urban atlas suite of products. Height information is based on satellite information and derived datasets like the digital surface model, the digital terrain model and the normalized digital surface model (DSM).
-

Small Woody Features are important vectors of biodiversity and provide information on fragmentation of habitats with a direct potential for restoration while also providing a link to hazard protection and green infrastructure, amongst others. VHR_IMAGE_2021 made available in the ESA Copernicus DWH was the main data source for the detection of small woody features identifiable within the given image resolution. The Small Woody Features layer contains woody linear and patchy elements but will not be further differentiated into trees, hedges, bushes and scrub. The spatial pattern shall be limited to linear structures and isolated patches on the basis of geometric characteristics. This product is a vector dataset distributed as OGC GeoPackage files, compliant with the EEA reference grid (100km x 100km).
-

Small Woody Features are important vectors of biodiversity and provide information on fragmentation of habitats with a direct potential for restoration while also providing a link to hazard protection and green infrastructure, amongst others. Optical VHR coverage over Europe 2021 was made available in the ESA Copernicus DWH and, together with Sentinel 2 was the main data source for the detection of small woody features identifiable within the given image resolution. The Small Woody Features Density 2021 with a 100m pixel resolution is derived from a pixel aggregation of the binary Small Woody Features 2021 (10m) status layer. The production of the HRL Small Landscape Features is coordinated by EEA in the frame of Copernicus, the Earth observation component of the European Union’s Space programme. The product is a raster dataset with 100-meter grid spacing (spatial resolution), distributed as a single raster file with European extent.
-

The Sentinel-1 and Sentinel-2 Snow Phenology (SP S1+S2) product is generated once a year over high-mountain areas at European scale, based on daily cumulative Gap-Filled Fractional Snow Cover (GFSC) products calculated from Sentinel-2 optical and Sentinel-1 radar data. This product describes the snow season in terms of temporality as it provides, for each pixel, the number of days with snow cover, as well as the first and the last day of the longest observed snow period. It has a spatial resolution of 100 m x 100 m. Each product is composed of separate files corresponding to the different layers of the product, and another metadata file. The product is also available in another projection as tiles aligned with Sentinel-2 (UTM/WGS84) at 60 m x 60 m. SP S1+S2 is one of the products of the pan-European High-Resolution Water Snow & Ice portfolio (HR-WSI), which are provided at high spatial resolution from the Sentinel-2 and Sentinel-1 constellations data from September 1, 2016 onwards. t.