 Arctic SDI catalogue
10 m
Type of resources
Available actions
Topics
Keywords
Contact for the resource
Provided by
Years
Formats
Scale
Resolution
-

This is the metadata covering the Water Layer (WL) product. The WL is one of the products of the pan-European High-Resolution Water Snow & Ice portfolio (HR-WSI), which are provided at high spatial resolution from the Sentinel-2 and Sentinel-1 constellations data from September 1, 2016 onwards.. The WL is generated for the 2021 reference year. It is a a multi-annual product based on the information covering the period 2016-2021. In the context of the HR-WSI, the water and dry frequency masks are derived from intermediate outputs of the WCD workflow, the monthly surface water masks in combination with the WIC S2 NRT product. It provides detailed information about the presence and condition of water surfaces across Europe. It is also generated in different spatial resolutions (10m and 100m) and projections (LAEA & WGS84/UTM). The High Resolution Water Layer portfolio consists of the WL, the Water Presence Index (WPI), the Water confidence layer (WCL) and the Rolling archive (WLRA). There are 5 major classes like: - Dry (always or mostly dry with minor instances of wet) - permanent water (always contains water) - temporary water ( temporary water surfaces, aliteration of dry and water) - sea water (oceans and sea) - clouds
-
Riparian zones represent transitional areas occurring between land and freshwater ecosystems, characterised by distinctive hydrology, soil and biotic conditions and strongly influenced by the stream water. They provide a wide range of riparian functions (e.g. chemical filtration, flood control, bank stabilization, aquatic life and riparian wildlife support, etc.) and ecosystem services. The Riparian Zones products support the objectives of several European legal acts and policy initiatives, such as the EU Biodiversity Strategy to 2020, the Habitats and Birds Directives and the Water Framework Directive. This metadata refers to the Riparian Zones Land Cover/Land Use (LC/LU) change for 2012-2018. The LC/LU classification is tailored to the needs of biodiversity monitoring in a variable buffer zone of selected rivers (Strahler levels 2-9 derived from EU-Hydro) for the change layer 2012-2018. LC/LU is extracted from Very High Resolution (VHR) satellite data and other available data in a buffer zone of selected rivers for supporting biodiversity monitoring and mapping and assessment of ecosystems and their services. The class definitions follow the pre-defined nomenclature on the basis of Mapping and Assessment of Ecosystems and their Services (MAES) typology of ecosystems (Level 1 to Level 4) and CORINE Land Cover. The classification provides 55 distinct thematic classes with a Minimum Mapping Unit (MMU) of 0.5 ha and a Minimum Mapping Width (MMW) of 10 m. The production of the Riparian Zones products was coordinated by the European Environment Agency in the frame of the EU Copernicus programme.
-
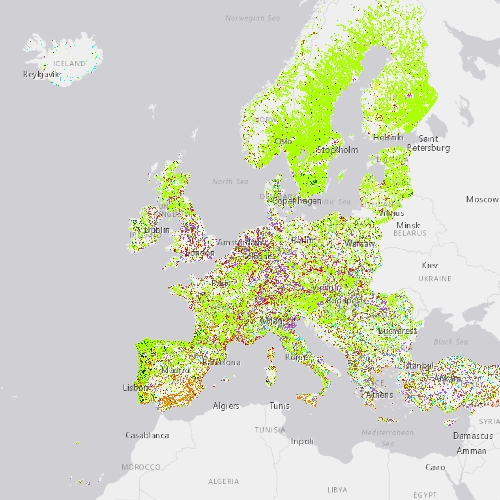
The High Resolution Layer Grassland Mowing Events (GRAME) raster product provides a basic land cover classification containing respectively the number of grassland mowing events within the detected Herbaceous cover layer (temporal and permanent grassland)) with a Minimum Mapping Unit (MMU) of 0.25 ha. The GRAME product will flag and map the number of mowing events (1, 2, 3, or 4+) on temporary or permanent grassland detected per year. This dataset is provided annually starting in 2017 with 10 meter rasters (fully conformant with the EEA reference grid) in 100 x 100 km tiles covering the EEA38 countries. High Resolution Layer Grasslands product is part of the European Union’s Copernicus Land Monitoring Service. Confidence layer available for the dataset. This dataset includes data from the French Overseas Territories (DOMs)
-
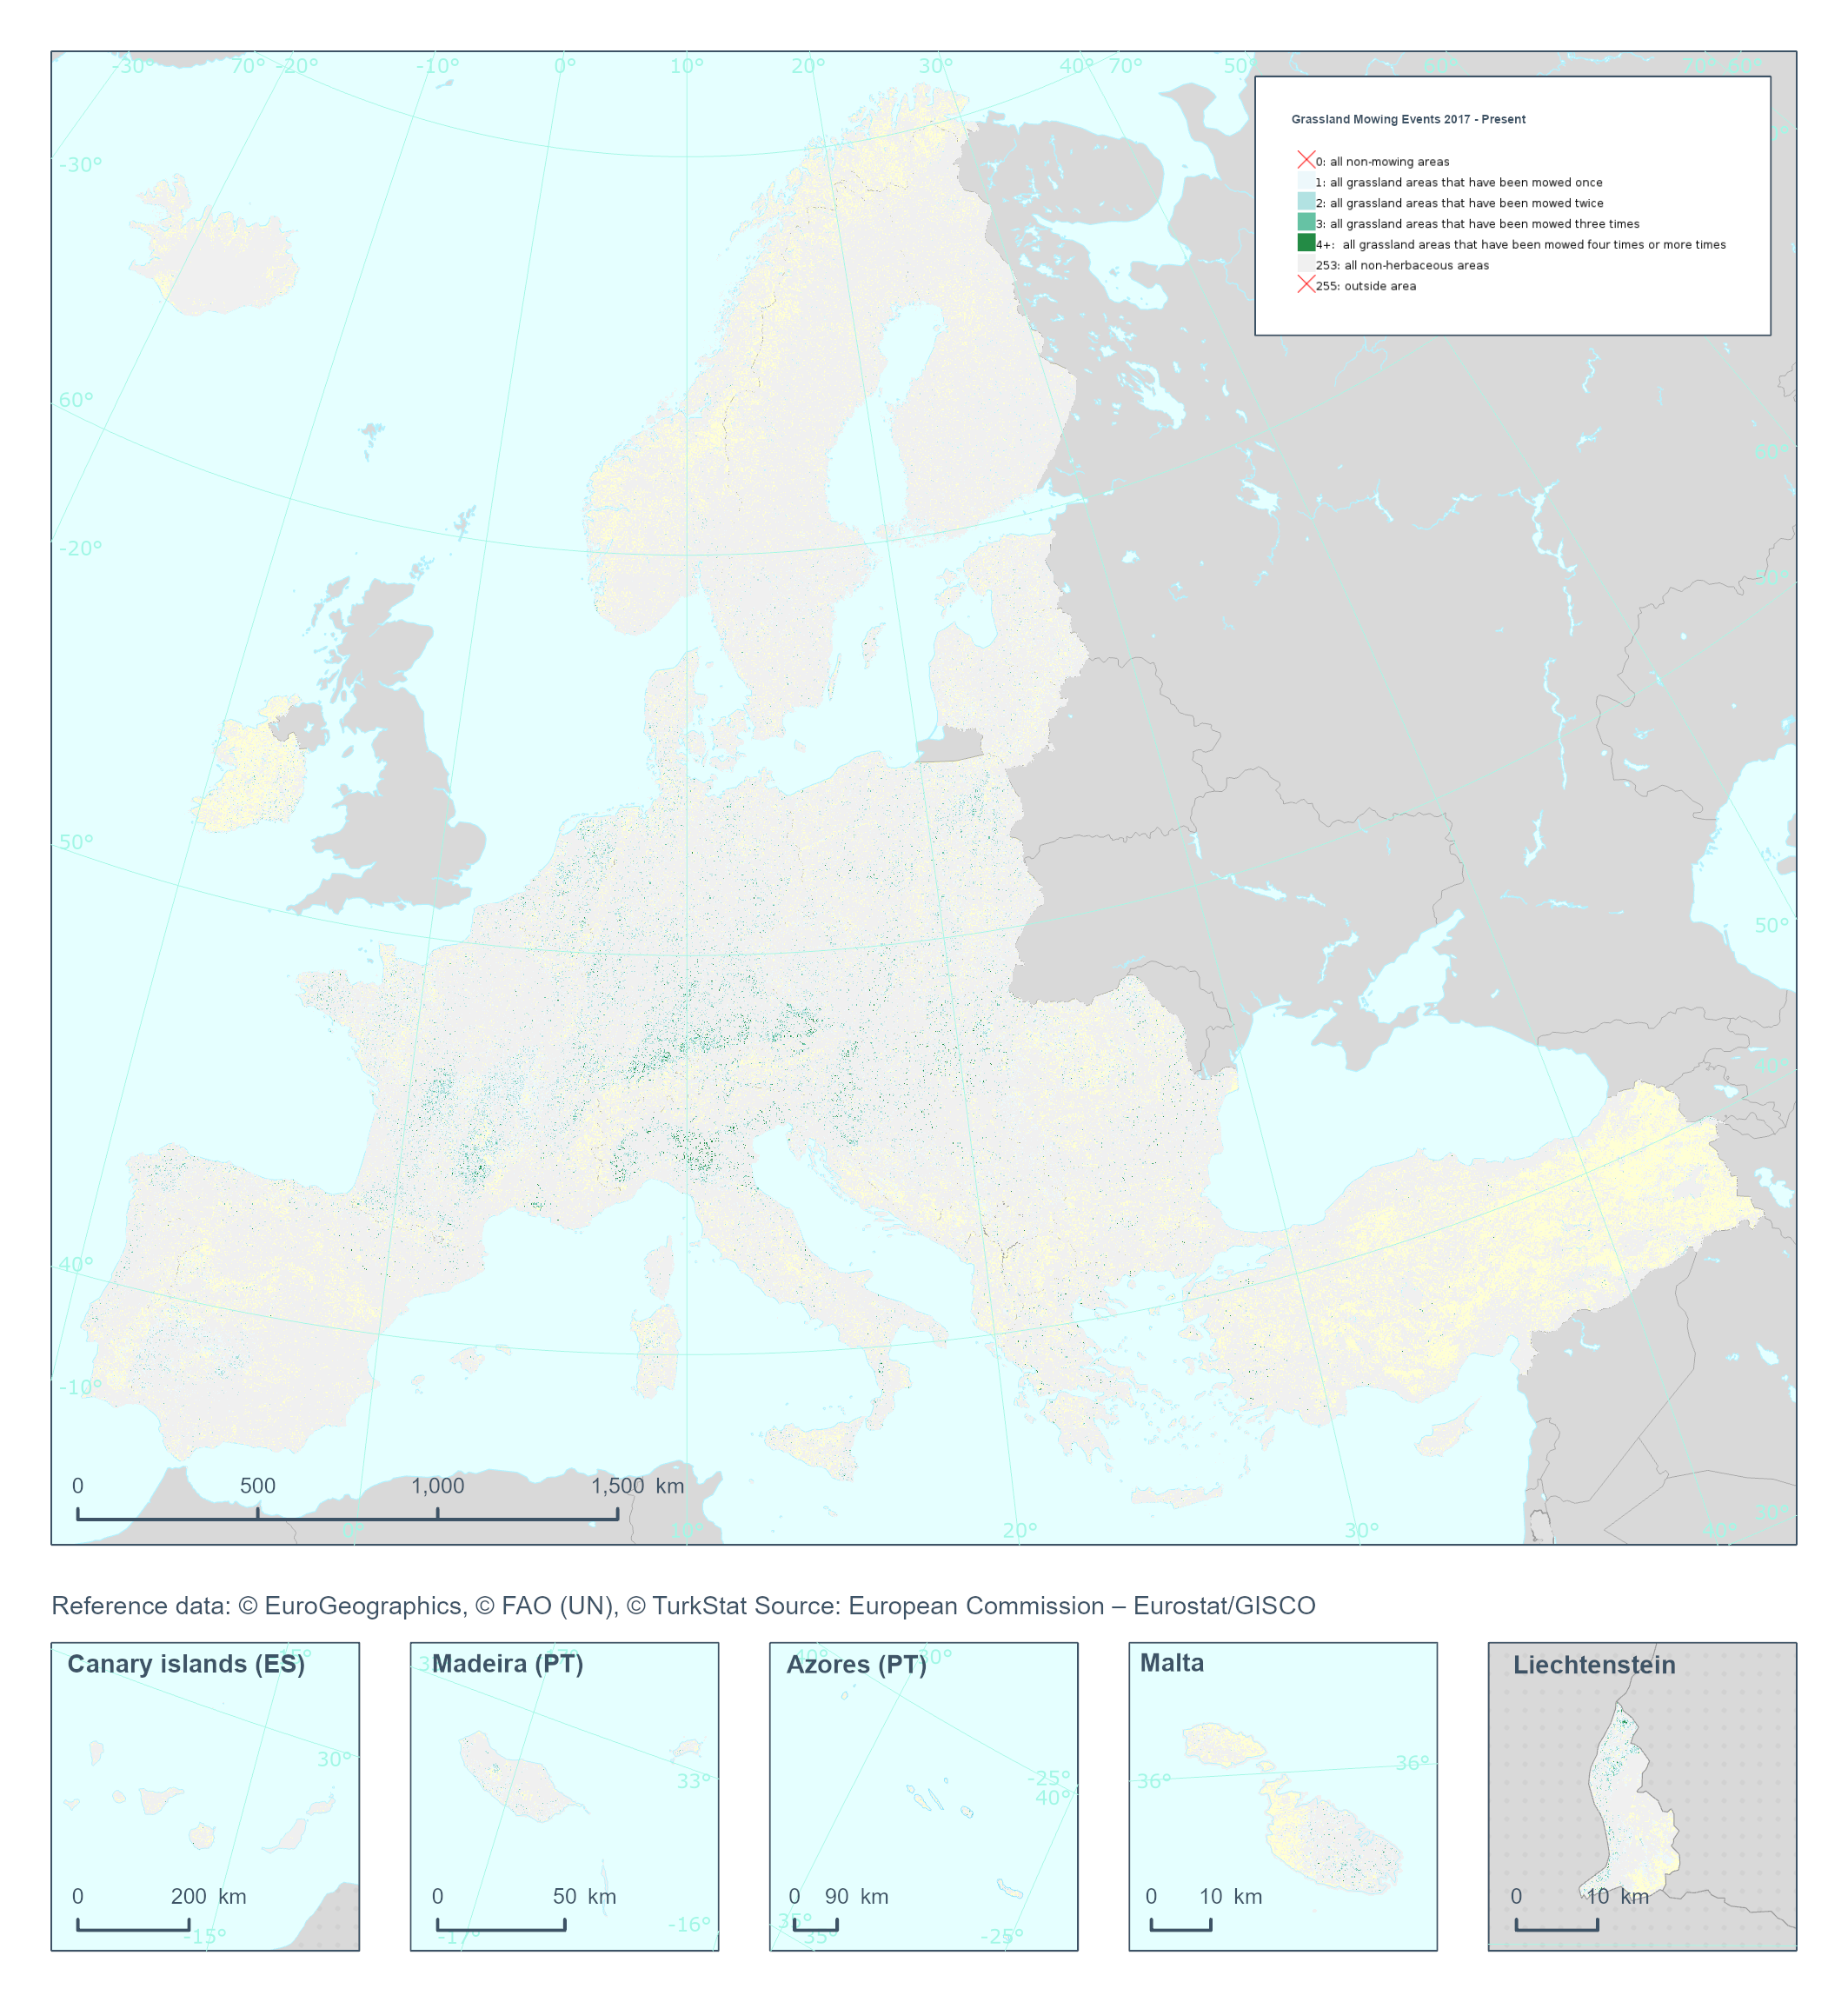
The High Resolution Layer Ploughing indicator (PLOUGH) raster product continues the 2015 and 2018 PLOUGH Layer following a rolling archive principle by adding current information and removing historic years. It indicates the number of years since the last indication of ploughing within the permanent grassland area. PLOUGH is derived by taking into account the series of binary HER layers, the BVL classifications and HR VPP PPI (Plant Phenology Index) quantiles. BVL classes 4 (crop) and 7 (overlaying layer between herbaceous and crop) indicate a ploughing event. Low HR VPP PPI quantiles indicate low vegetation at a certain time of the year. For years with missing information (2016 and earlier) the ploughing information from the historic PLOUGH product is considered which causes some issues. This dataset is provided annually starting in 2017 with 10 meter rasters (fully conformant with the EEA reference grid) in 100 x 100 km tiles covering the EEA38 countries. High Resolution Layer Grasslands product is part of the European Union’s Copernicus Land Monitoring Service. This dataset includes data from the French Overseas Territories (DOMs)
-
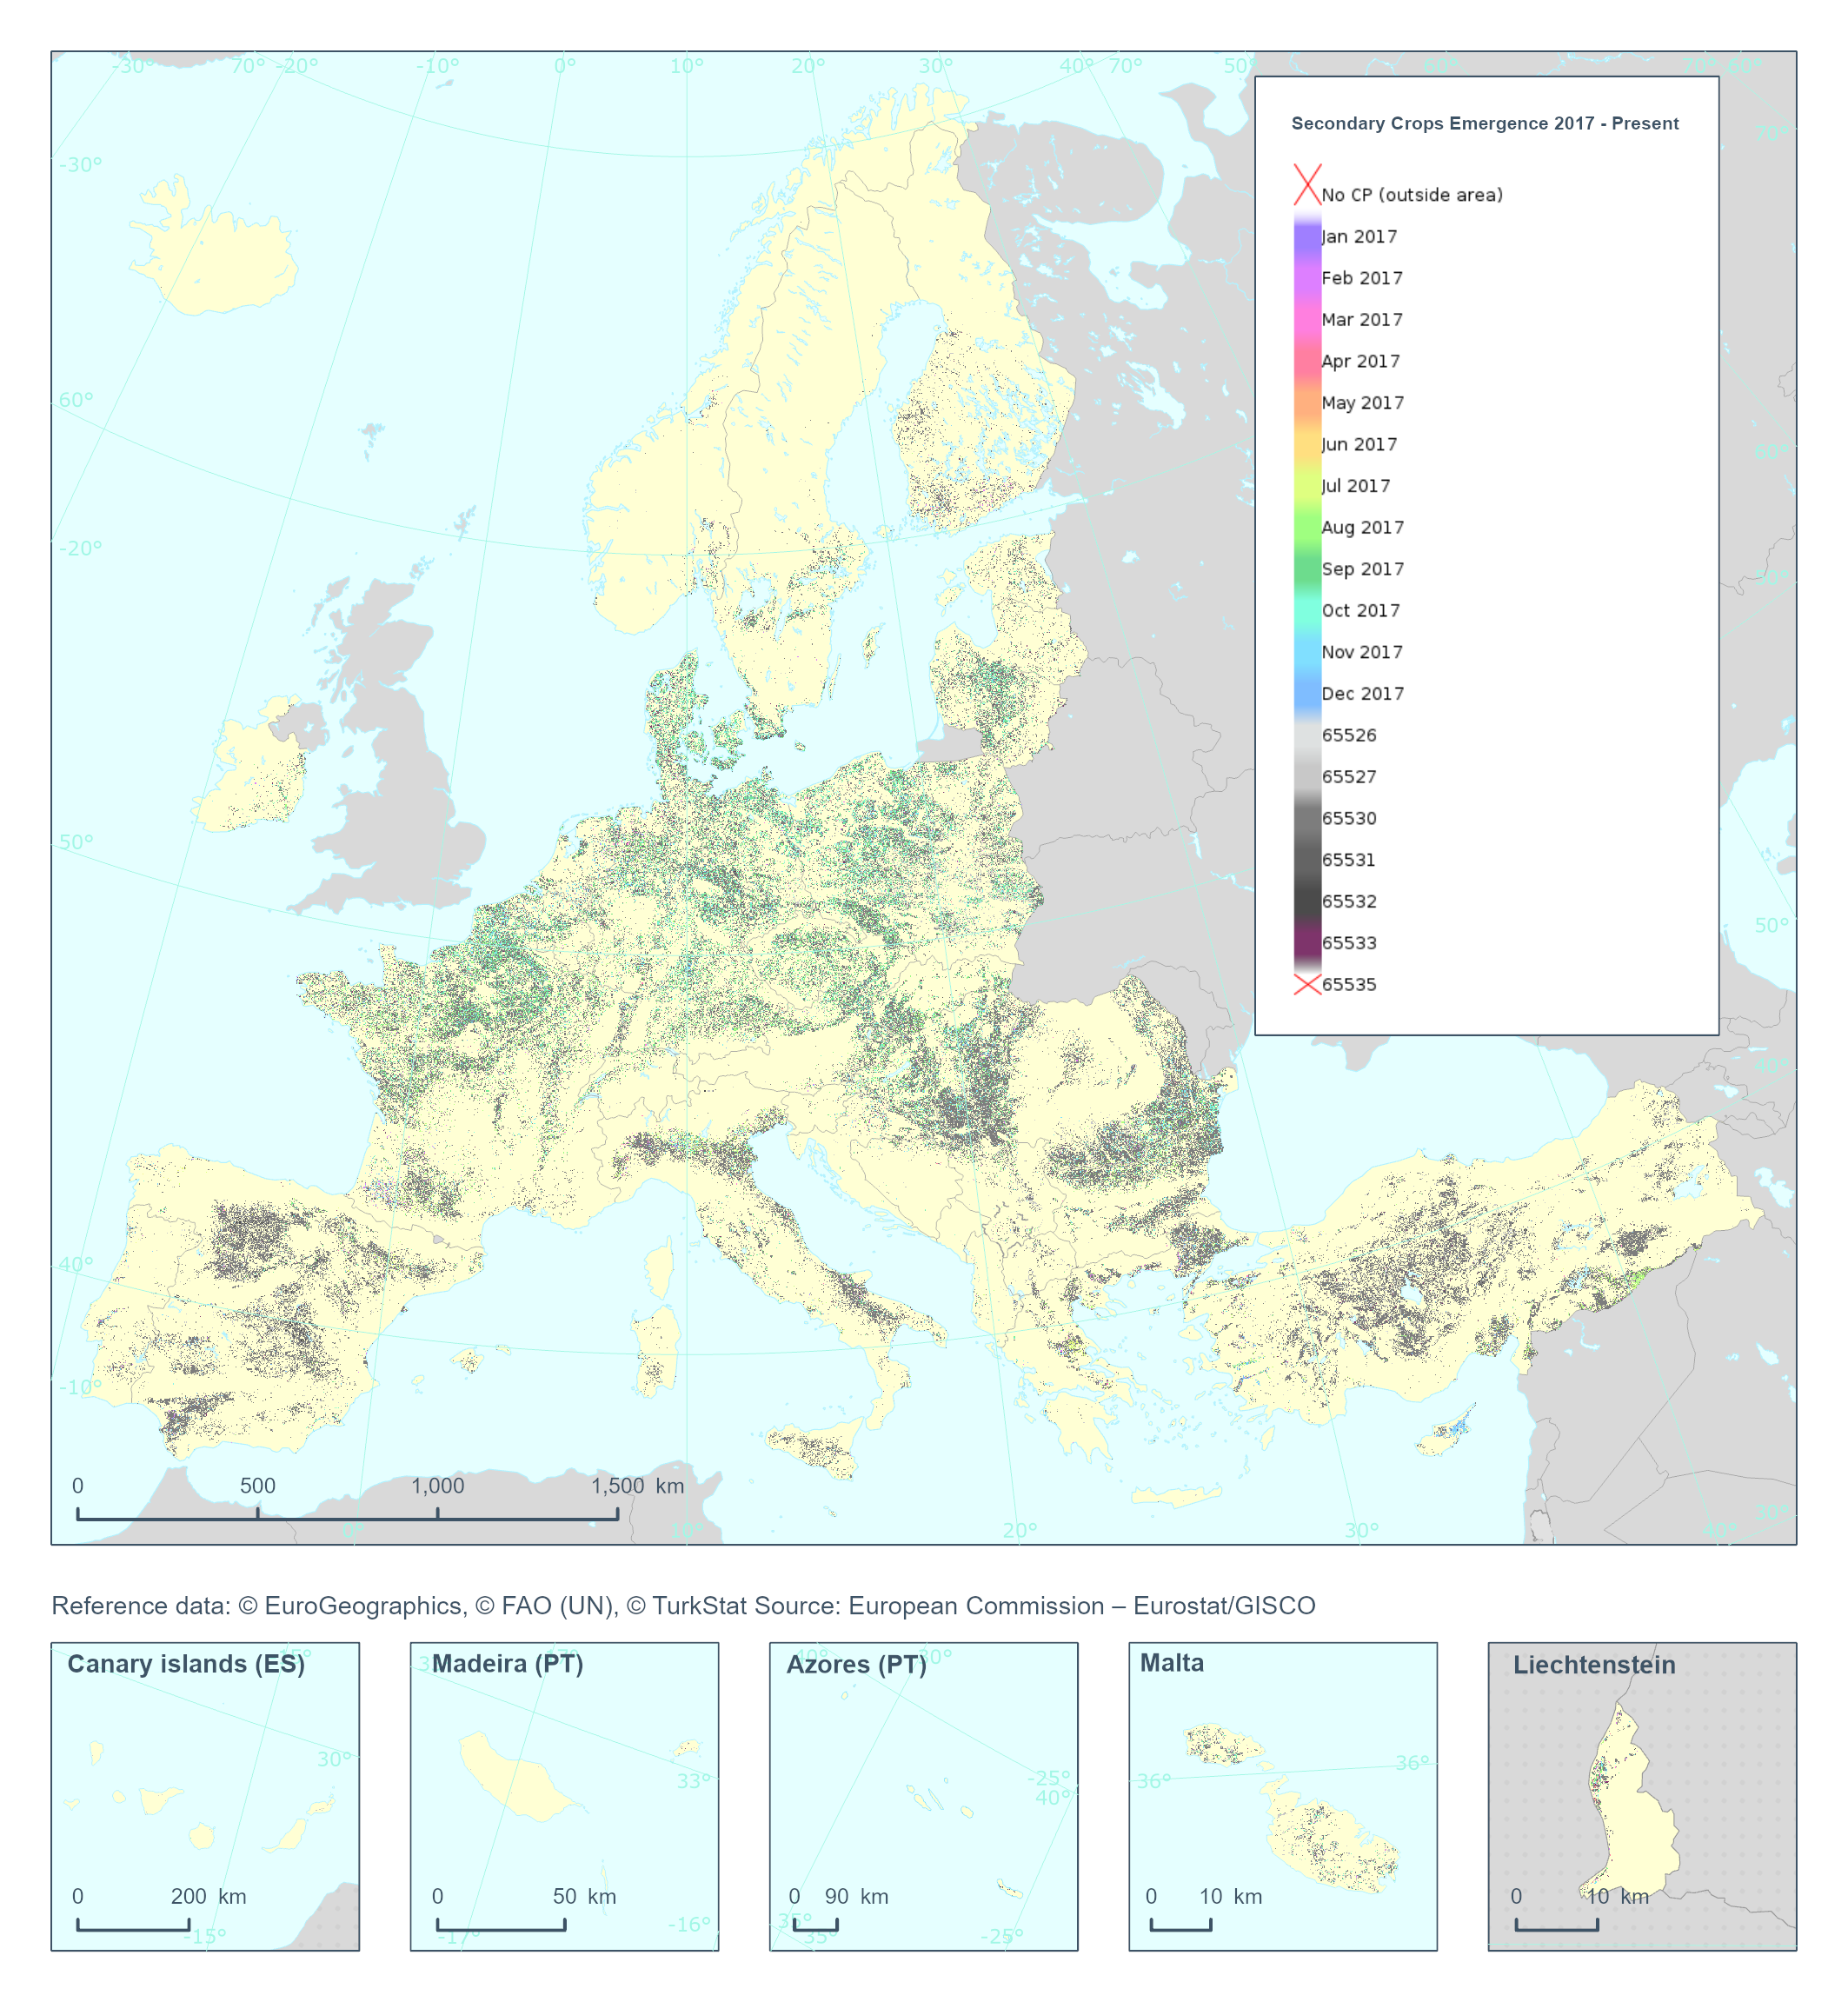
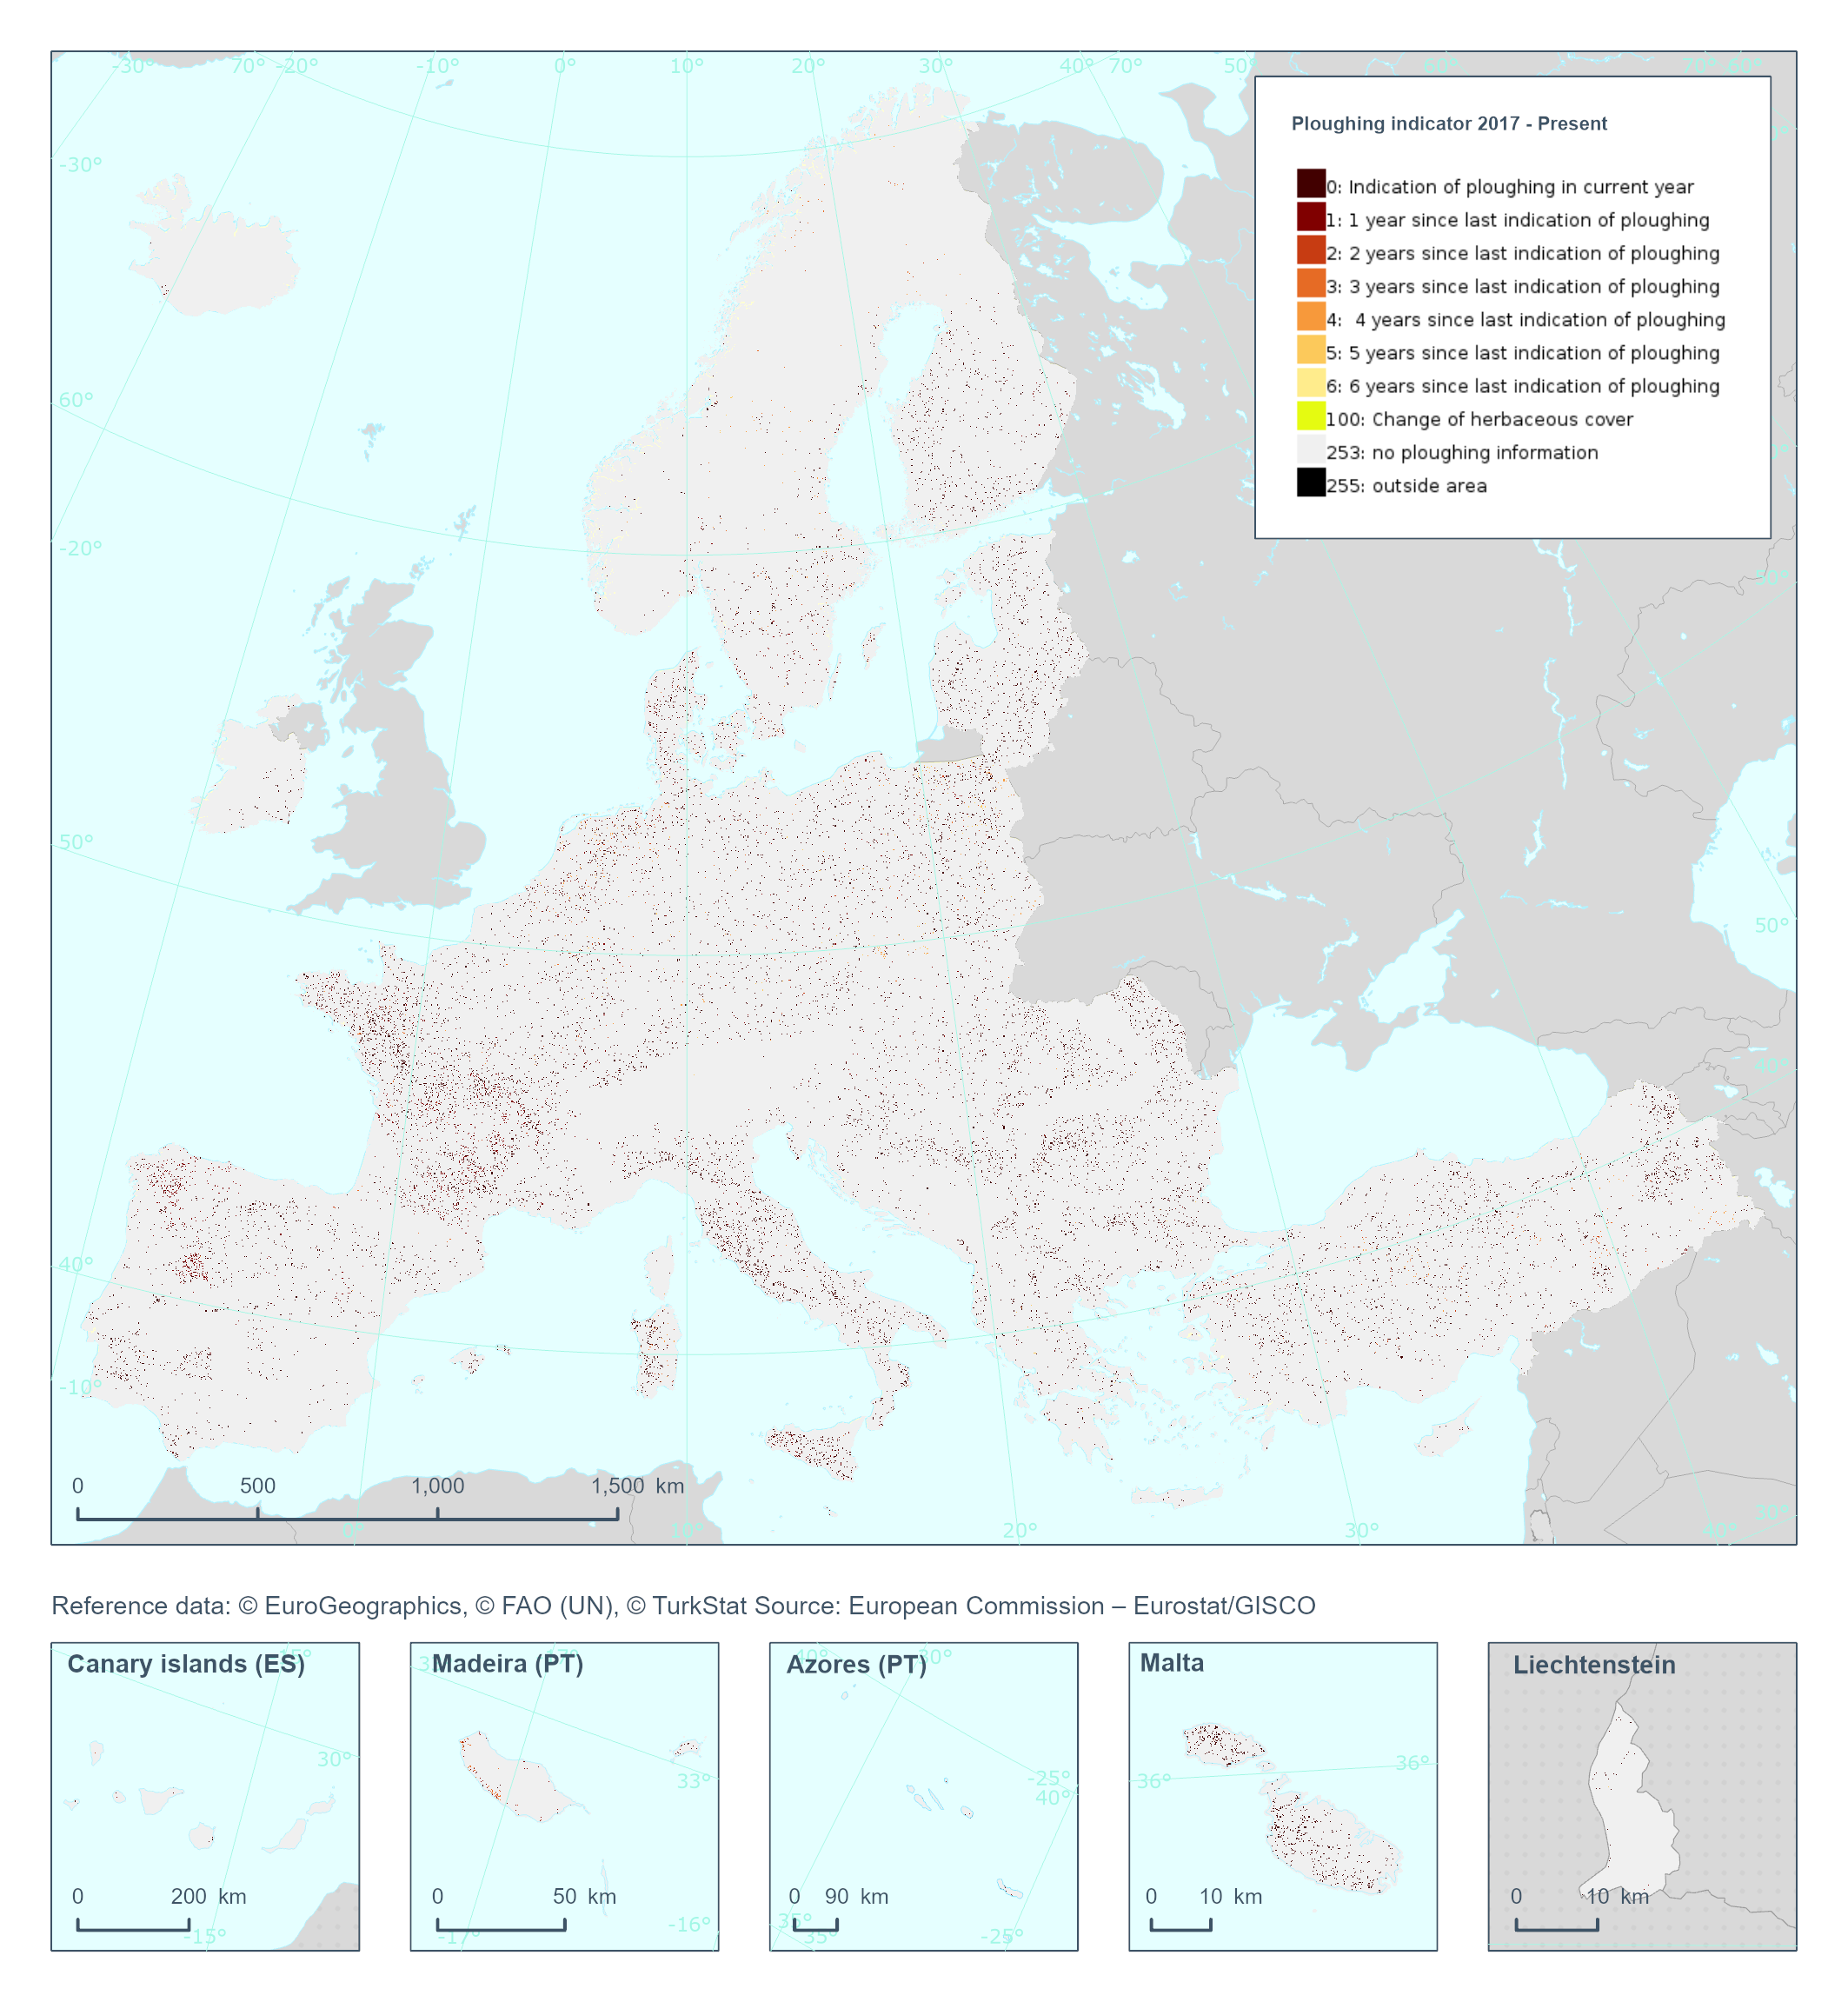
The High Resolution Layer Cropping Patterns - Secondary Crop Emergence (CPSCE) raster product provides the date of emergence of the cover crop in days of the year (DOY). YYDOY where YY = last 2 digits of the year (e.g. 19 for 2019) and DOY is the day of the year (1-365) This dataset is provided annually starting in 2017 with 10 meter rasters (fully conformant with the EEA reference grid) in 100 x 100 km tiles covering the EEA38 countries. High Resolution Layer Croplands product is part of the European Union’s Copernicus Land Monitoring Service. Confidence layer available for the dataset. This dataset includes data from the French Overseas Territories (DOMs)
-
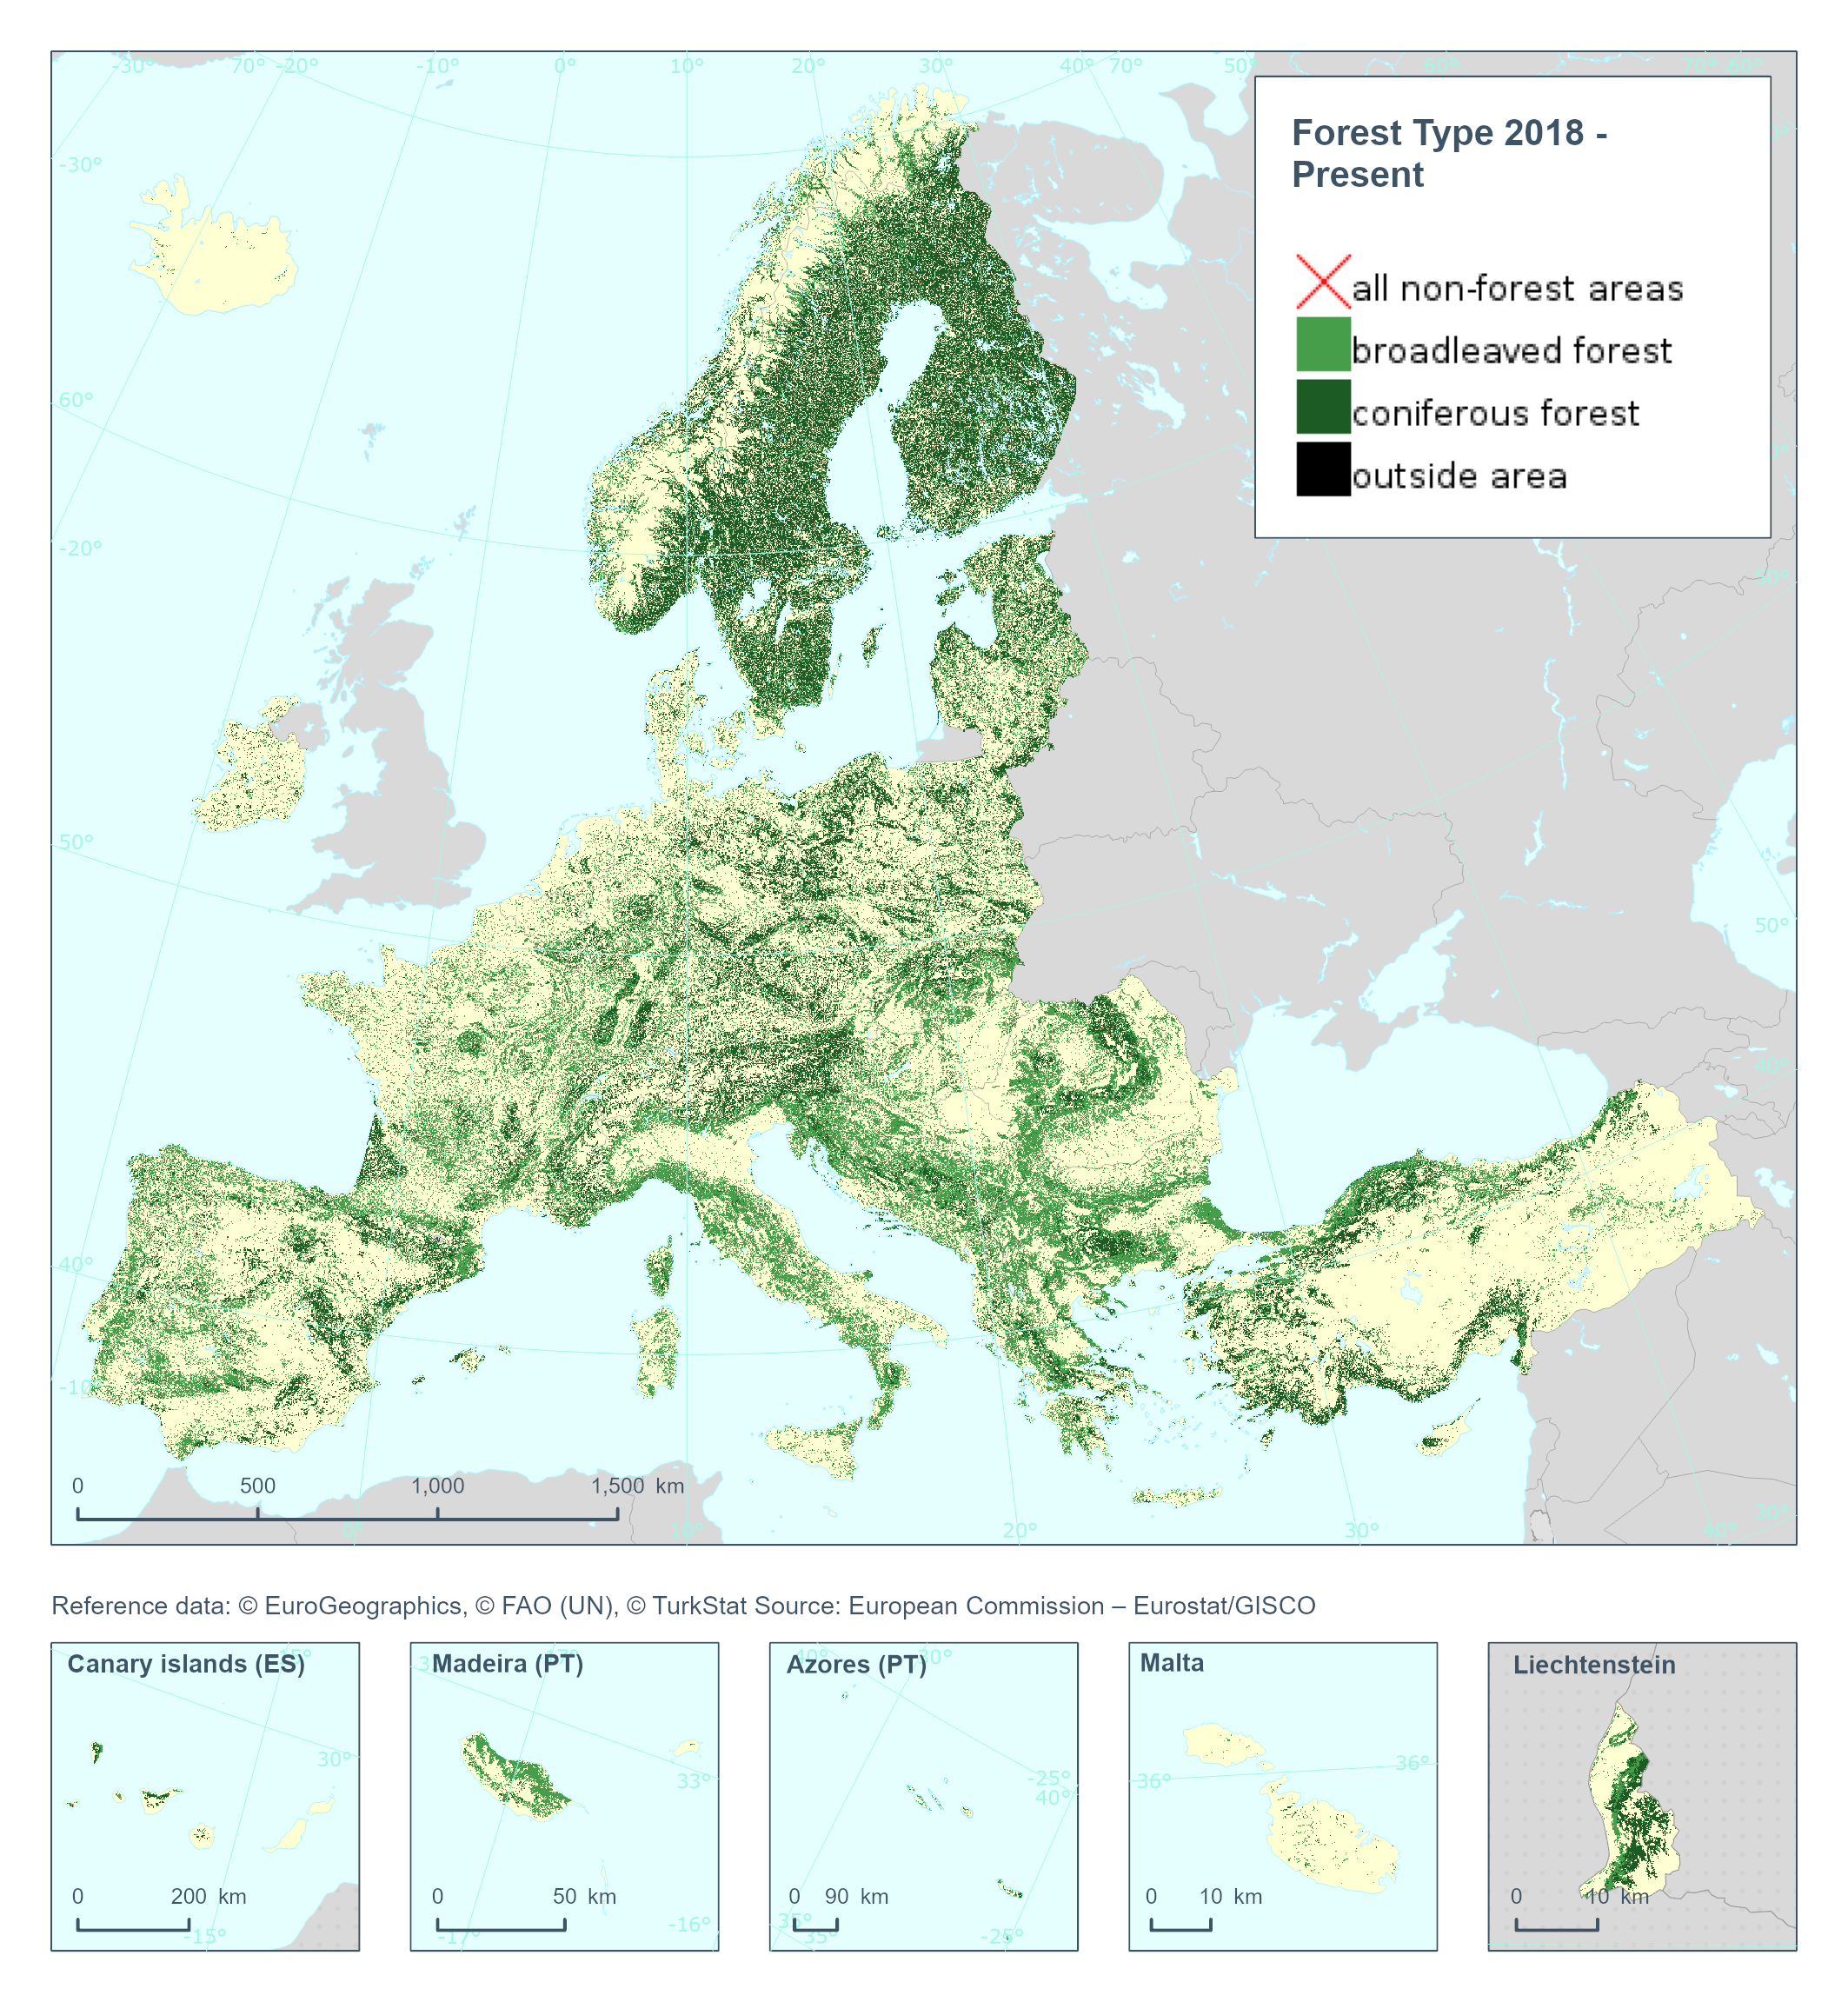
The High Resolution Layer Forest Type (FTY) provides a forest classification with 3 thematic classes (all non-forest areas / broadleaved forest / coniferous forest) at 10m spatial resolution and with a Minimum Mapping Unit (MMU) of 0.5 ha. This raster layer is largely following the FAO (Food and Agriculture Organisation of the United Nations) forest definition with tree covered areas in agricultural and urban context excluded using the respective Forest Additional Support Layer (FADSL). This dataset is provided on a 3-yearly frequency in 10 meter rasters (fully conformant with the EEA reference grid) in 100 x 100 km tiles covering the EEA38 countries. High Resolution Layer Tree Cover and Forest product is part of the European Union’s Copernicus Land Monitoring Service. This dataset includes data from the French Overseas Territories (DOMs)
-
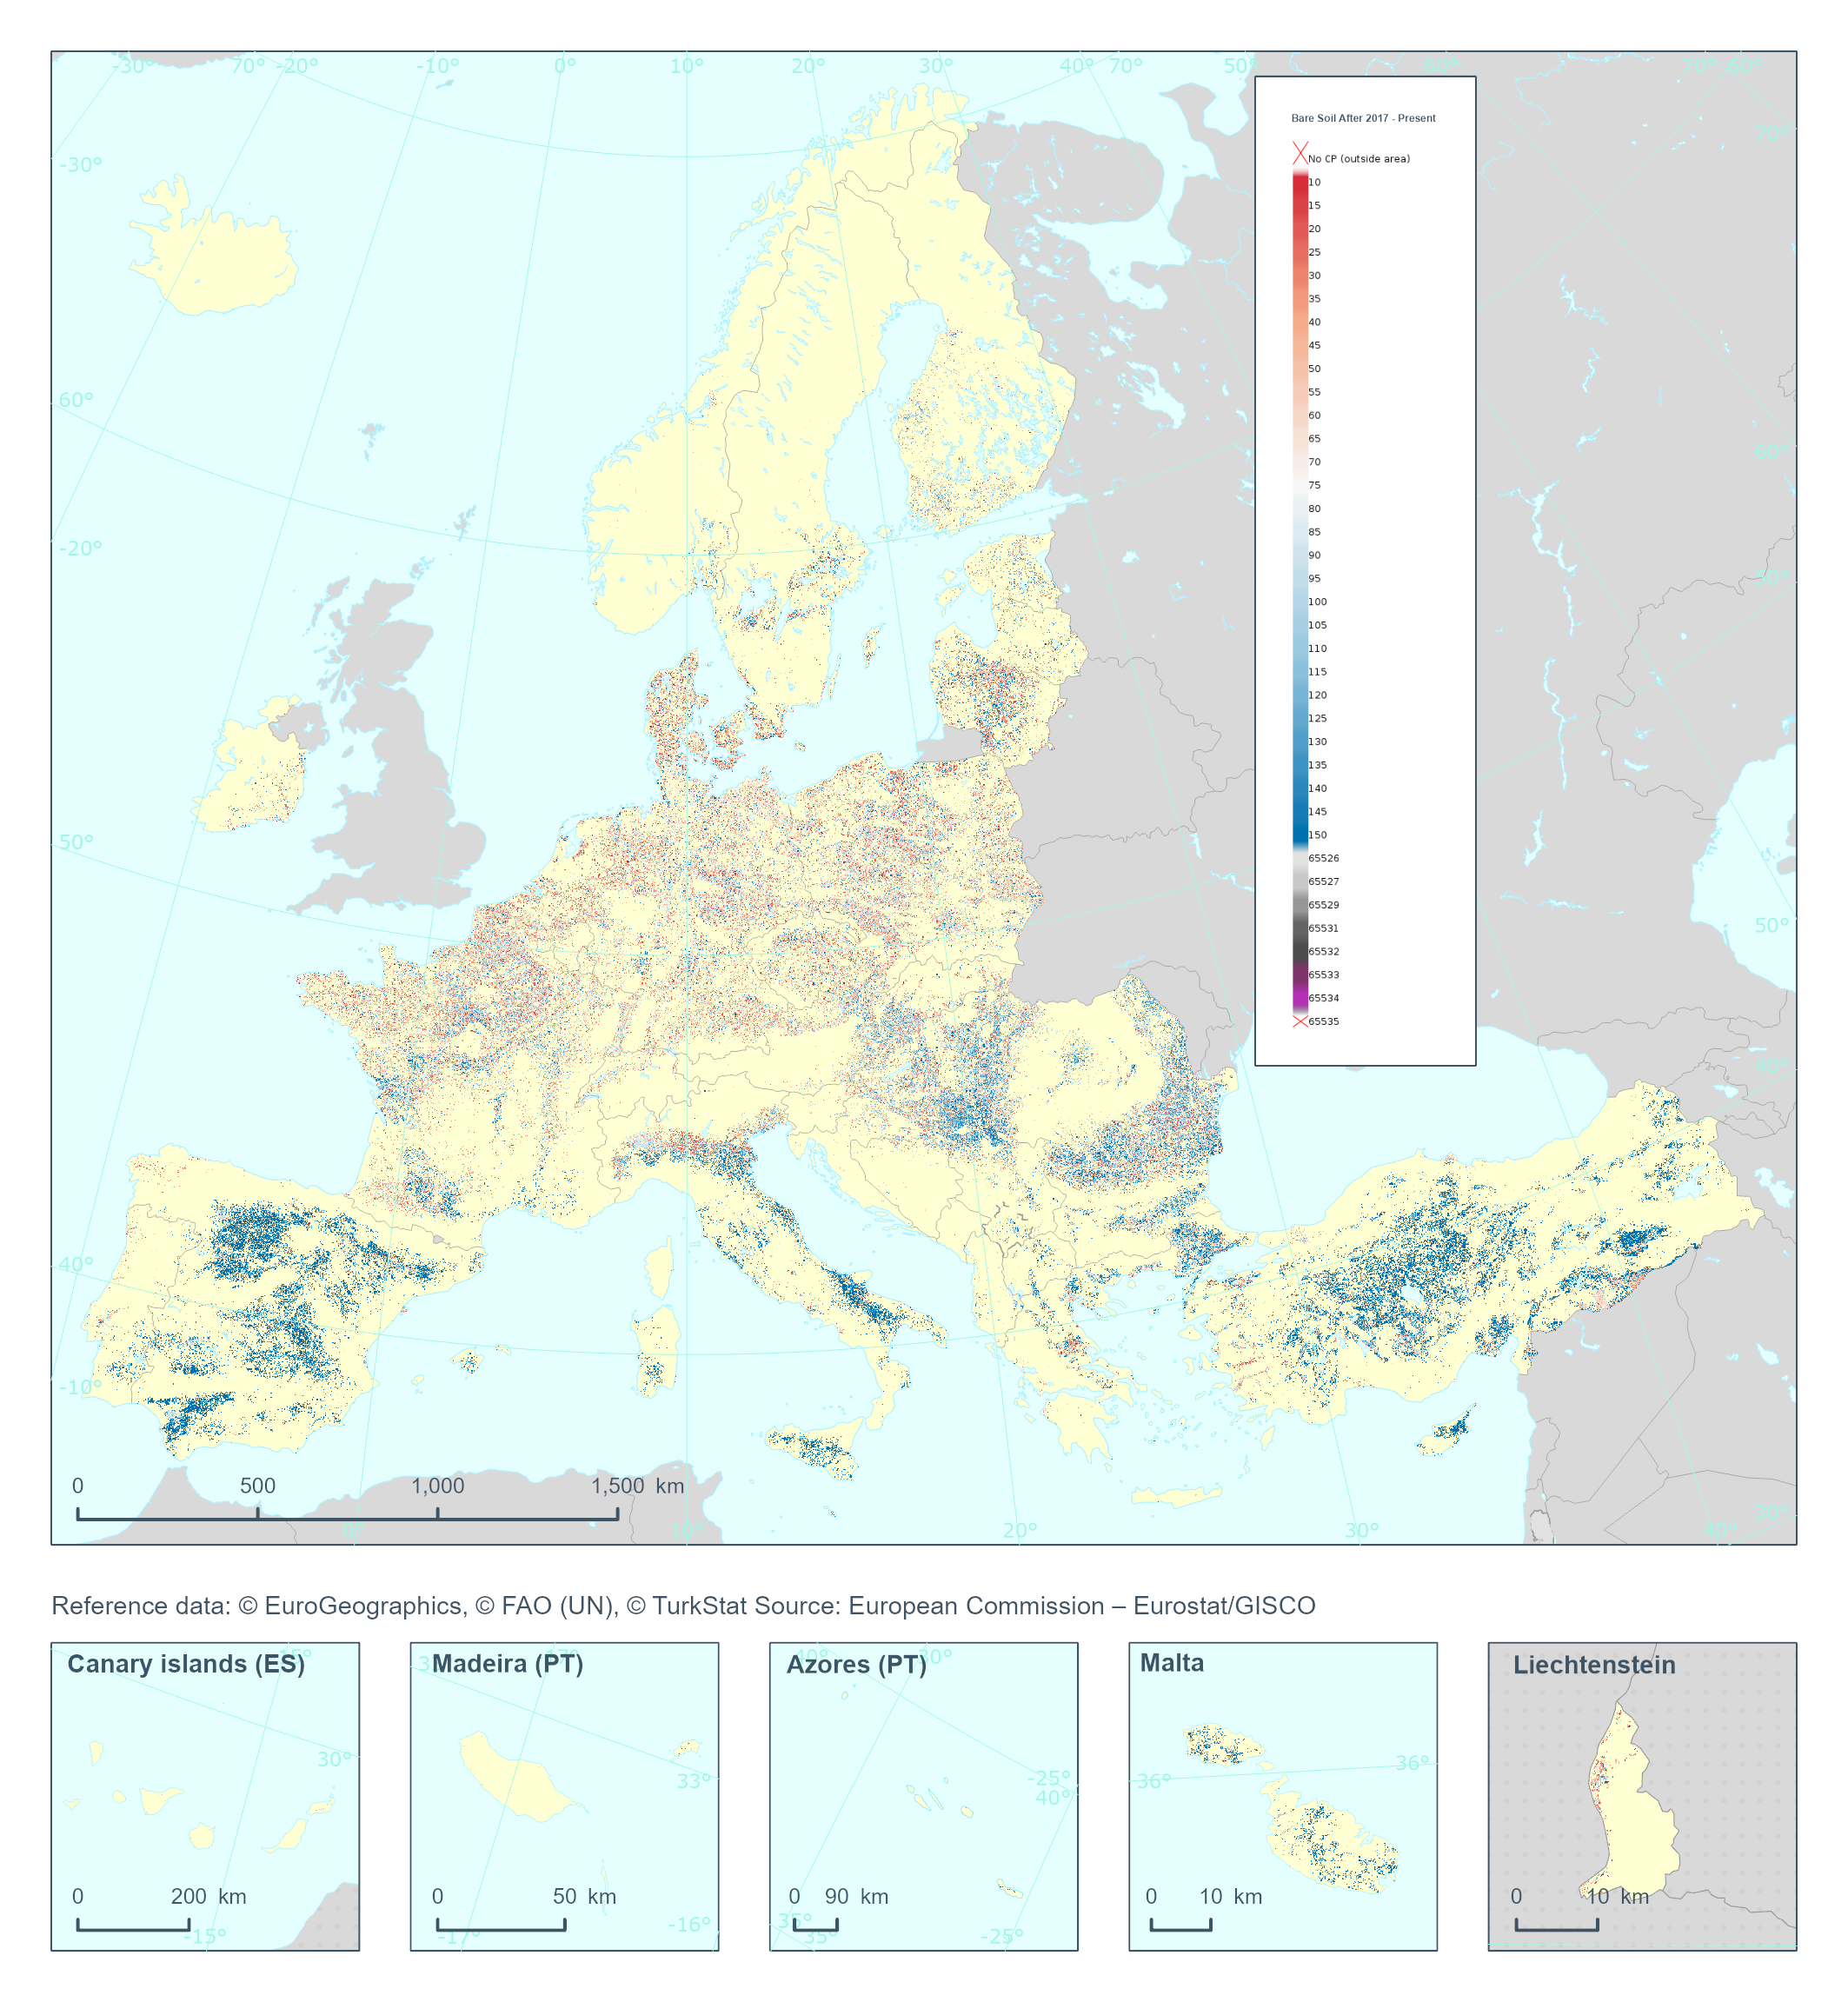
The High Resolution Layer Cropping Patterns - Bare Soil After (CPBSA) raster product provides bare soil period (in days) after the harvest of the main annual crop. Note that the bare soil period cannot transcend the calendar year for which the product is generated. This dataset is provided annually starting in 2017 with 10 meter rasters (fully conformant with the EEA reference grid) in 100 x 100 km tiles covering the EEA38 countries. High Resolution Layer Croplands product is part of the European Union’s Copernicus Land Monitoring Service. Confidence layer available for the dataset. This dataset includes data from the French Overseas Territories (DOMs)
-
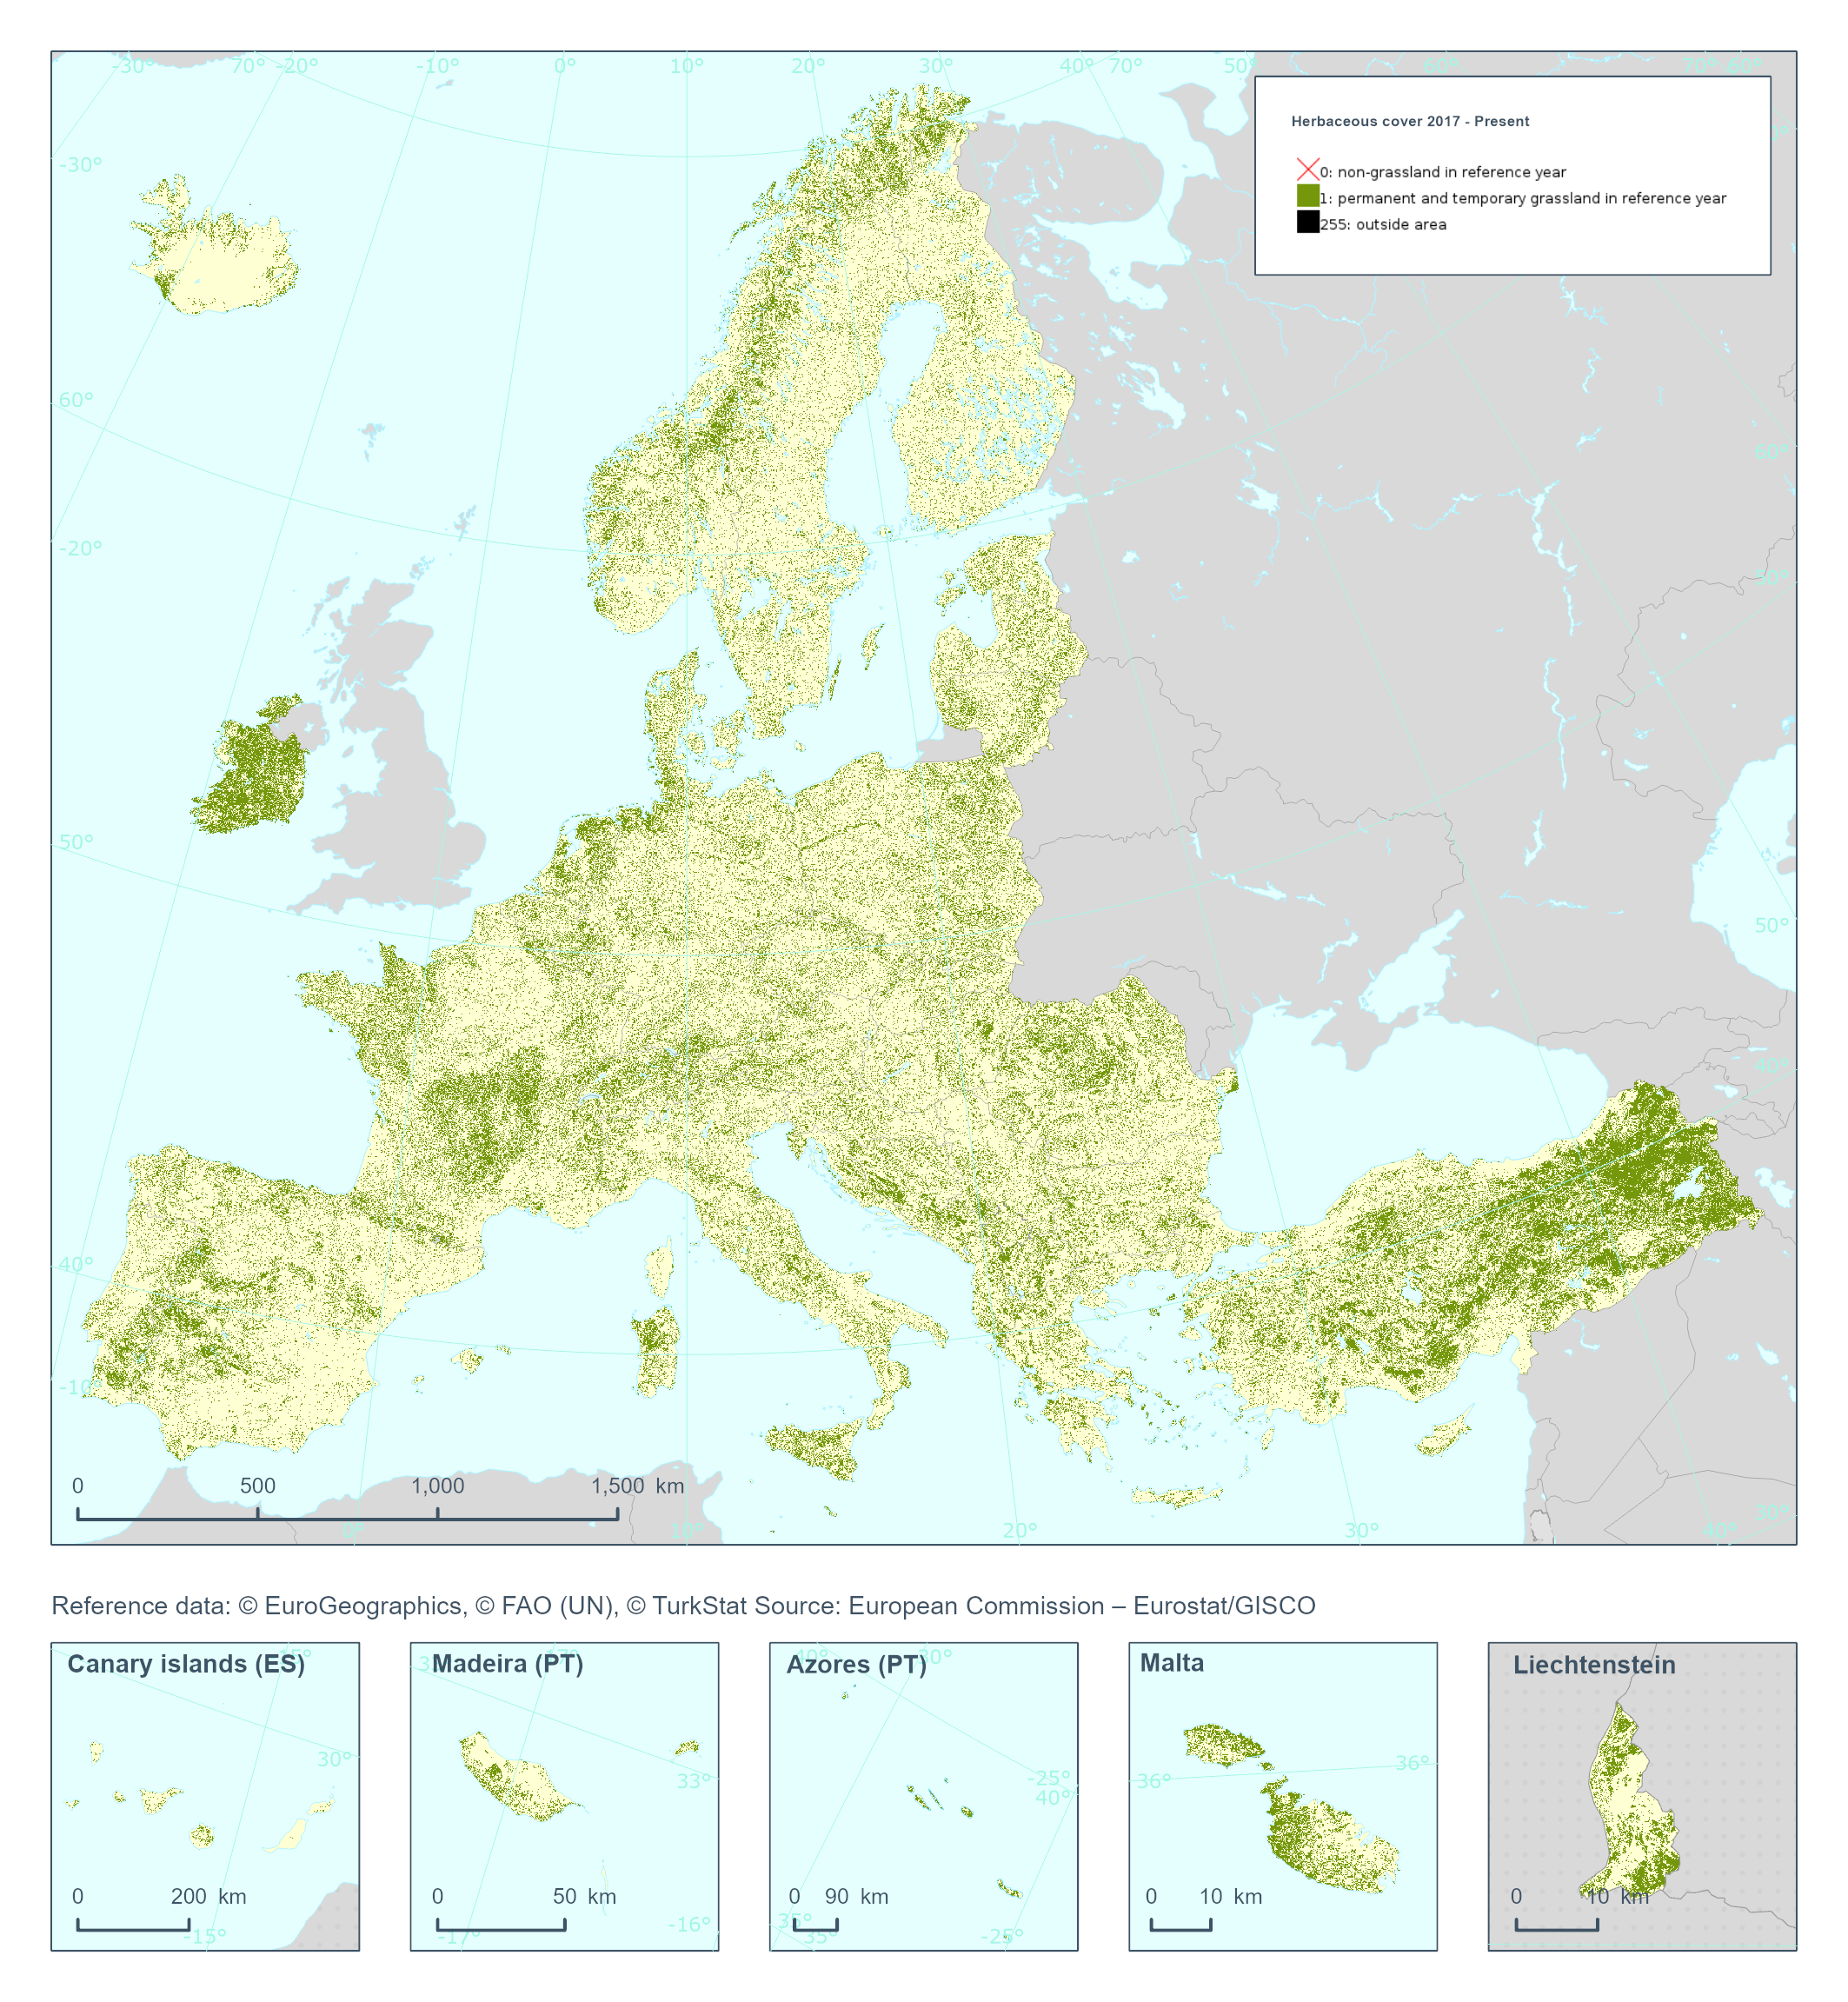
The High Resolution Layer Herbaceous cover (HER) raster product provides a basic land cover classification with 2 thematic classes (temporal and permanent herbaceous / non-herbaceous). The production of the herbaceous layer is primarily based on the probability estimates obtained from the Base Vegetation Layer (BVL) which also serves to harmonize the different vegetated HRL products (Grasslands, Tree Cover and Forests, Croplands). HER is further used as input for the Grassland status layer (GRA) extracting the permanent herbaceous in combination with the Ploughing indicator (PLOUGH). This dataset is provided annually starting in 2017 with 10 meter rasters (fully conformant with the EEA reference grid) in 100 x 100 km tiles covering the EEA38 countries. High Resolution Layer Grasslands product is part of the European Union’s Copernicus Land Monitoring Service. This dataset includes data from the French Overseas Territories (DOMs)
-
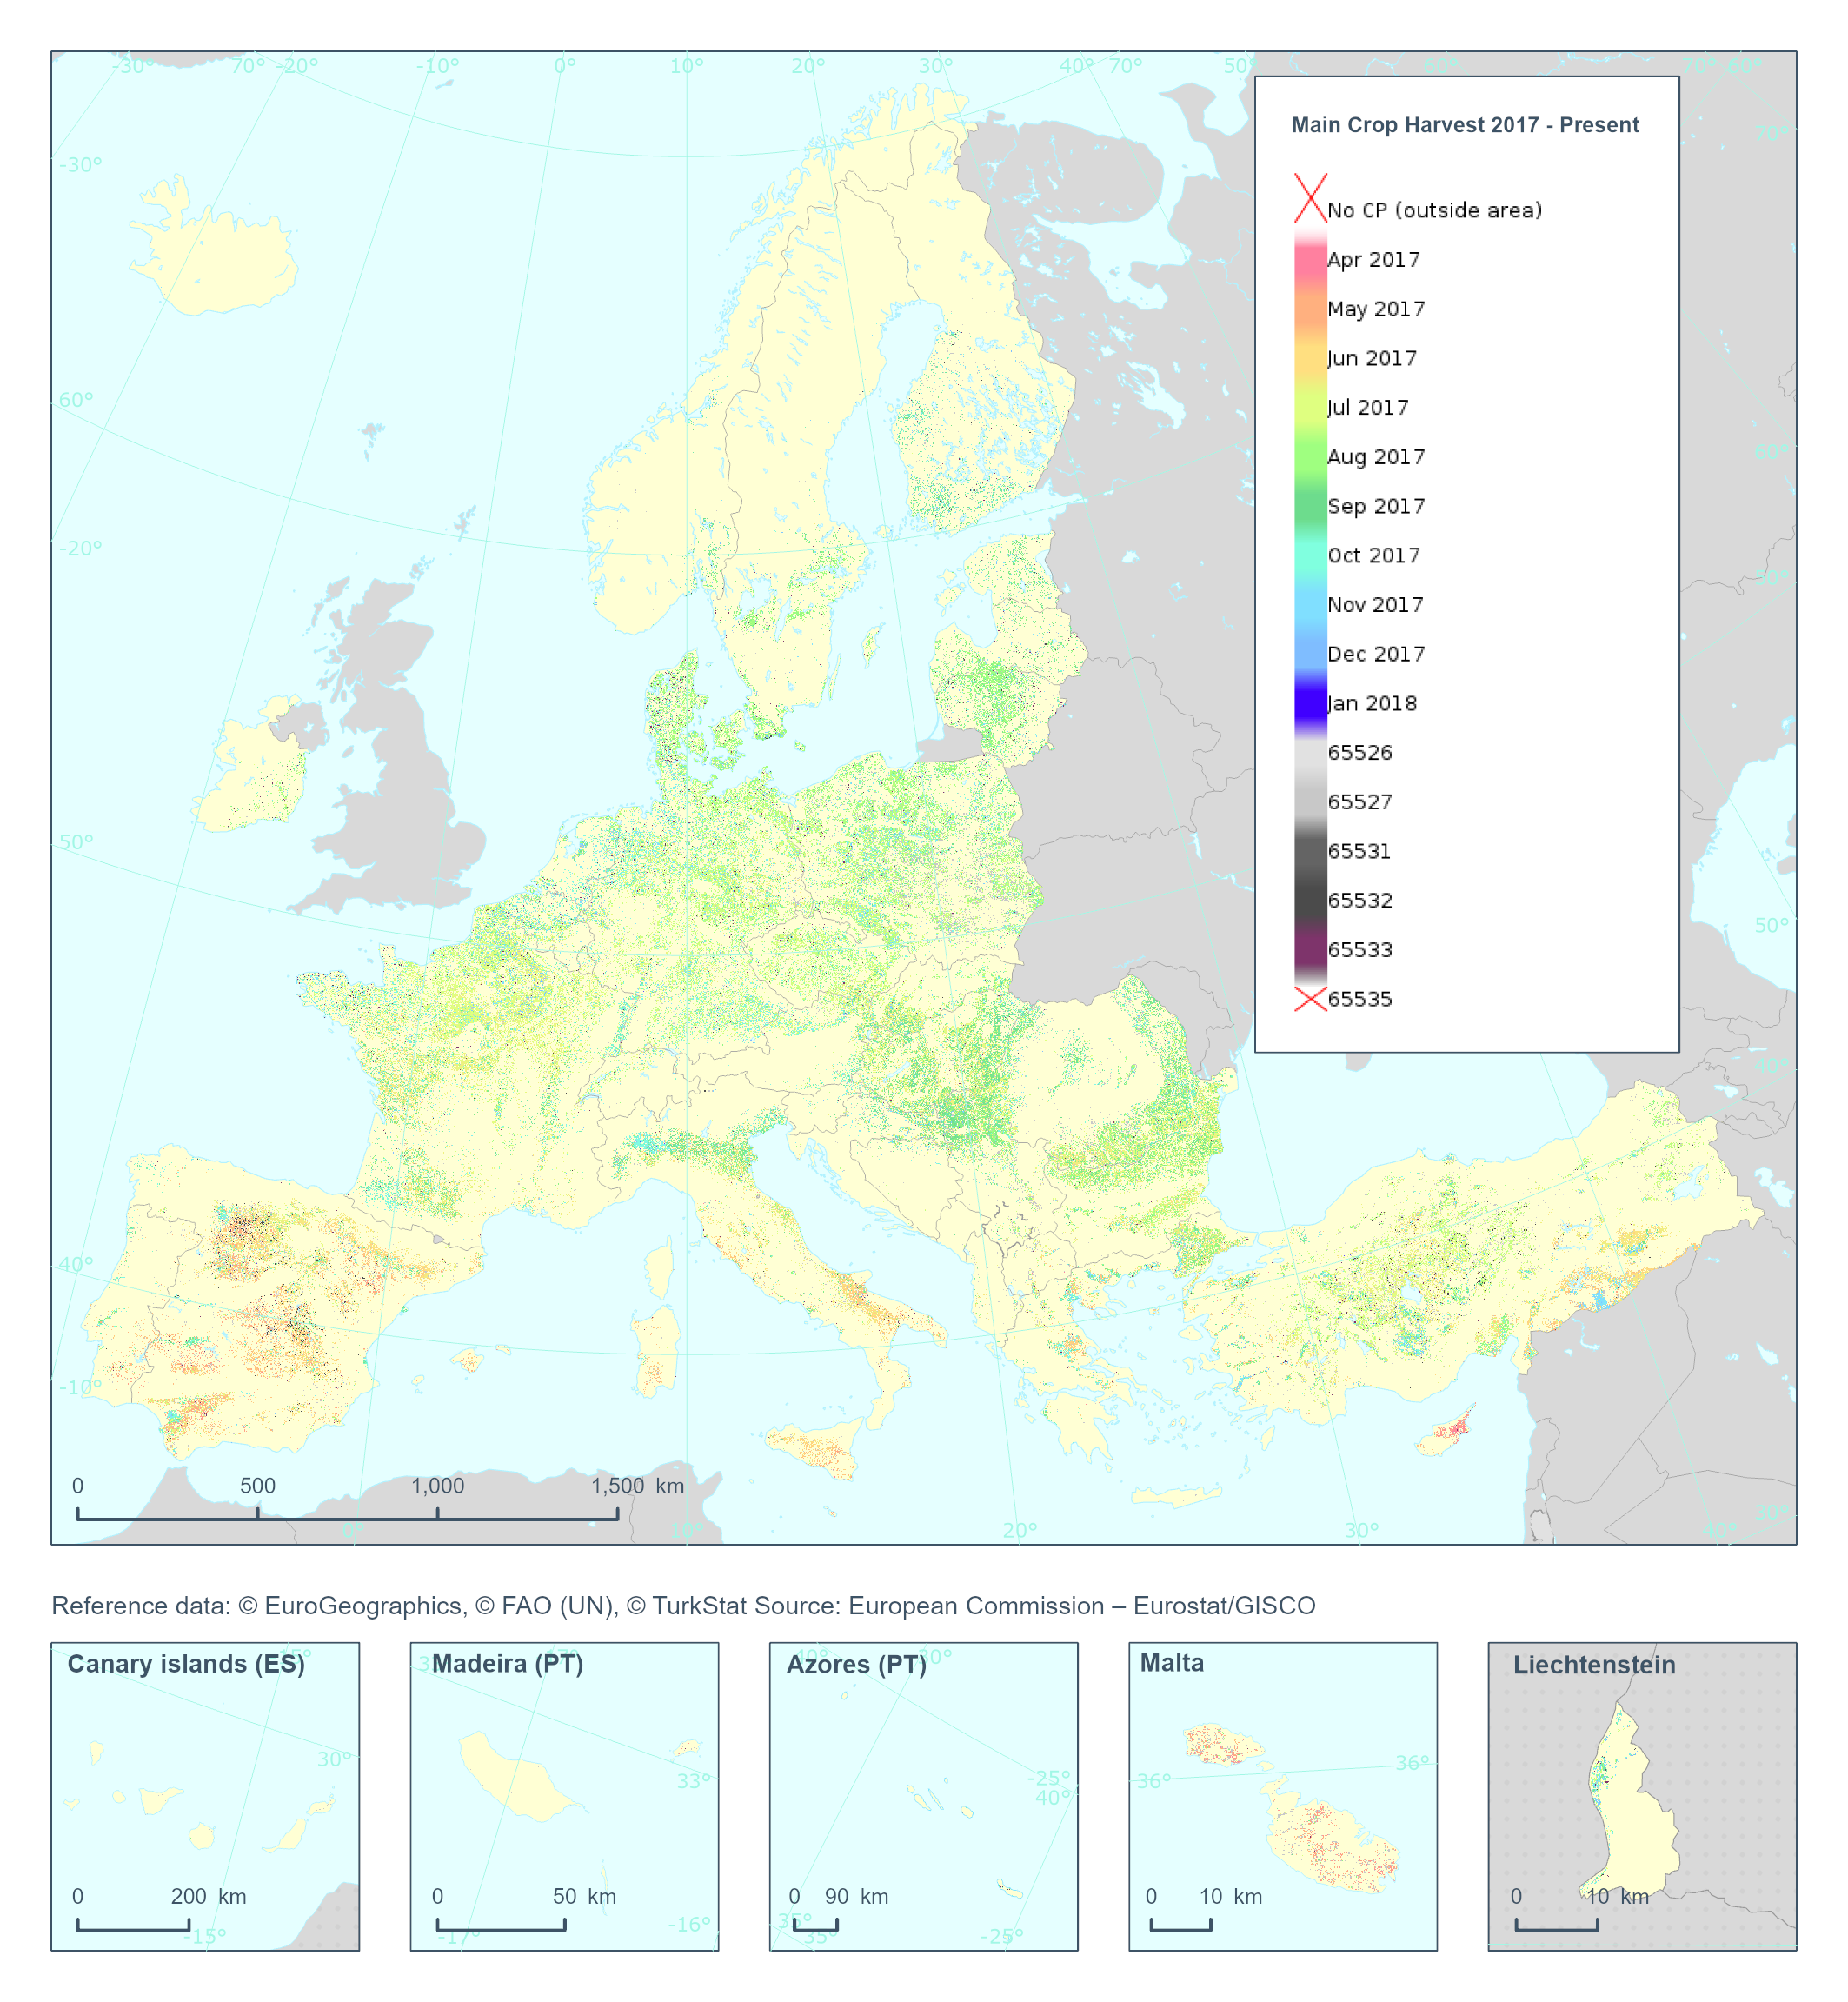
The High Resolution Layer Cropping Patterns - Main Crop Harvest (CPMCH) raster product provides the harvest date of the main (annual) crop expressed in days of the year (DOY). The harvest is considered as the time of removal of most of the biomass. YYDOY where YY = last 2 digits of the year (e.g. 19 for 2019) and DOY is the day of the year (1-365) This dataset is provided annually starting in 2017 with 10 meter rasters (fully conformant with the EEA reference grid) in 100 x 100 km tiles covering the EEA38 countries. High Resolution Layer Croplands product is part of the European Union’s Copernicus Land Monitoring Service. Confidence layer available for the dataset. This dataset includes data from the French Overseas Territories (DOMs)
-
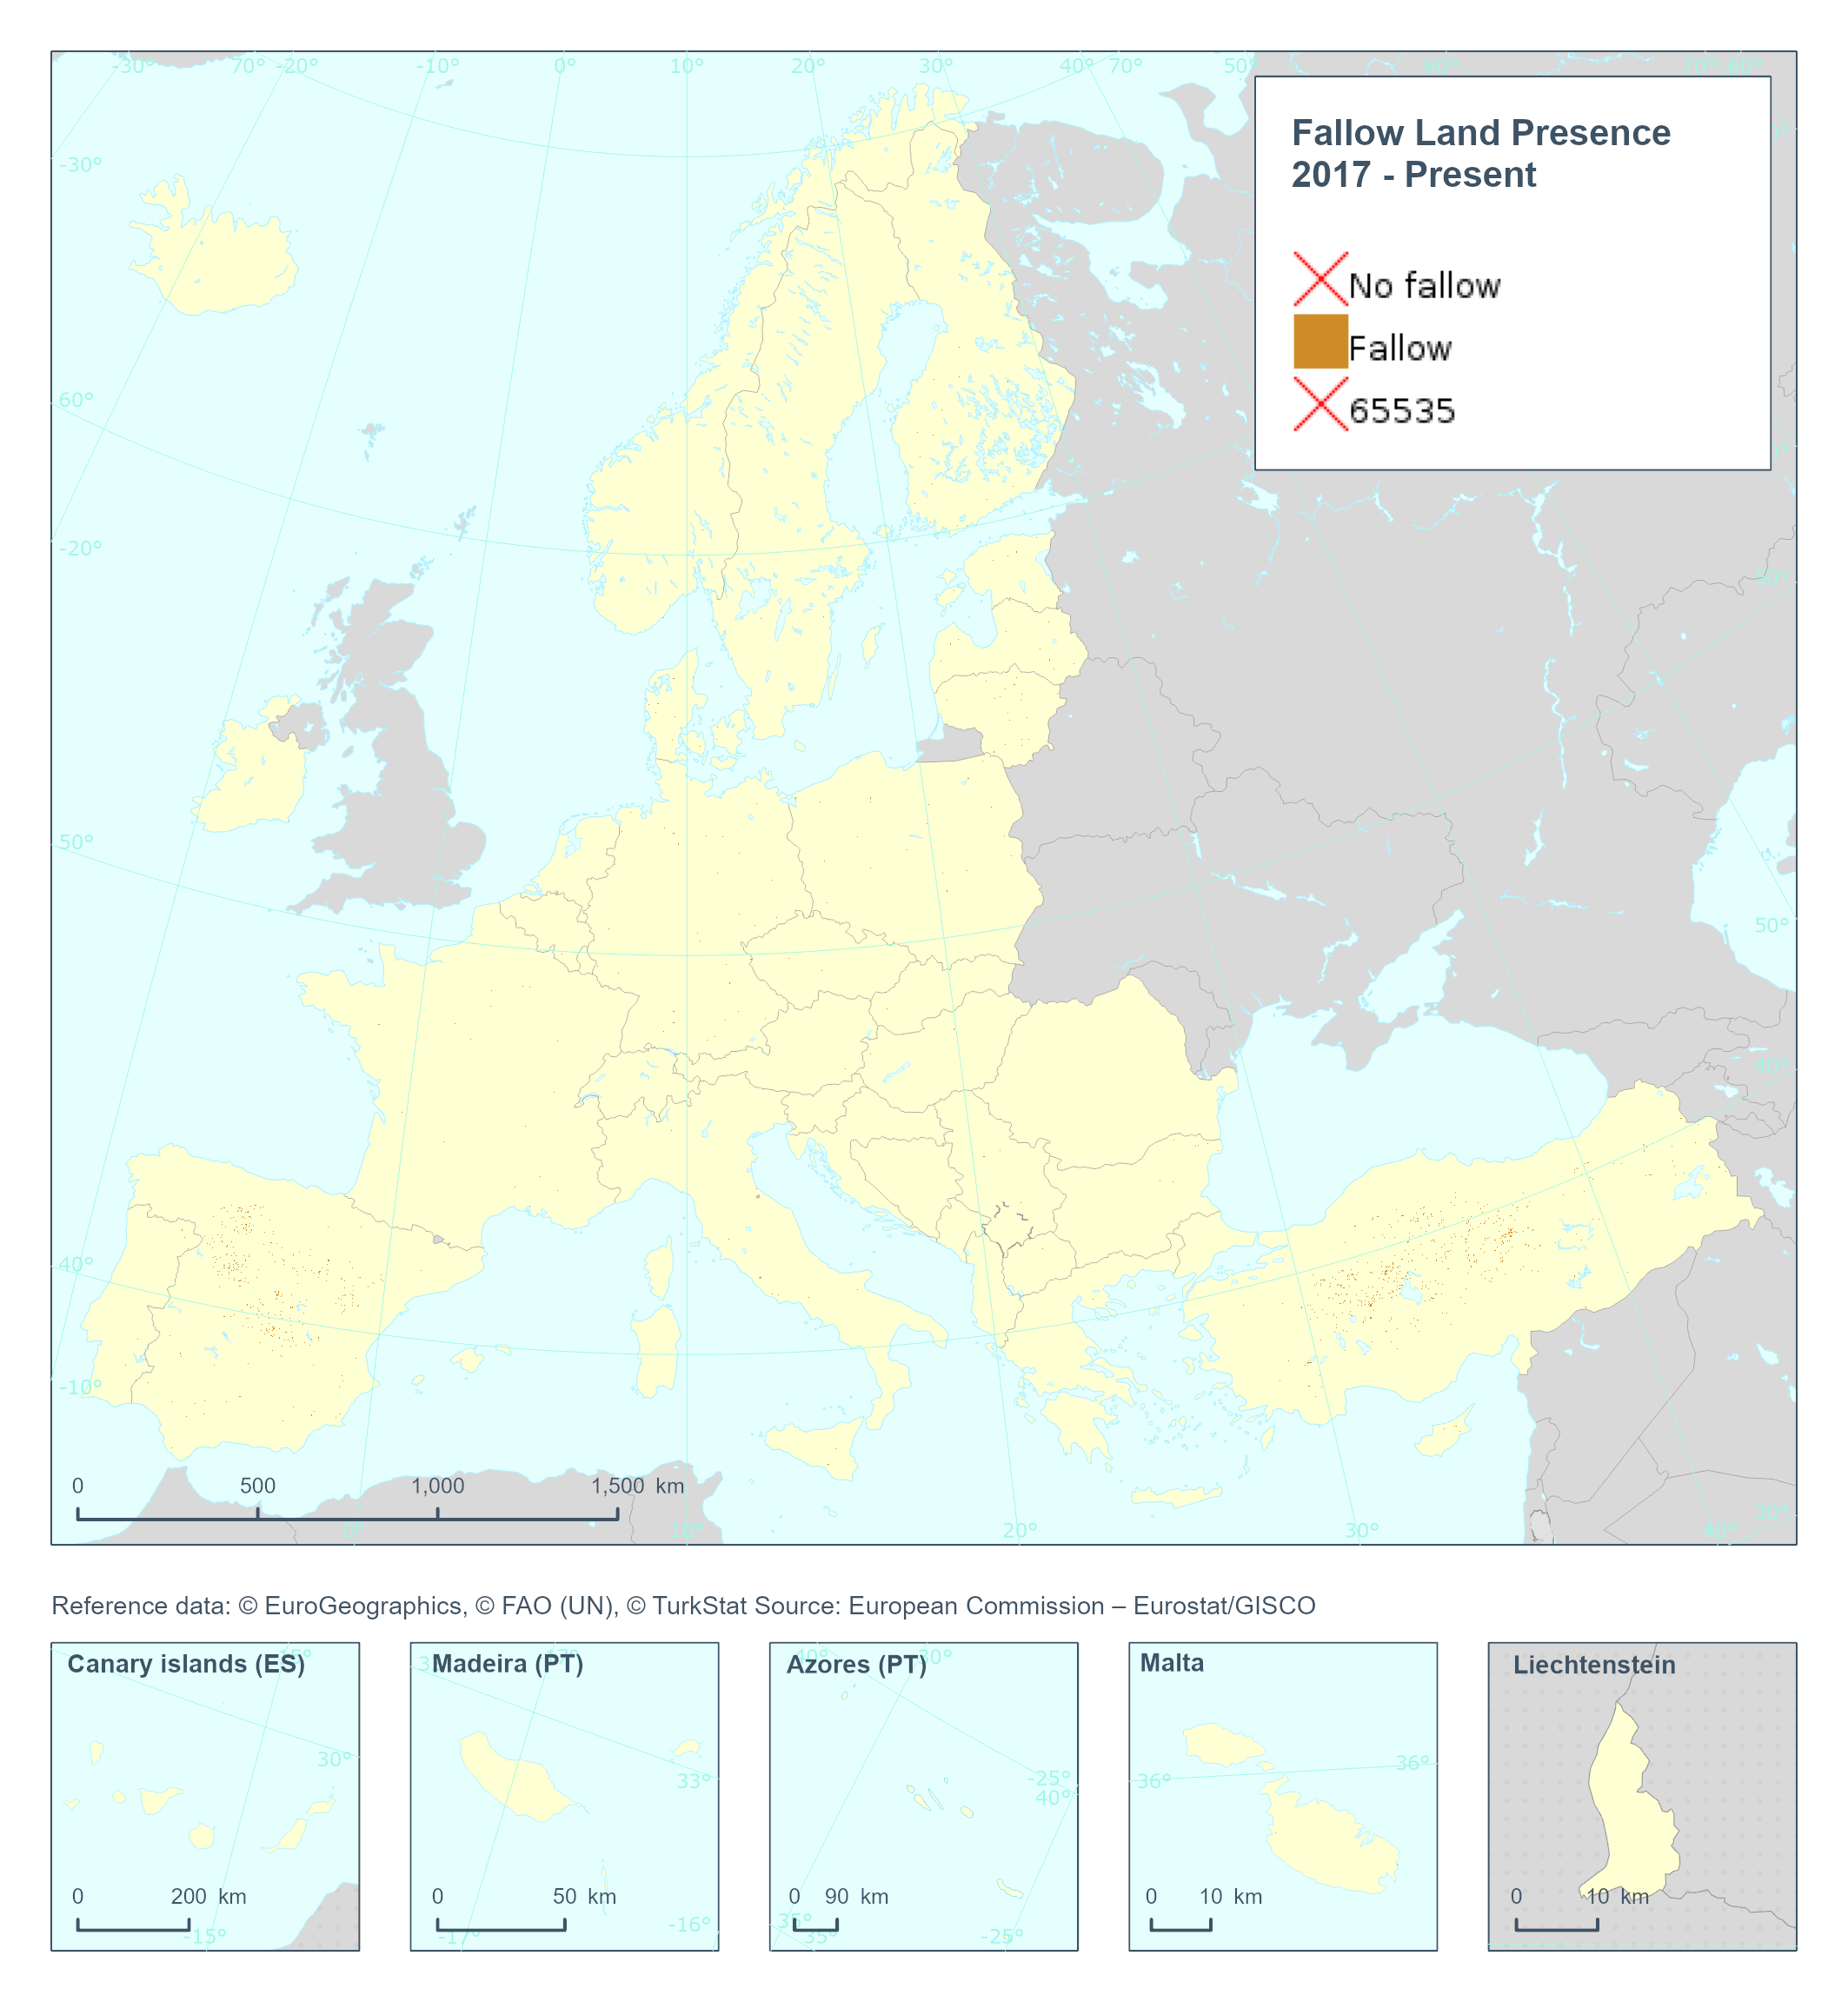
The High Resolution Layer Cropping Patterns - Fallow Land Presence (CPFLP) raster product provides the yearly fallow land classification indicating if arable land has been left fallow in the respective calendar year. This dataset is provided annually starting in 2017 with 10 meter rasters (fully conformant with the EEA reference grid) in 100 x 100 km tiles covering the EEA38 countries. High Resolution Layer Croplands product is part of the European Union’s Copernicus Land Monitoring Service. Confidence layer available for the dataset. This dataset includes data from the French Overseas Territories (DOMs)