 Arctic SDI catalogue
Geographic information systems
Type of resources
Available actions
Topics
Keywords
Contact for the resource
Provided by
Formats
Representation types
Update frequencies
status
Scale
Resolution
-

This collection is a legacy product that is no longer supported. It may not meet current Government standards. The National Topographic Data Base (NTDB) comprises digital vector data sets that cover the entire Canadian landmass. The NTDB includes features such as watercourses, urban areas, railways, roads, vegetation, and relief. The organizational unit for the NTDB is the National Topographic System (NTS), based on the North American Datum of 1983 (NAD83). Each file (data set) consists of one NTS unit at either the 1:50,000 or 1:250,000 scale. Related Products: [NTDB Correction Matrices, 2003-2009](https://ouvert.canada.ca/data/en/dataset/b6d0c19c-27e3-4392-b21f-49b1eec95653)
-
This collection is a legacy product that is no longer maintained. It may not meet current government standards. The correction matrices for the National Topographic Data Base (NTDB), also known under the acronym CORMAT, are products derived from the planimetric enhancement of NTDB data sets at the 1:50 000 scale. The correction matrix enables users to enhance the geometric accuracy of the less accurate NTDB. The matrix is a set of points arrayed on a regular 100-m grid. Each point describes the planimetric correction (DX, DY) to be applied at this location. The position of the points is given in UTM (Universal Transverse Mercator projection) coordinates based on the North American Datum of 1983 (NAD83) . Each file constitutes a rectangular area covering the entire corresponding NTDB data set. Its delimitation corresponds more or less to National Topographic System (NTS) divisions at the 1:50 000 scale. All NTDB data sets at the 1:50 000 scale whose original accuracy was less than 30 m can thus be geometrically corrected. A CORMAT data set contains a list of coordinates and the corresponding corrections to be applied in the form X Y DX DY. Related Products: [National Topographic Data Base (NTDB), 1944-2005](https://open.canada.ca/data/en/dataset/1f5c05ff-311f-4271-8d21-4c96c725c2af)
-

The National Pedon Database is a limited, vetted dataset containing over a hundred soil properties. Additionally, this release of the National Pedon Database is only a subset of the information contained within the core National Pedon Database (NPDB) holdings.
-

Predicted Soil Great Group class as defined by the The Canadian System of Soil Classification (third edition).
-

Predicted clay percentage (%) at a defined depth range (0–5 cm, 5–15 cm, 15–30 cm, 30–60 cm, 60–100 cm).
-
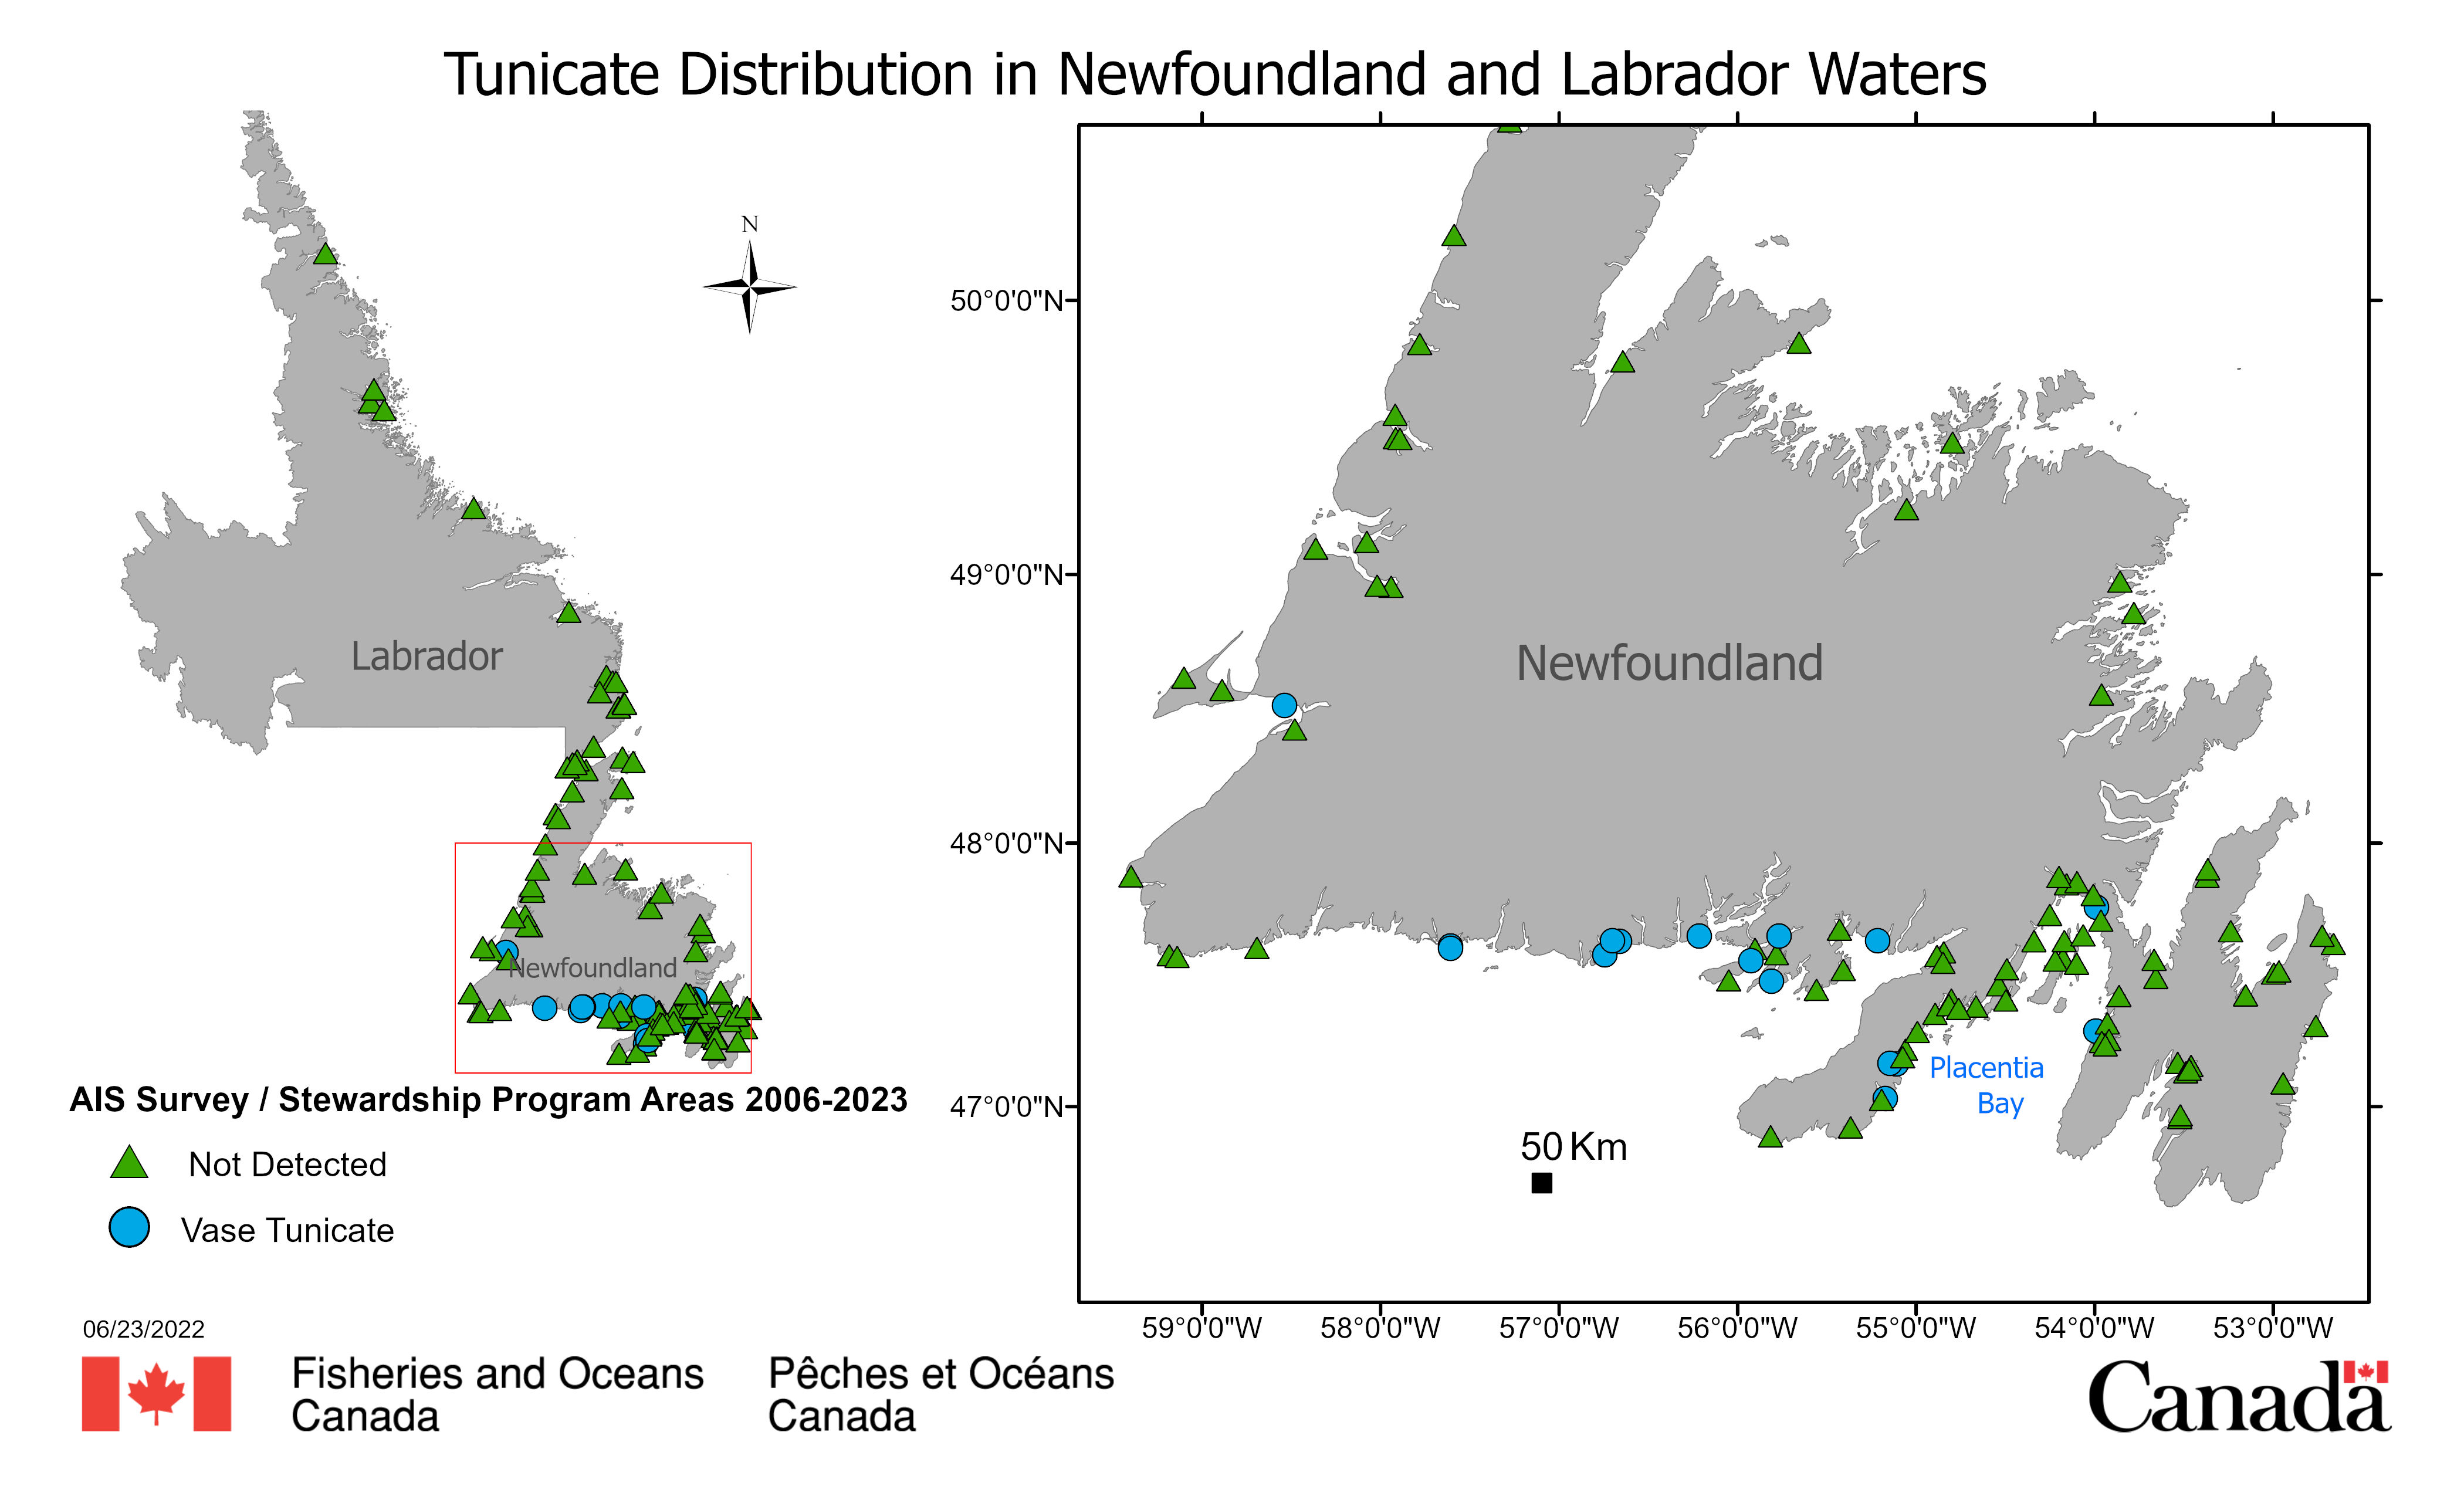
AIS NL Biofouling Species Fisheries and Oceans Canada's (DFO) National Marine Biofouling Monitoring Program conducts annual field surveys to monitor the introduction, establishment, spread, species richness, and relative abundance of native and some non-native species in Newfoundland and Labrador (NL) Region since 2006. Standardized monitoring protocols employed by DFO's NL, Maritimes, Gulf, and Quebec regions include biofouling collector plates deployed from May to October at georeferenced intertidal and shallow subtidal sites, including public docks, and public and private marinas and nautical clubs. Initially, (2006-2017), the collectors consisted of three 10 cm by 10 cm PVC plates deployed in a vertical array and spaced approximately 40 cm apart, with the shallowest plate suspended at least 1 m below the surface to sample subtidal and shallow intertidal species (McKenzie et al 2016a). Three replicate arrays were deployed at least 5 m apart per site. Since 2018, collector networks have been modified to improve statistical replication, including up to 10 individual collectors deployed per site at 1 m depth and at least 5 m apart (as above) from May to October. Since 2006, seven invasive biofouling organisms have been detected in Newfoundland and Labrador harbours, marinas and coastal areas. Should be cited as follows: DFO Newfoundland and Labrador Region Aquatic Invasive Species Marine Biofouling Monitoring Program. Published March 2024. Coastal and Freshwater Ecology, Northwest Atlantic Fisheries Centre, Fisheries and Oceans Canada, St. John’s, Newfoundland and Labrador. Reference: Tunicates Vase tunicate (Ciona intestinalis) 2012 The Vase tunicate, is a high impact solitary invader and was first detected by DFO in 2012 on the Burin Peninsula at Ship Cove and Little Bay, Placentia Bay. Various mitigation measures (McKenzie et al. 2016b) contained this invasive tunicate to a small area for six years within Placentia Bay. First detected in Fortune Bay as an established population in 2019, increasing reports of the Vase tunicate have been made along the south coast of Newfoundland. The data provided here indicates the detections of this AIS in coastal NL. From 2018-2022, the Coastal Environmental Baseline Program provided additional support to enhance sampling efforts in Placentia Bay.
-

Predicted soil pH in CaCl2 at a defined depth range (0–5 cm, 5–15 cm, 15–30 cm, 30–60 cm, 60–100 cm). The degree of acidity or alkalinity of a soil expressed in terms of the pH scale.
-

AIS NL Biofouling Species Fisheries and Oceans Canada's (DFO) National Marine Biofouling Monitoring Program conducts annual field surveys to monitor the introduction, establishment, spread, species richness, and relative abundance of native and some non-native species in Newfoundland and Labrador (NL) Region since 2006. Standardized monitoring protocols employed by DFO's NL, Maritimes, Gulf, and Quebec regions include biofouling collector plates deployed from May to October at georeferenced intertidal and shallow subtidal sites, including public docks, and public and private marinas and nautical clubs. Initially, (2006-2017), the collectors consisted of three 10 cm by 10 cm PVC plates deployed in a vertical array and spaced approximately 40 cm apart, with the shallowest plate suspended at least 1 m below the surface to sample subtidal and shallow intertidal species (McKenzie et al 2016a). Three replicate arrays were deployed at least 5 m apart per site. Since 2018, collector networks have been modified to improve statistical replication, including up to 10 individual collectors deployed per site at 1 m depth and at least 5 m apart (as above) from May to October. Since 2006, seven invasive biofouling organisms have been detected in Newfoundland and Labrador harbours, marinas and coastal areas. Should be cited as follows: DFO Newfoundland and Labrador Region Aquatic Invasive Species Marine Biofouling Monitoring Program. Published March 2024. Coastal and Freshwater Ecology, Northwest Atlantic Fisheries Centre, Fisheries and Oceans Canada, St. John’s, Newfoundland and Labrador. Reference: Tunicates Golden star tunicate (Botryllus schlosseri) 2006 The Golden star tunicate was the first invasive tunicate detected in NL waters. It was reported in Argentia by the US Navy around 1945. It was found in 2006 on wharf structures in Argentia, Placentia Bay during the first AIS survey (Callahan et al 2010). This colonial tunicate is recognized by it star shaped grouping of individuals within the colony. It is currently found in Placentia Bay, Fortune Bay, St. Mary’s Bay, Conception Bay and the west coast of NL. The data provided here indicates the detections of this AIS in coastal NL. From 2018-2022, the Coastal Environmental Baseline Program provided additional support to enhance sampling efforts in Placentia Bay.
-

Predicted Soil organic carbon (%) at a defined depth range (0–5 cm, 5–15 cm, 15–30 cm, 30–60 cm, 60–100 cm).
-

Predicted sand percentage (%) at a defined depth range.