 Arctic SDI catalogue
100 m
Type of resources
Available actions
Topics
Keywords
Contact for the resource
Provided by
Years
Formats
Scale
Resolution
-

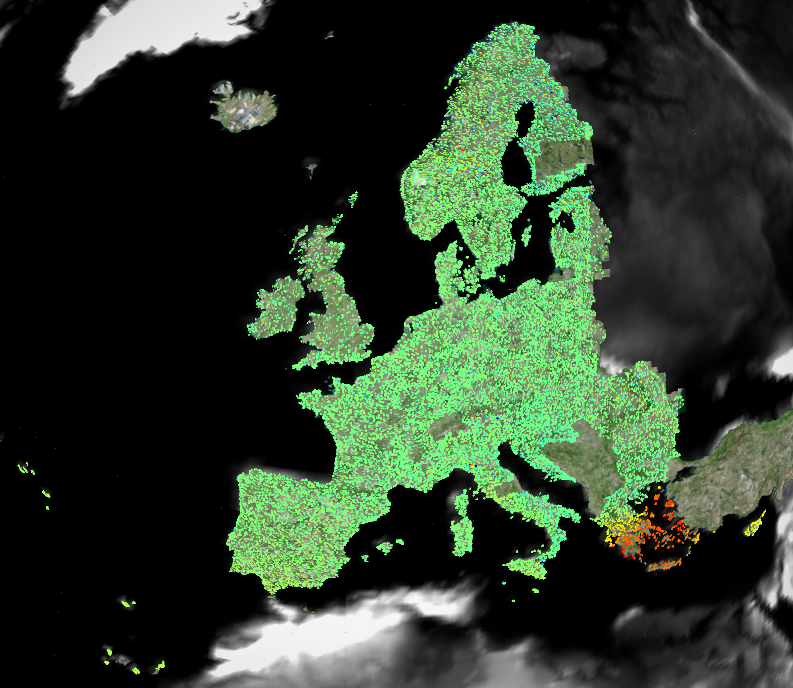
This metadata covers the Ice Cover Duration (ICD) product. It is generated once a year and it provides an estimated number of ice covered days for each pixel in the inland waters at European scale. The product is derived from Water/Ice Cover (WIC) products, both from Sentinel-1 and Sentinel-2 observations. It has a spatial resolution of 100 m x 100 m. It is also available in another projection as tiles aligned with Sentinel-2 (UTM/WGS84) at 20 m x 20 m. ICD is one of the products of the pan-European High-Resolution Water Snow & Ice portfolio (HR-WSI), which are provided at high spatial resolution from the Sentinel-2 and Sentinel-1 constellations data from September 1, 2016 onwards.
-

The Share of Built-Up Change (SBUC) 2018-2021 layer is part of the High Resolution Layer (HRL) Imperviousness and contains the change of built-up per pixel (increase or decrease in percentage) as derived from the difference between the Impervious Built-Up (IBU) status layers for the reference years 2018 and 2021, in an aggregated version of 100m spatial resolution. The production of the HRL Imperviousness is coordinated by EEA in the frame of Copernicus, the Earth observation component of the European Union’s Space programme. The product is a raster dataset with 100-meter grid spacing (spatial resolution) that covers the 38 Eionet member and cooperating countries as well as the United Kingdom (i.e. EEA38+UK). It is distributed as 100 x 100 km tiles that are fully conformant with the EEA reference grid.
-

The Imperviousness Change (IMDC) 2018-2021 layer is part of the High Resolution Layer (HRL) Imperviousness. It contains the imperviousness change per pixel (increase or decrease in percentage) as derived from the difference between the Imperviousness Density (IMD) status layers for the reference years 2018 and 2021, in an aggregated version of 100m spatial resolution. The production of the HRL Imperviousness is coordinated by EEA in the frame of Copernicus, the Earth observation component of the European Union’s Space programme. The product is a raster dataset with 100-meter grid spacing (spatial resolution) that covers the 38 Eionet member and cooperating countries as well as the United Kingdom (i.e. EEA38+UK). It is distributed as 100 x 100 km tiles that are fully conformant with the EEA reference grid.
-

The Sentinel-1 and Sentinel-2 Snow Phenology (SP S1+S2) product is generated once a year over high-mountain areas at European scale, based on daily cumulative Gap-Filled Fractional Snow Cover (GFSC) products calculated from Sentinel-2 optical and Sentinel-1 radar data. This product describes the snow season in terms of temporality as it provides, for each pixel, the number of days with snow cover, as well as the first and the last day of the longest observed snow period. It has a spatial resolution of 100 m x 100 m. Each product is composed of separate files corresponding to the different layers of the product, and another metadata file. The product is also available in another projection as tiles aligned with Sentinel-2 (UTM/WGS84) at 60 m x 60 m. SP S1+S2 is one of the products of the pan-European High-Resolution Water Snow & Ice portfolio (HR-WSI), which are provided at high spatial resolution from the Sentinel-2 and Sentinel-1 constellations data from September 1, 2016 onwards. t.
-
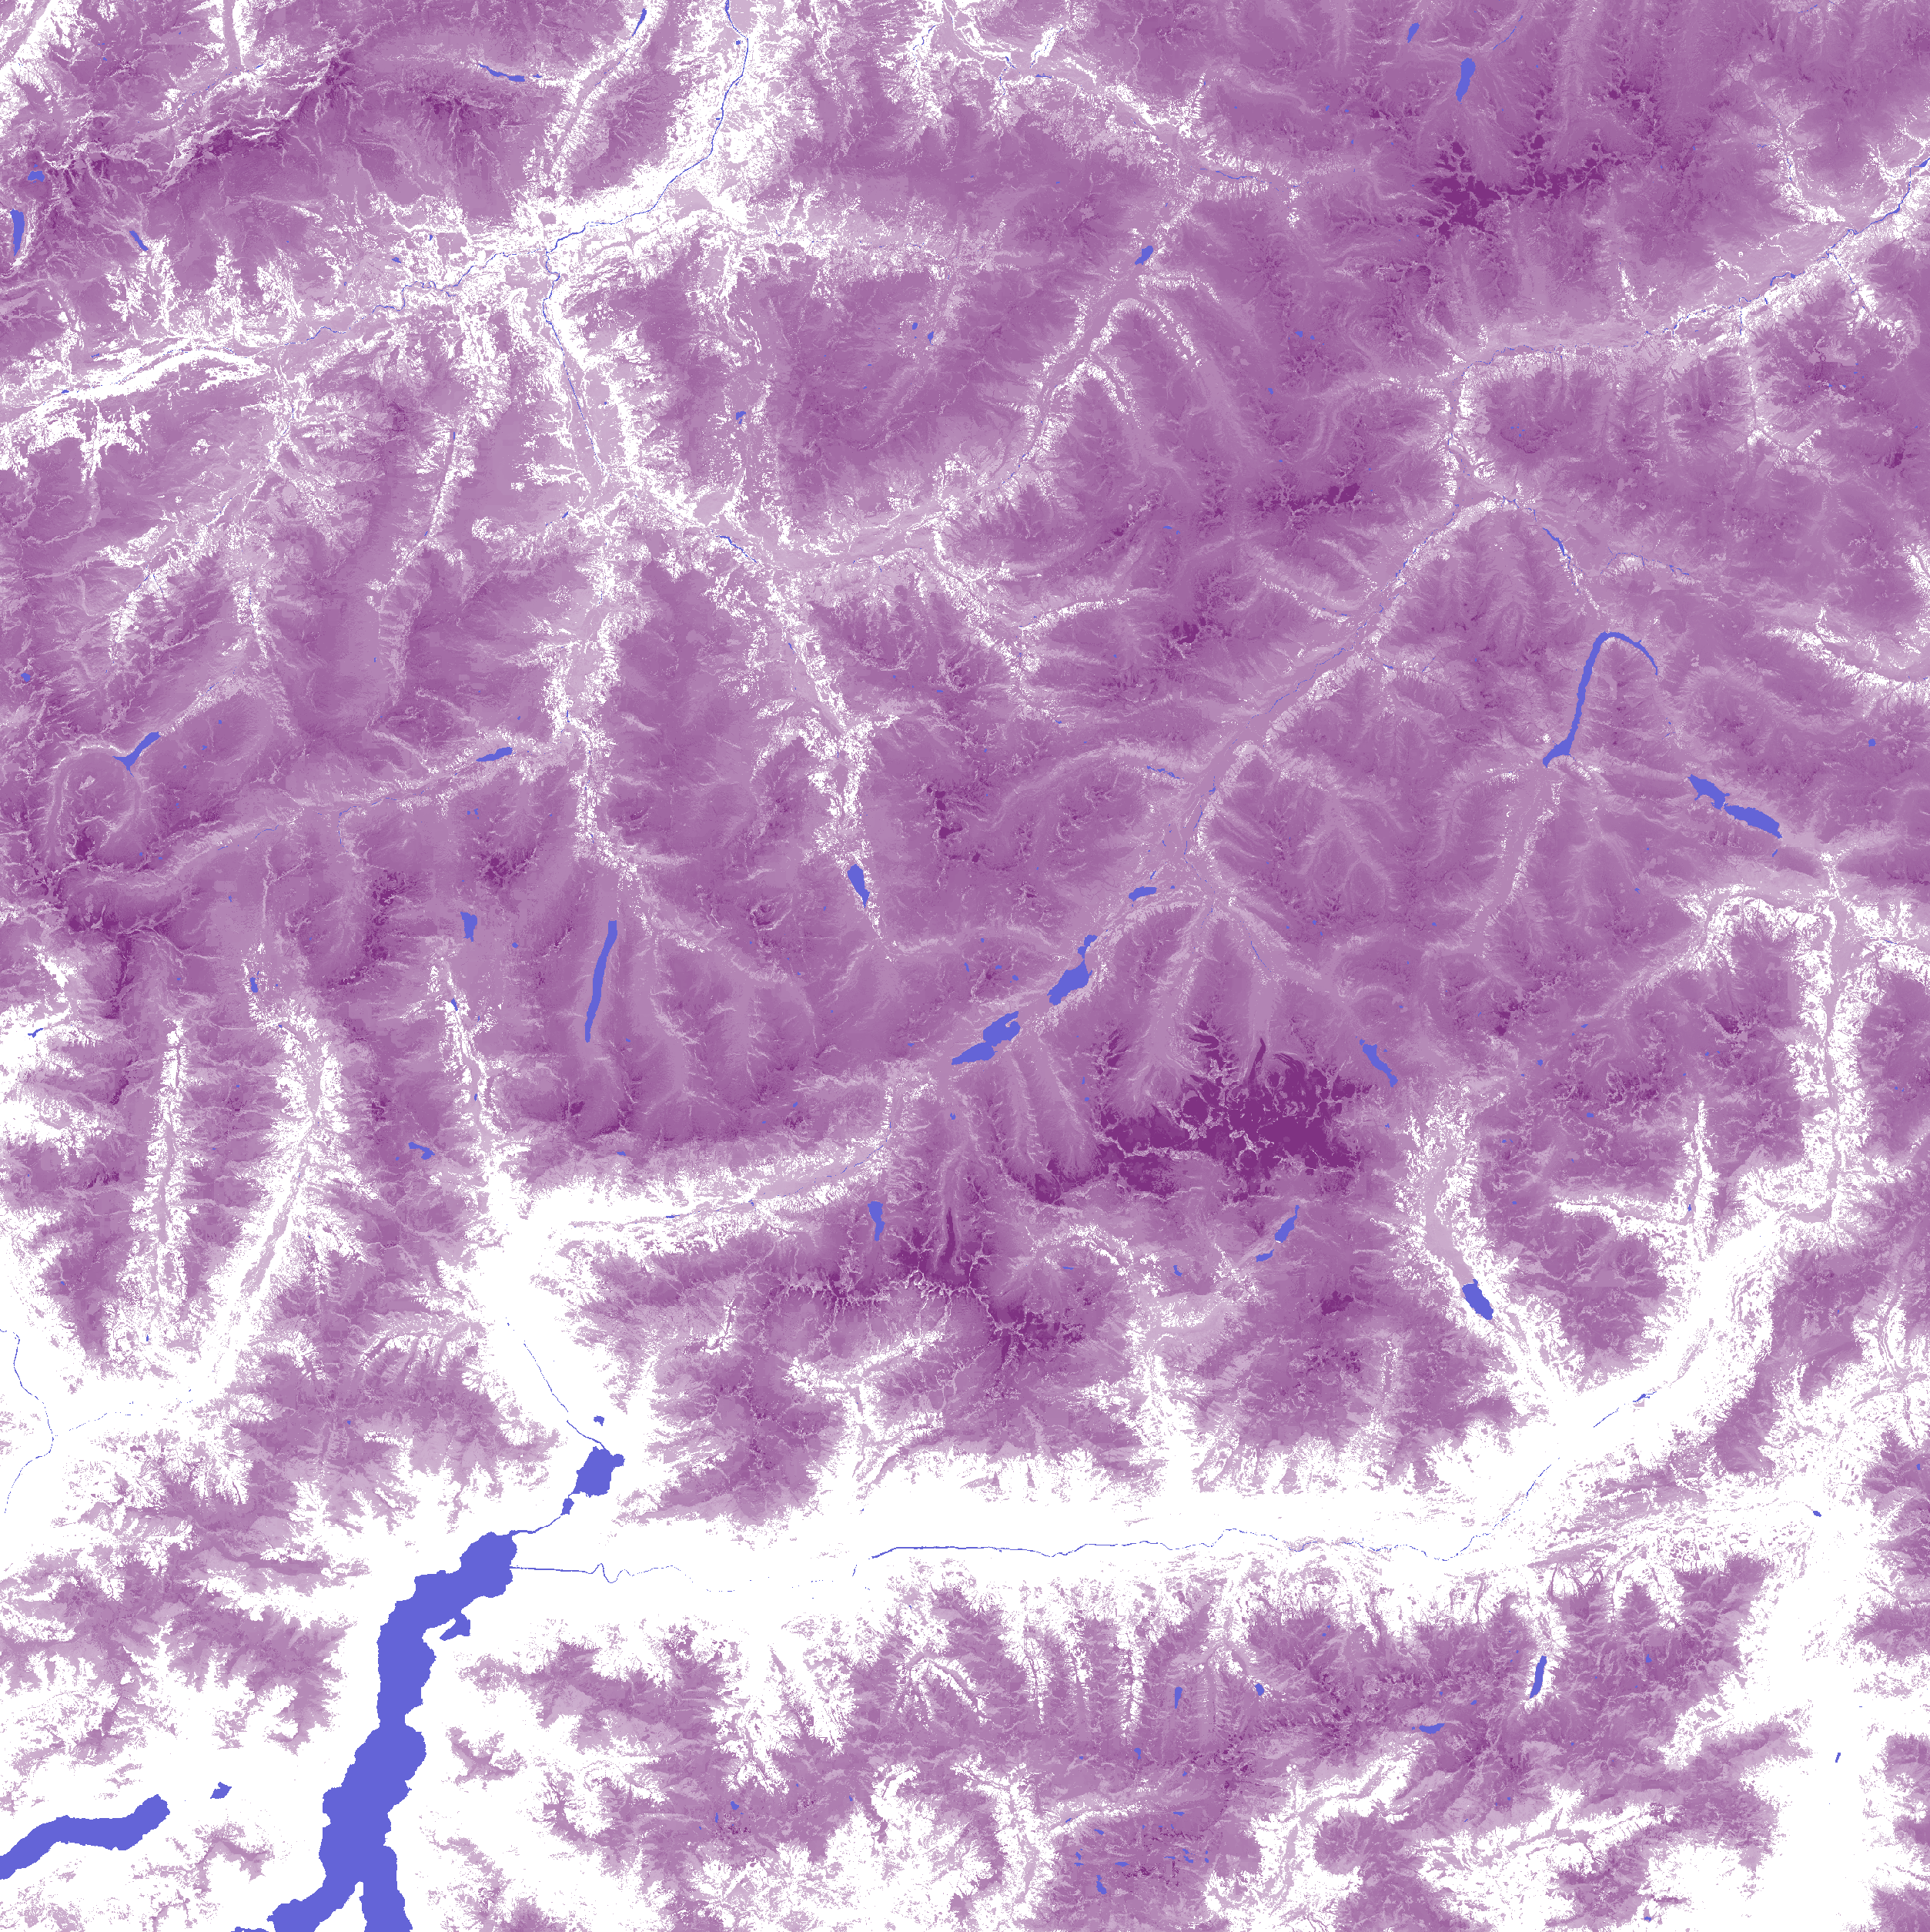
The European Ground Motion Service (EGMS), part of the Copernicus Land Monitoring Service, provides consistent, regular, standardised, harmonised, and reliable information on natural and anthropogenic ground motion phenomena across Copernicus Participating States and national borders, with millimetre-level accuracy. This metadata describes EGMS Ortho, the third product level in the EGMS portfolio. EGMS Ortho is derived from EGMS Calibrated through a resampling procedure onto a 100 m grid, using data from both ascending and descending satellite orbits. This process generates two distinct layers: one representing purely vertical displacements and one representing purely east-west displacements (the subject of this metadata). EGMS Ortho simplifies interpretation for non-expert users by removing the need to account for satellite viewing geometry, offering a more intuitive representation of ground motion. EGMS Ortho is visualised as a vector map of measurement points colour-coded by average velocity (vertical or east-west components) and distributed to users in comma-separated values format. Each point is associated with a time series of displacement, i.e. a plot with values of displacement per acquisition of the satellite. EGMS Ortho is delivered to users on an annual basis, following a five-year moving window update strategy. This means that after the Baseline/first update (2016-2021), the following data periods are available: 2018-2022, 2019-2023 and 2020-2024.
-
The Sentinel-2 Snow Phenology (SP S2) product is generated once a year at European scale, based on Fractional Snow Cover (FSC) products calculated from Sentinel-2 optical data. This product describes the snow season in terms of temporality as it provides, within an hydrological year and for each pixel, the number of days with snow cover, as well as the first and the last day of the longest observed snow period. It has a spatial resolution of 100 m x 100 m. Each product is composed of separate files corresponding to the different layers of the product, and another metadata file." The product is also available in another projection as tiles aligned with Sentinel-2 (UTM/WGS84) at 20 m x 20 m. SP S2 is one of the products of the pan-European High-Resolution Water Snow & Ice portfolio (HR-WSI), which are provided at high spatial resolution from the Sentinel-2 and Sentinel-1 constellations data from September 1, 2016 onwards.
-
The Share of Built-Up Change (SBUC) 2021-2024 layer is part of the High Resolution Layer (HRL) Imperviousness and contains the change of built-up per pixel (increase or decrease in percentage) as derived from the difference between the Impervious Built-Up (IBU) status layers for the reference years 2021 and 2024, in an aggregated version of 100m spatial resolution. The production of the HRL Imperviousness is coordinated by EEA in the frame of Copernicus, the Earth observation component of the European Union’s Space programme. The product is a raster dataset with 100-meter grid spacing (spatial resolution) that covers the 38 Eionet member and cooperating countries as well as the United Kingdom (i.e. EEA38+UK). It is distributed as 100 x 100 km tiles that are fully conformant with the EEA reference grid.
-

The Share of Built-Up (SBU) 2024 is part of the High Resolution Layer (HRL) Imperviousness and contains the share (percentage) of built-up per pixel for the reference year 2024 as derived from a pixel aggregation of the binary Impervious Built-Up (IBU) 2024 layer. The production of the HRL Imperviousness is coordinated by EEA in the frame of Copernicus, the Earth observation component of the European Union’s Space programme. The product is a raster dataset with 100-meter grid spacing (spatial resolution) that covers the 38 Eionet member and cooperating countries as well as the United Kingdom (i.e. EEA38+UK). It is distributed as 100 x 100 km tiles that are fully conformant with the EEA reference grid.
-
The Share of Built-Up Change Classified (SBCC) 2021-2024 layer is part of the High Resolution Layer (HRL) Imperviousness and provides categorical information on the change of built-up per pixel between the reference years 2021 and 2024 as derived from a re-classification of the Share of Built-Up Change (IMDC) 2024–2021 layer. The production of the HRL Imperviousness is coordinated by EEA in the frame of Copernicus, the Earth observation component of the European Union’s Space programme. The product is a raster dataset with 100-meter grid spacing (spatial resolution) that covers the 38 Eionet member and cooperating countries as well as the United Kingdom (i.e. EEA38+UK). It is distributed as 100 x 100 km tiles that are fully conformant with the EEA reference grid.
-

The Share of Built-Up Change Classified (SBCC) 2018-2021 layer is part of the High Resolution Layer (HRL) Imperviousness and provides categorical information on the change of built-up per pixel between the reference years 2018 and 2021 as derived from a re-classification of the Share of Built-Up Change (IMDC) 2021–2018 layer. The production of the HRL Imperviousness is coordinated by EEA in the frame of Copernicus, the Earth observation component of the European Union’s Space programme. The product is a raster dataset with 100-meter grid spacing (spatial resolution) that covers the 38 Eionet member and cooperating countries as well as the United Kingdom (i.e. EEA38+UK). It is distributed as 100 x 100 km tiles that are fully conformant with the EEA reference grid.