 Arctic SDI catalogue
EEA38 (from 2020)
Type of resources
Available actions
Topics
Keywords
Contact for the resource
Provided by
Years
Formats
Scale
Resolution
-
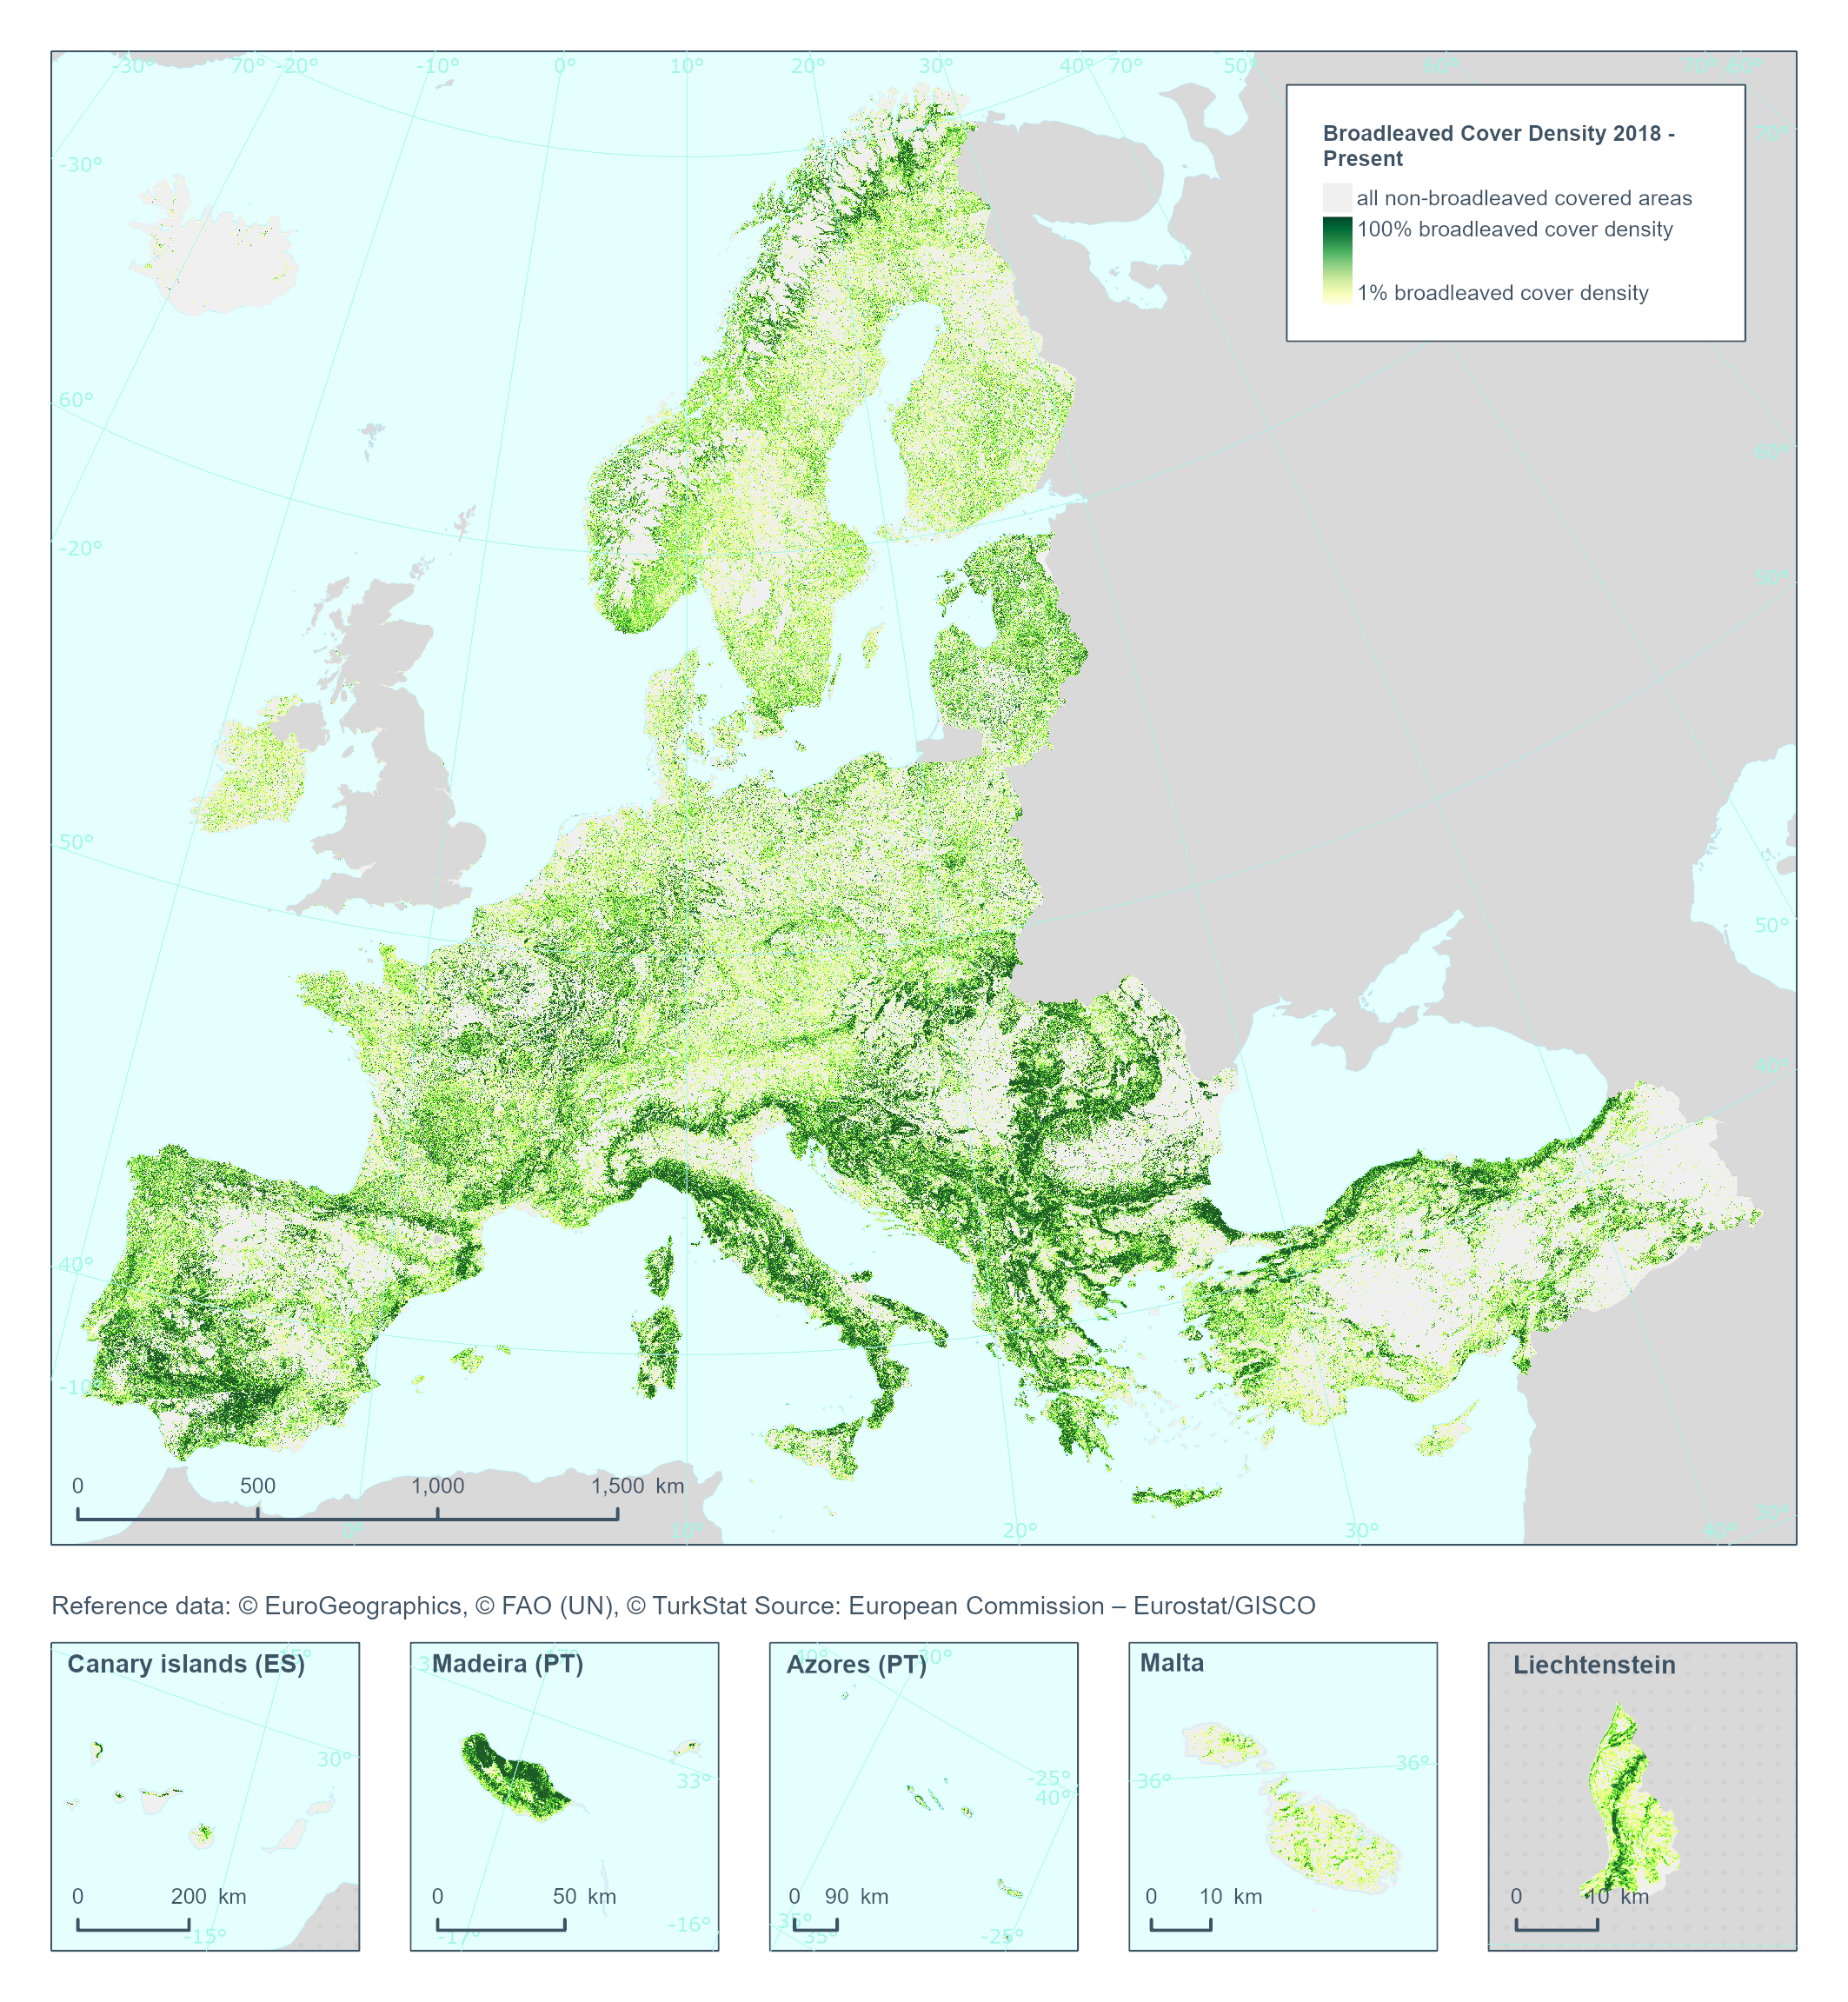
The High Resolution Layer Broadleaved Density (BCD) dataset provides information on the percentage of broadleaved pixels at 100m spatial resolution, and is derived through aggregation of the 10m DLT for the respective reference year. Within each cell the number of broadleaved pixels are counted and the percentages stored into in the 100m pixel of the BCD. The class 255 = outside area is predefined by the 100m boundary layer and remains unchanged. This dataset is provided annually starting with 2018 in 100 meter rasters (fully conformant with the EEA reference grid) in 100 x 100 km tiles covering the EEA38 countries. High Resolution Layer Tree Cover and Forest product is part of the European Union’s Copernicus Land Monitoring Service. This dataset includes data from the French Overseas Territories (DOMs)
-
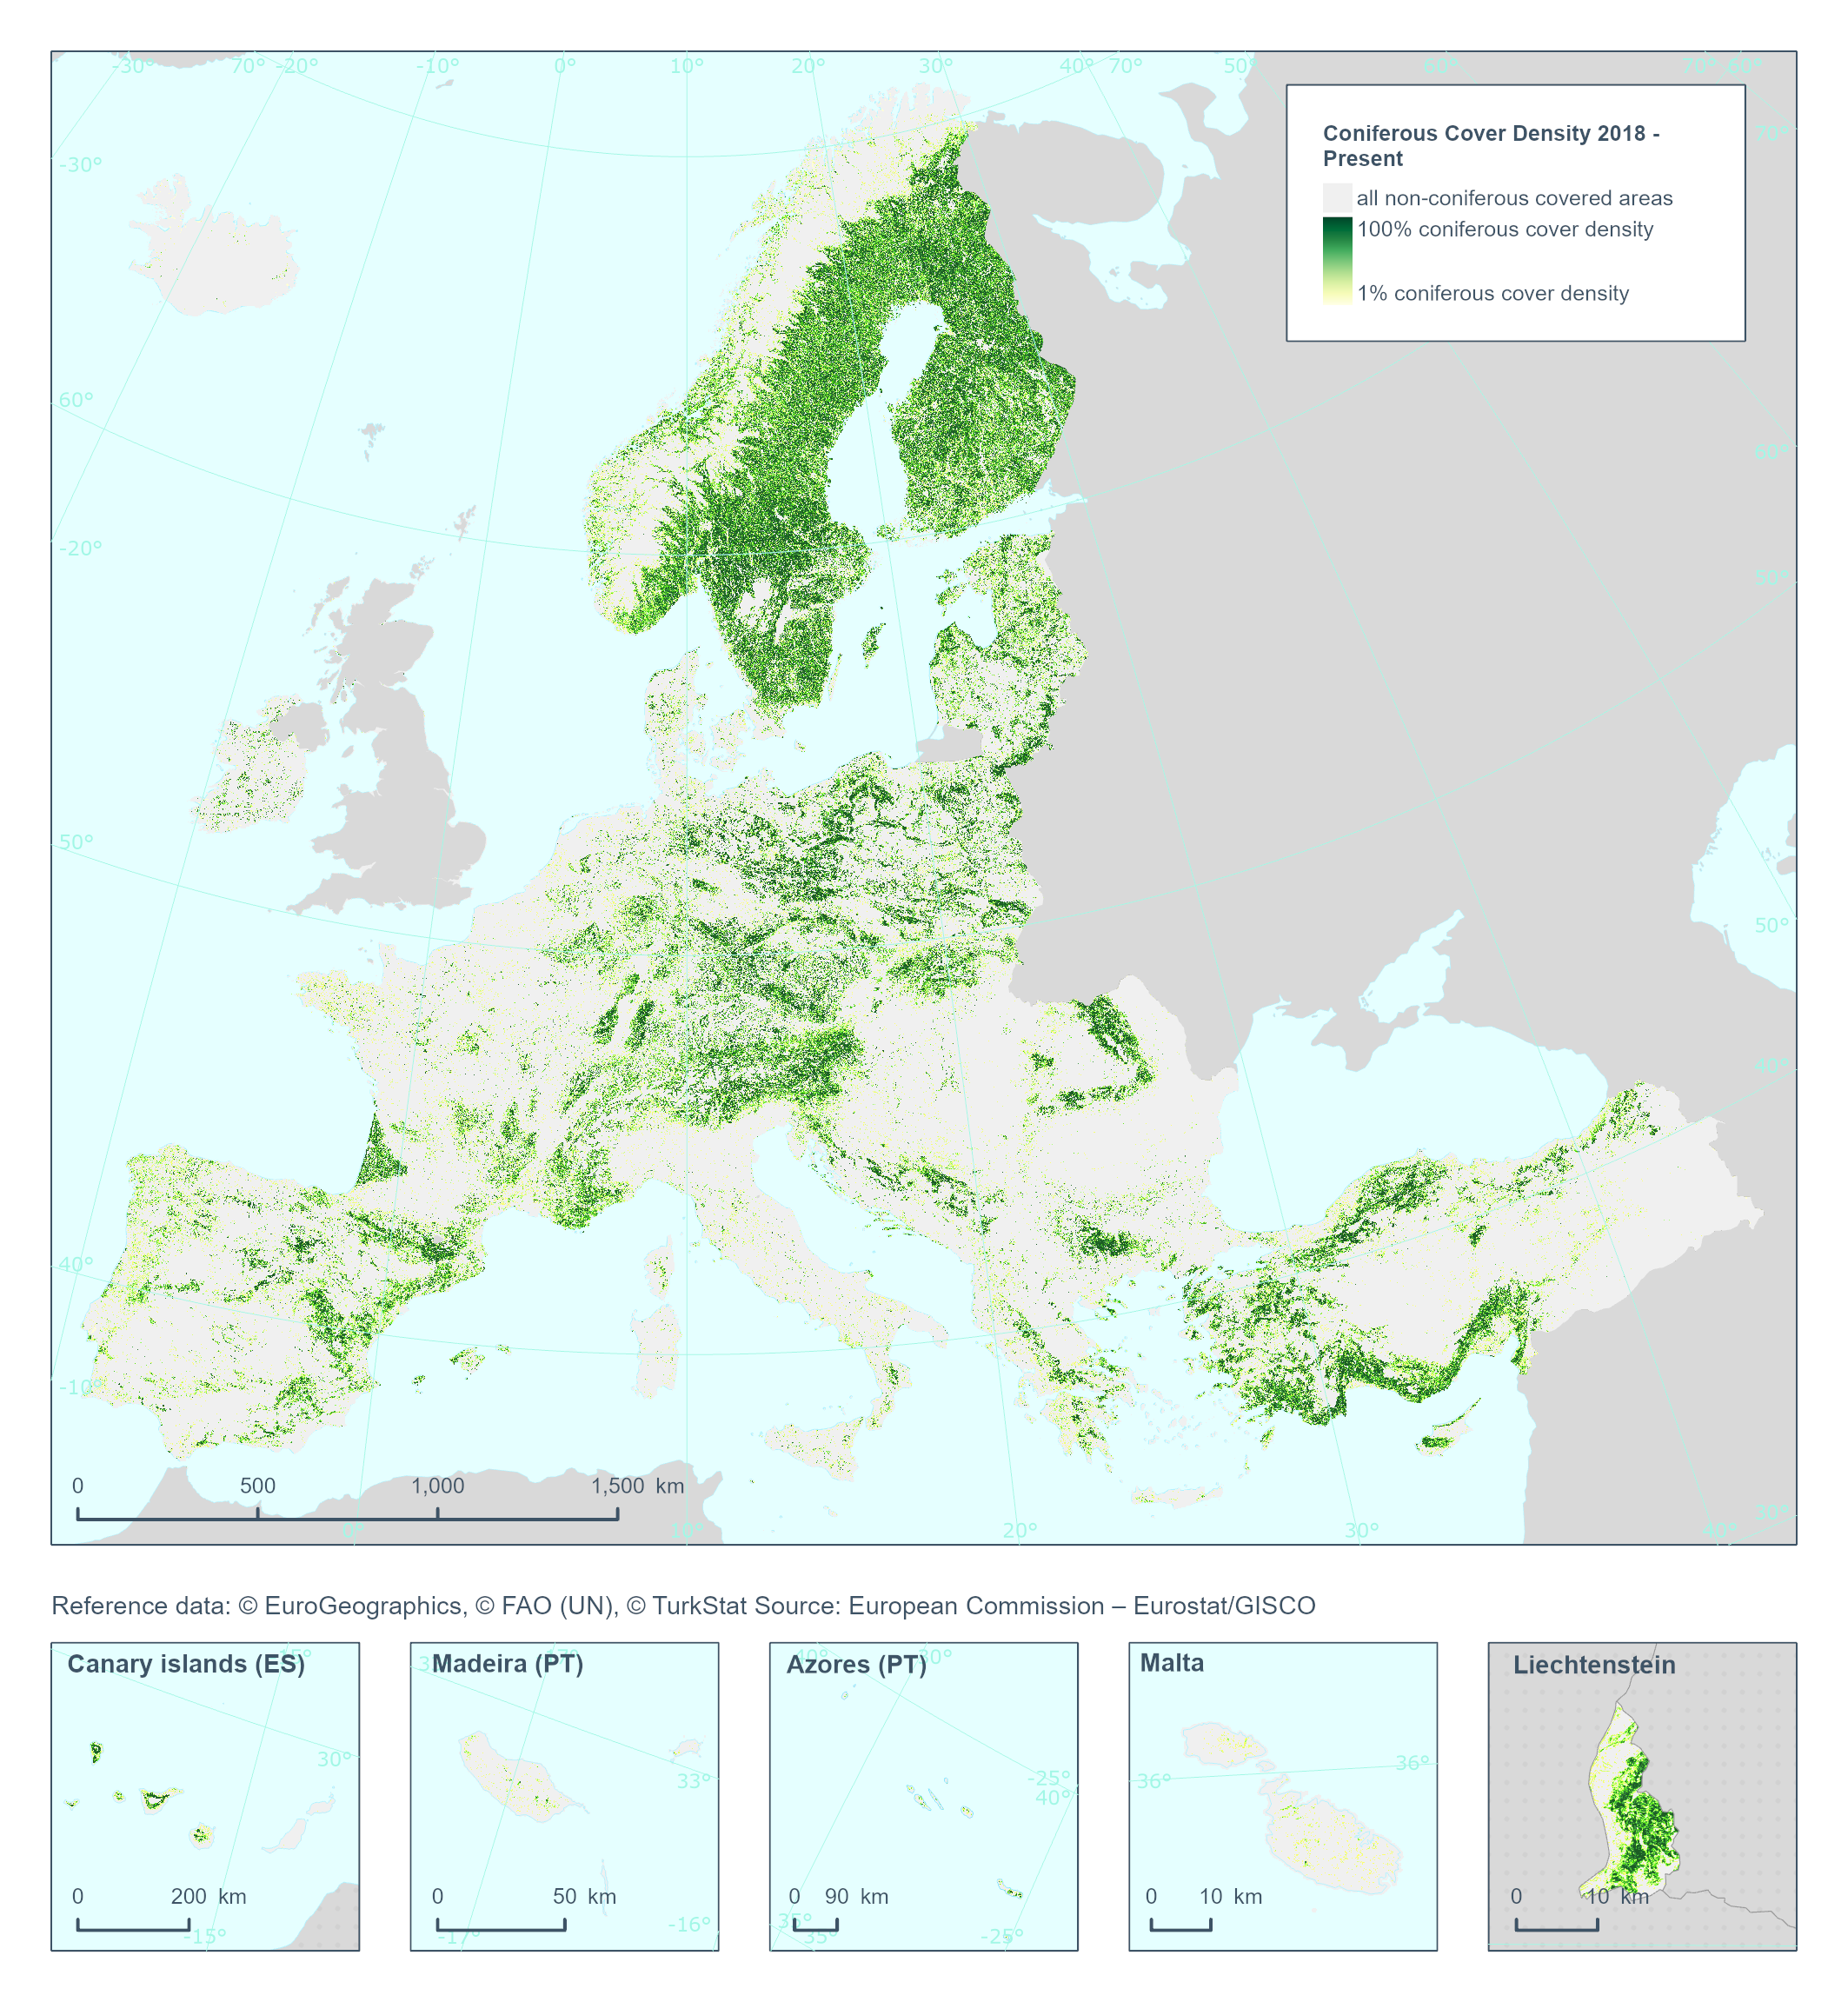
The High Resolution Layer Coniferous Cover Density (CCD) dataset provides information on the percentage of coniferous pixels at 100m spatial resolution, and is derived through aggregation of the 10m DLT for the respective reference year. Within each cell the number of broadleaved pixels are counted and the percentages stored into in the 100m pixel of the BCD. The class 255 = outside area is predefined by the 100m boundary layer and remains unchanged. This dataset is provided annually starting with 2018 in 100 meter rasters (fully conformant with the EEA reference grid) in 100 x 100 km tiles covering the EEA38 countries. High Resolution Layer Tree Cover and Forest product is part of the European Union’s Copernicus Land Monitoring Service. This dataset includes data from the French Overseas Territories (DOMs)
-
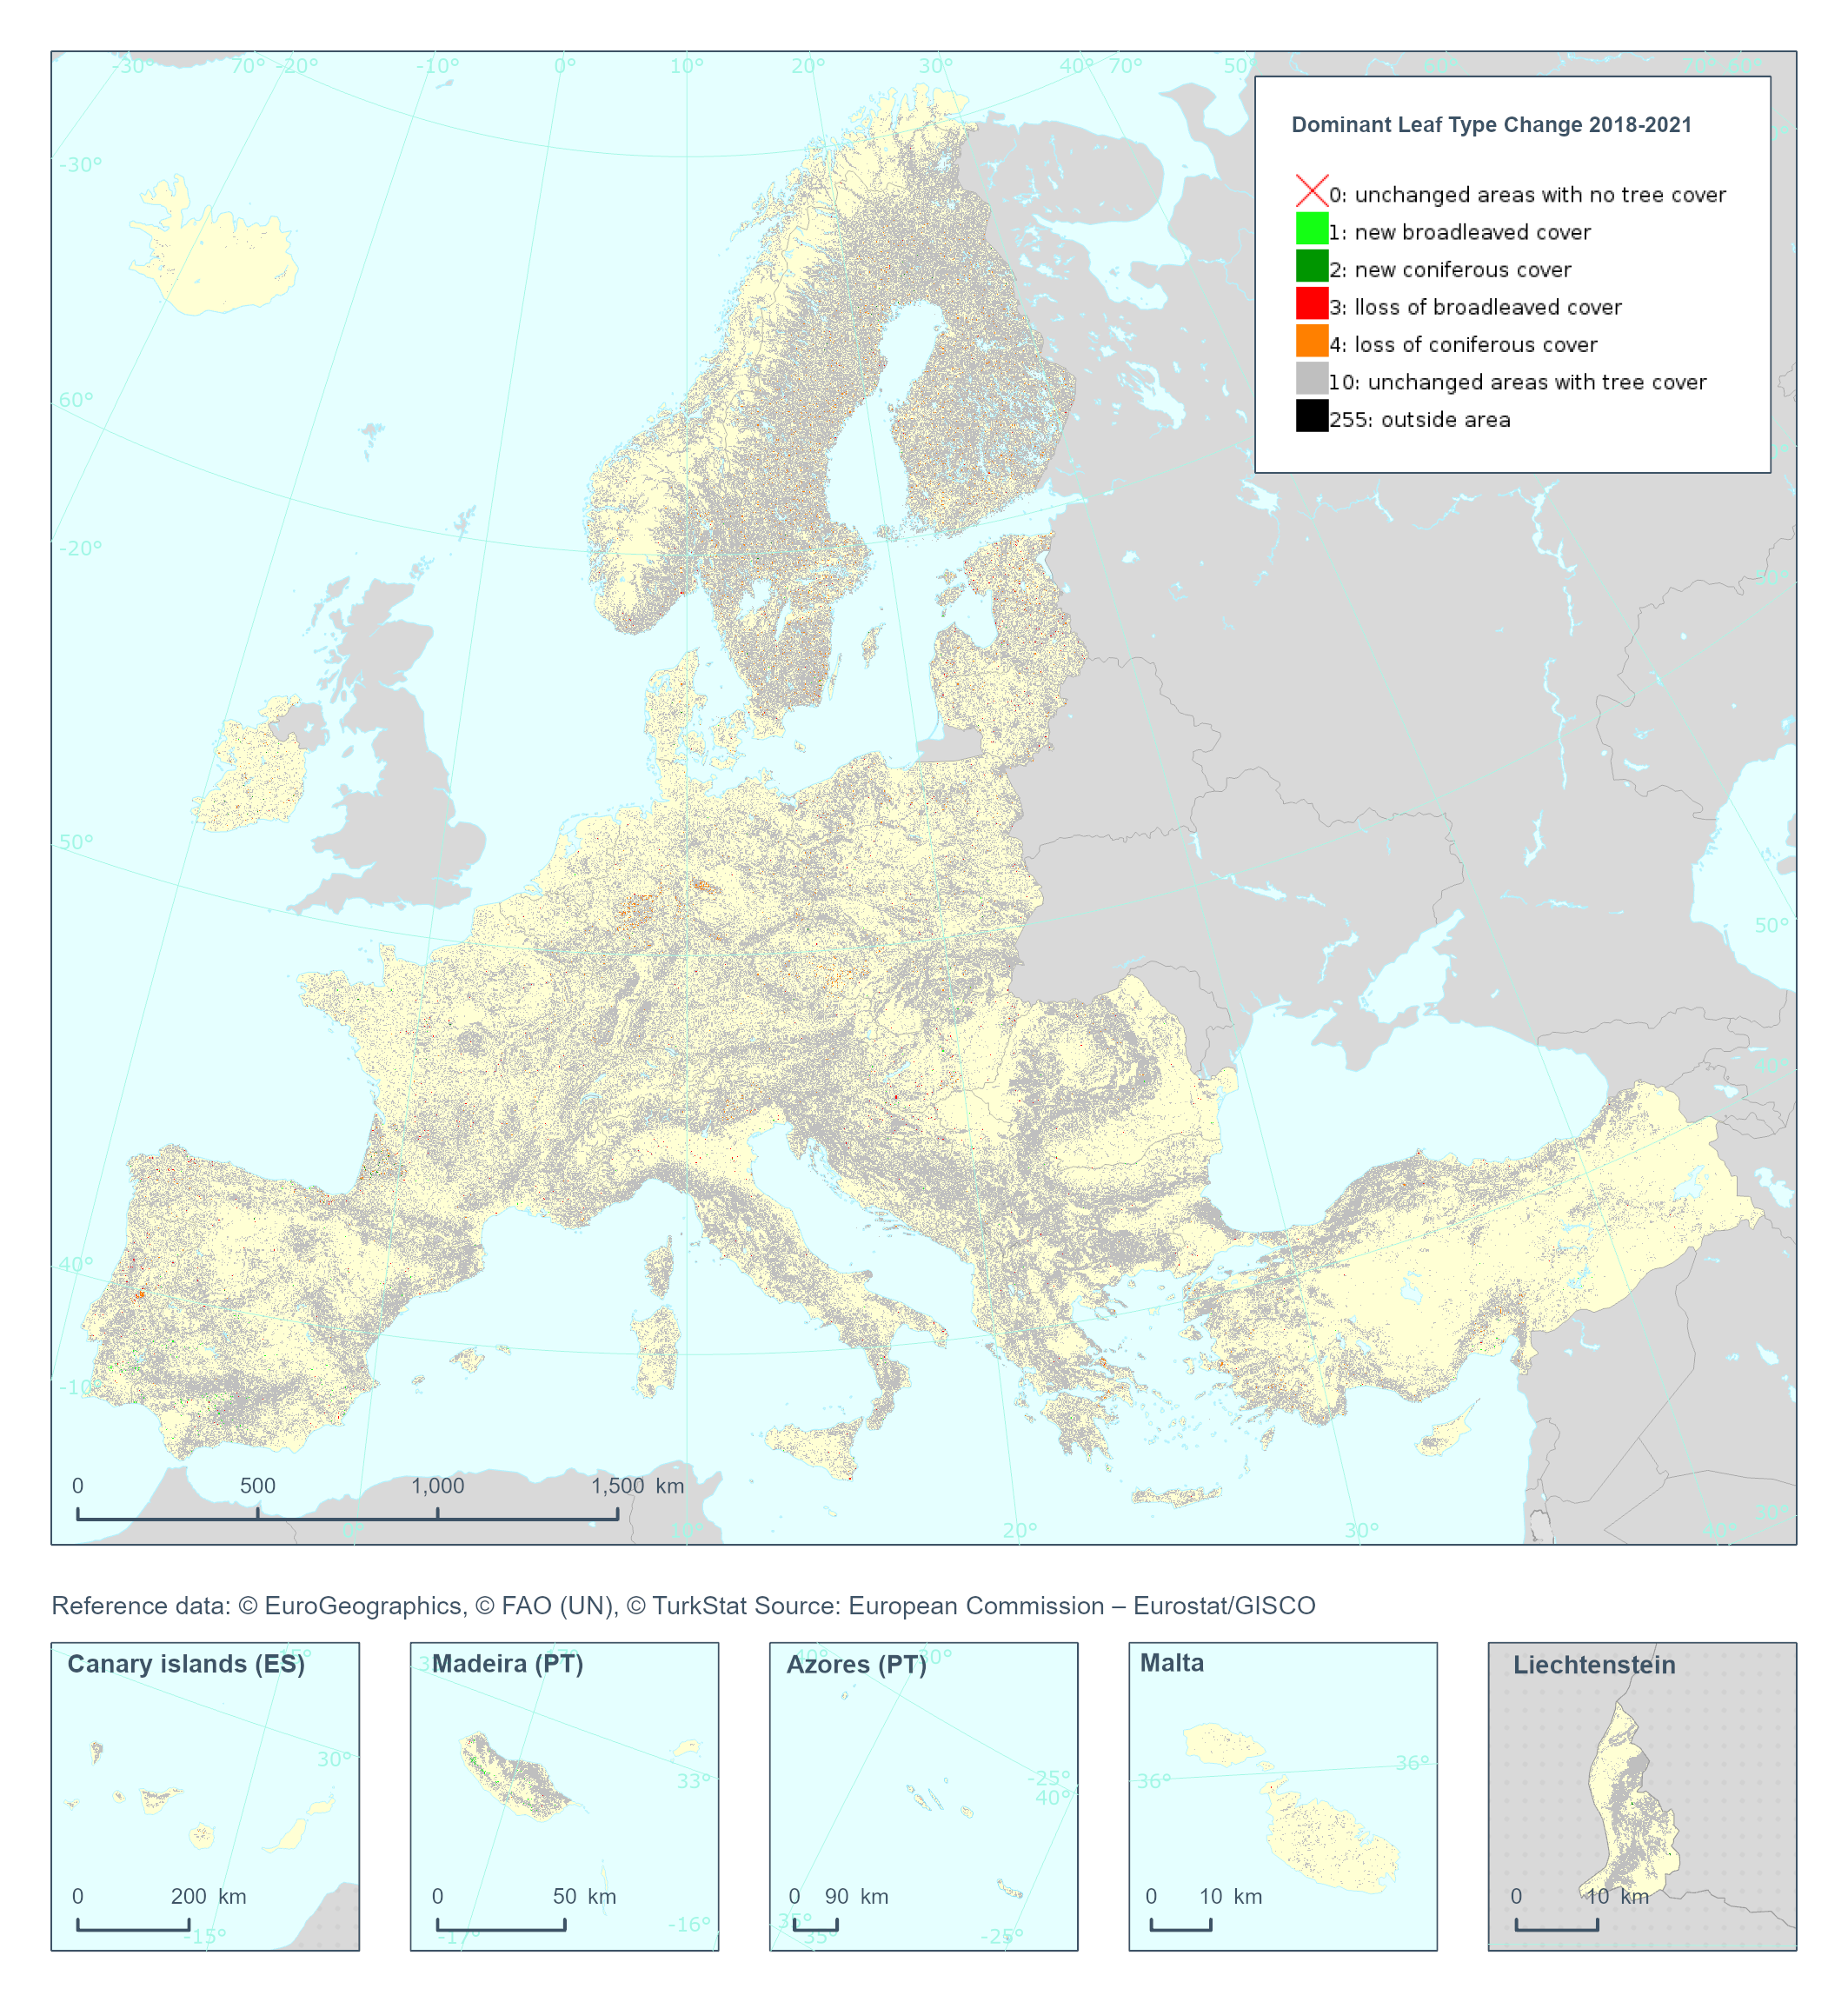
The High Resolution Layer Dominant Leaf Type Change (DLTC) 2018-2021 raster product provides information on the change between the reference years 2018 and 2021 and consists of 7 thematic classes (unchanged areas with no tree cover / new broadleaved cover / new coniferous cover / loss of broadleaved cover / loss of coniferous cover / unchanged areas with tree cover / potential change among dominant leaf types). This dataset is provided in 20 meter rasters (fully conformant with the EEA reference grid) in 100 x 100 km tiles covering the EEA38 countries. The production of the high resolution forest layers was coordinated by the European Environment Agency (EEA) in the frame of the EU Copernicus programme. This dataset includes data from the French Overseas Territories (DOMs)
-
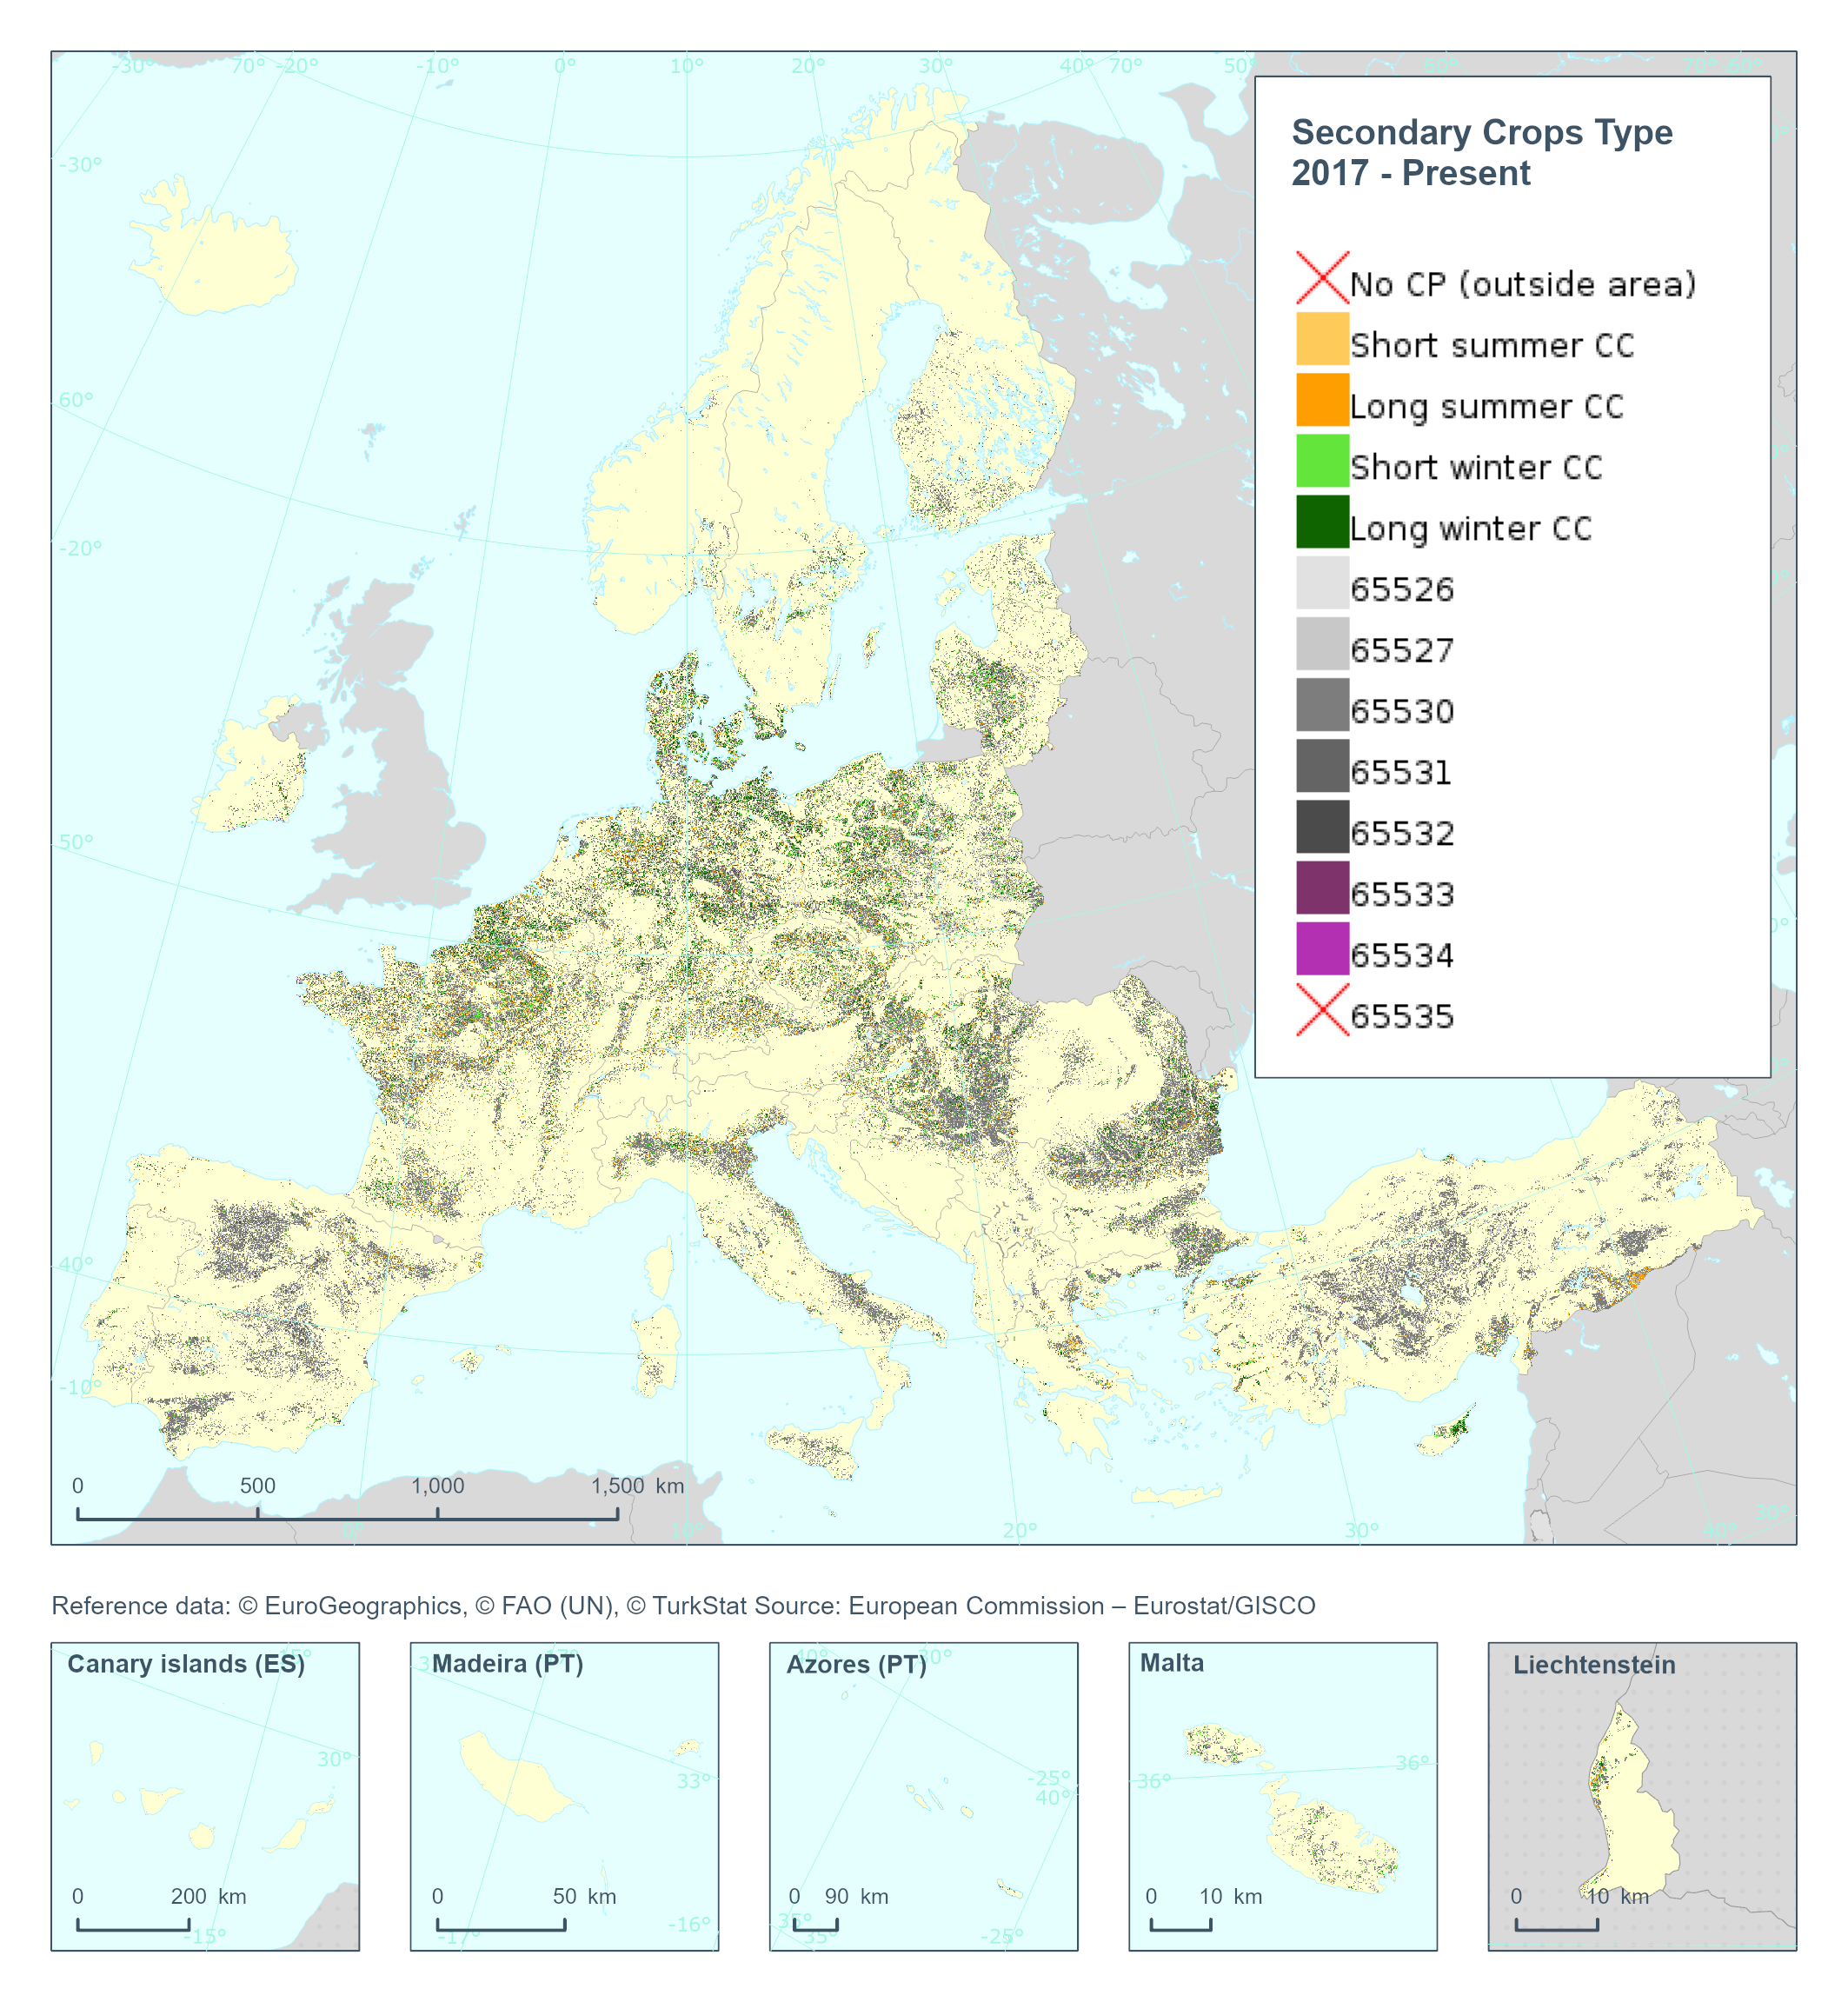
The High Resolution Layer Cropping Patterns - Secondary Crop Type (CPSCT) raster product indicates if a cover crop was present within the respective calendar year and further segregates the types of cover crop into: short summer, long summer, short winter and long winter cover crop. This dataset is provided annually starting in 2017 with 10 meter rasters (fully conformant with the EEA reference grid) in 100 x 100 km tiles covering the EEA38 countries. High Resolution Layer Croplands product is part of the European Union’s Copernicus Land Monitoring Service. Confidence layer available for the dataset. This dataset includes data from the French Overseas Territories (DOMs)
-
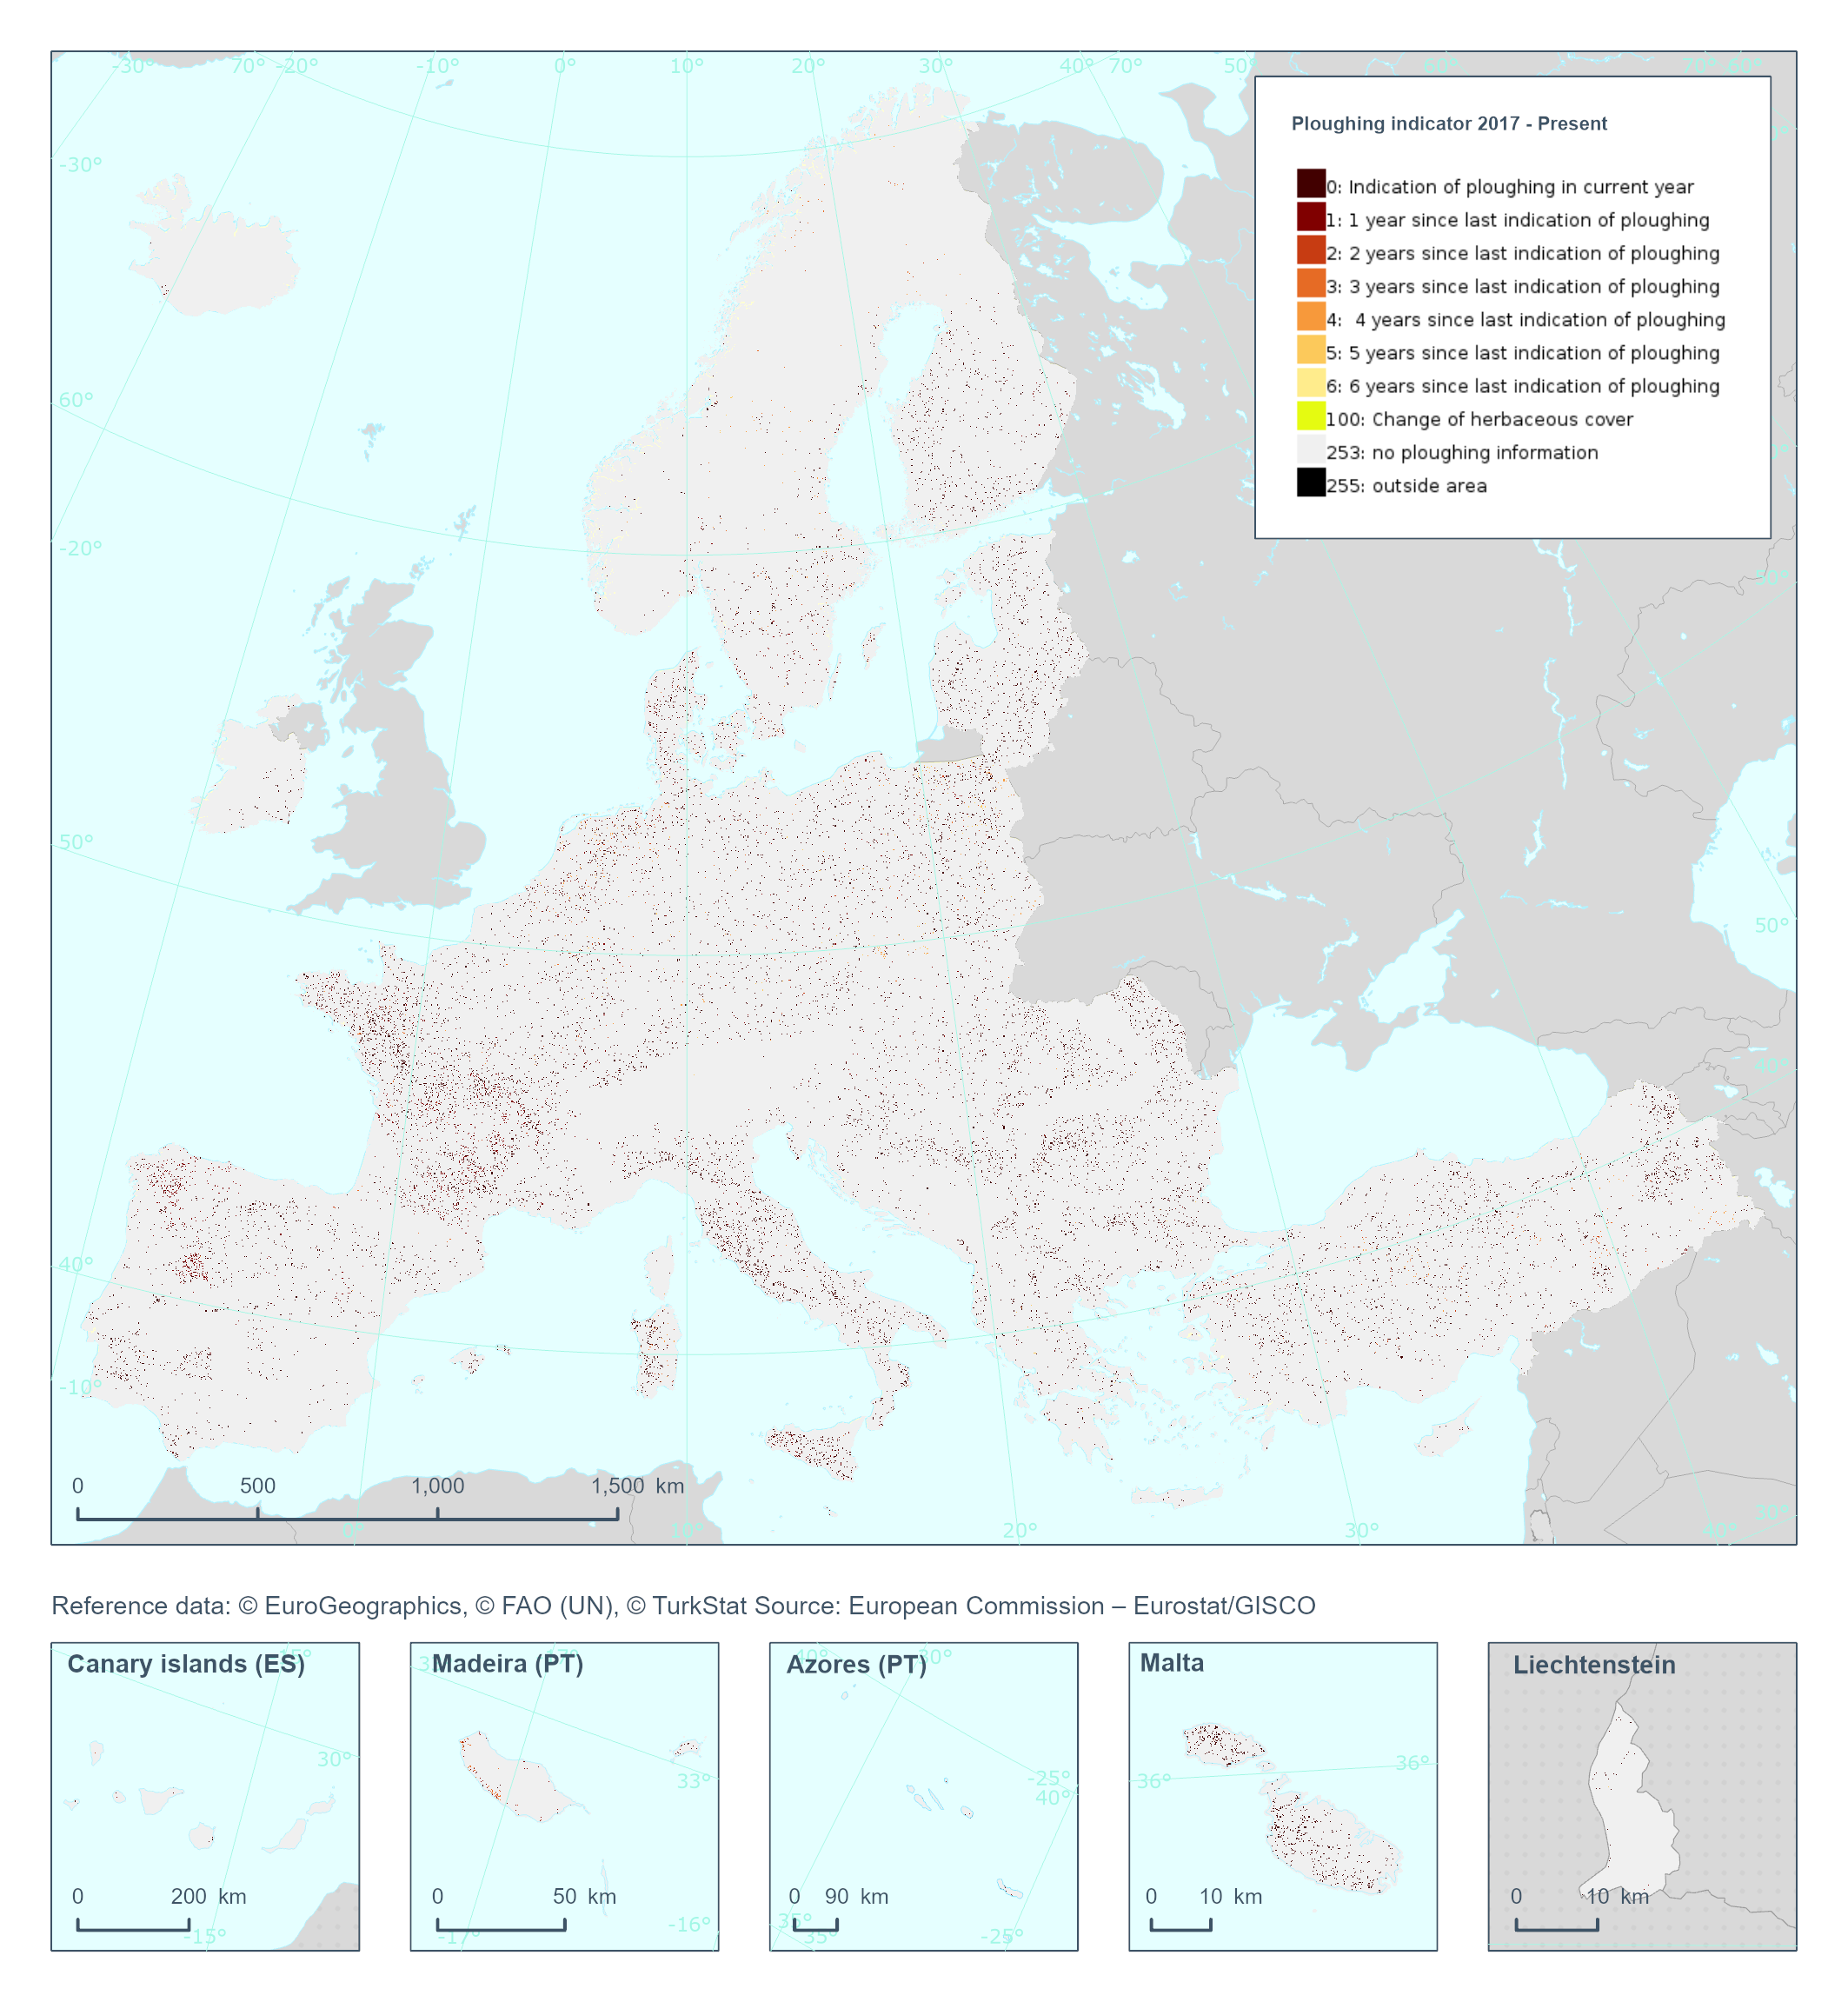
The High Resolution Layer Ploughing indicator (PLOUGH) raster product continues the 2015 and 2018 PLOUGH Layer following a rolling archive principle by adding current information and removing historic years. It indicates the number of years since the last indication of ploughing within the permanent grassland area. PLOUGH is derived by taking into account the series of binary HER layers, the BVL classifications and HR VPP PPI (Plant Phenology Index) quantiles. BVL classes 4 (crop) and 7 (overlaying layer between herbaceous and crop) indicate a ploughing event. Low HR VPP PPI quantiles indicate low vegetation at a certain time of the year. For years with missing information (2016 and earlier) the ploughing information from the historic PLOUGH product is considered which causes some issues. This dataset is provided annually starting in 2017 with 10 meter rasters (fully conformant with the EEA reference grid) in 100 x 100 km tiles covering the EEA38 countries. High Resolution Layer Grasslands product is part of the European Union’s Copernicus Land Monitoring Service. This dataset includes data from the French Overseas Territories (DOMs)
-
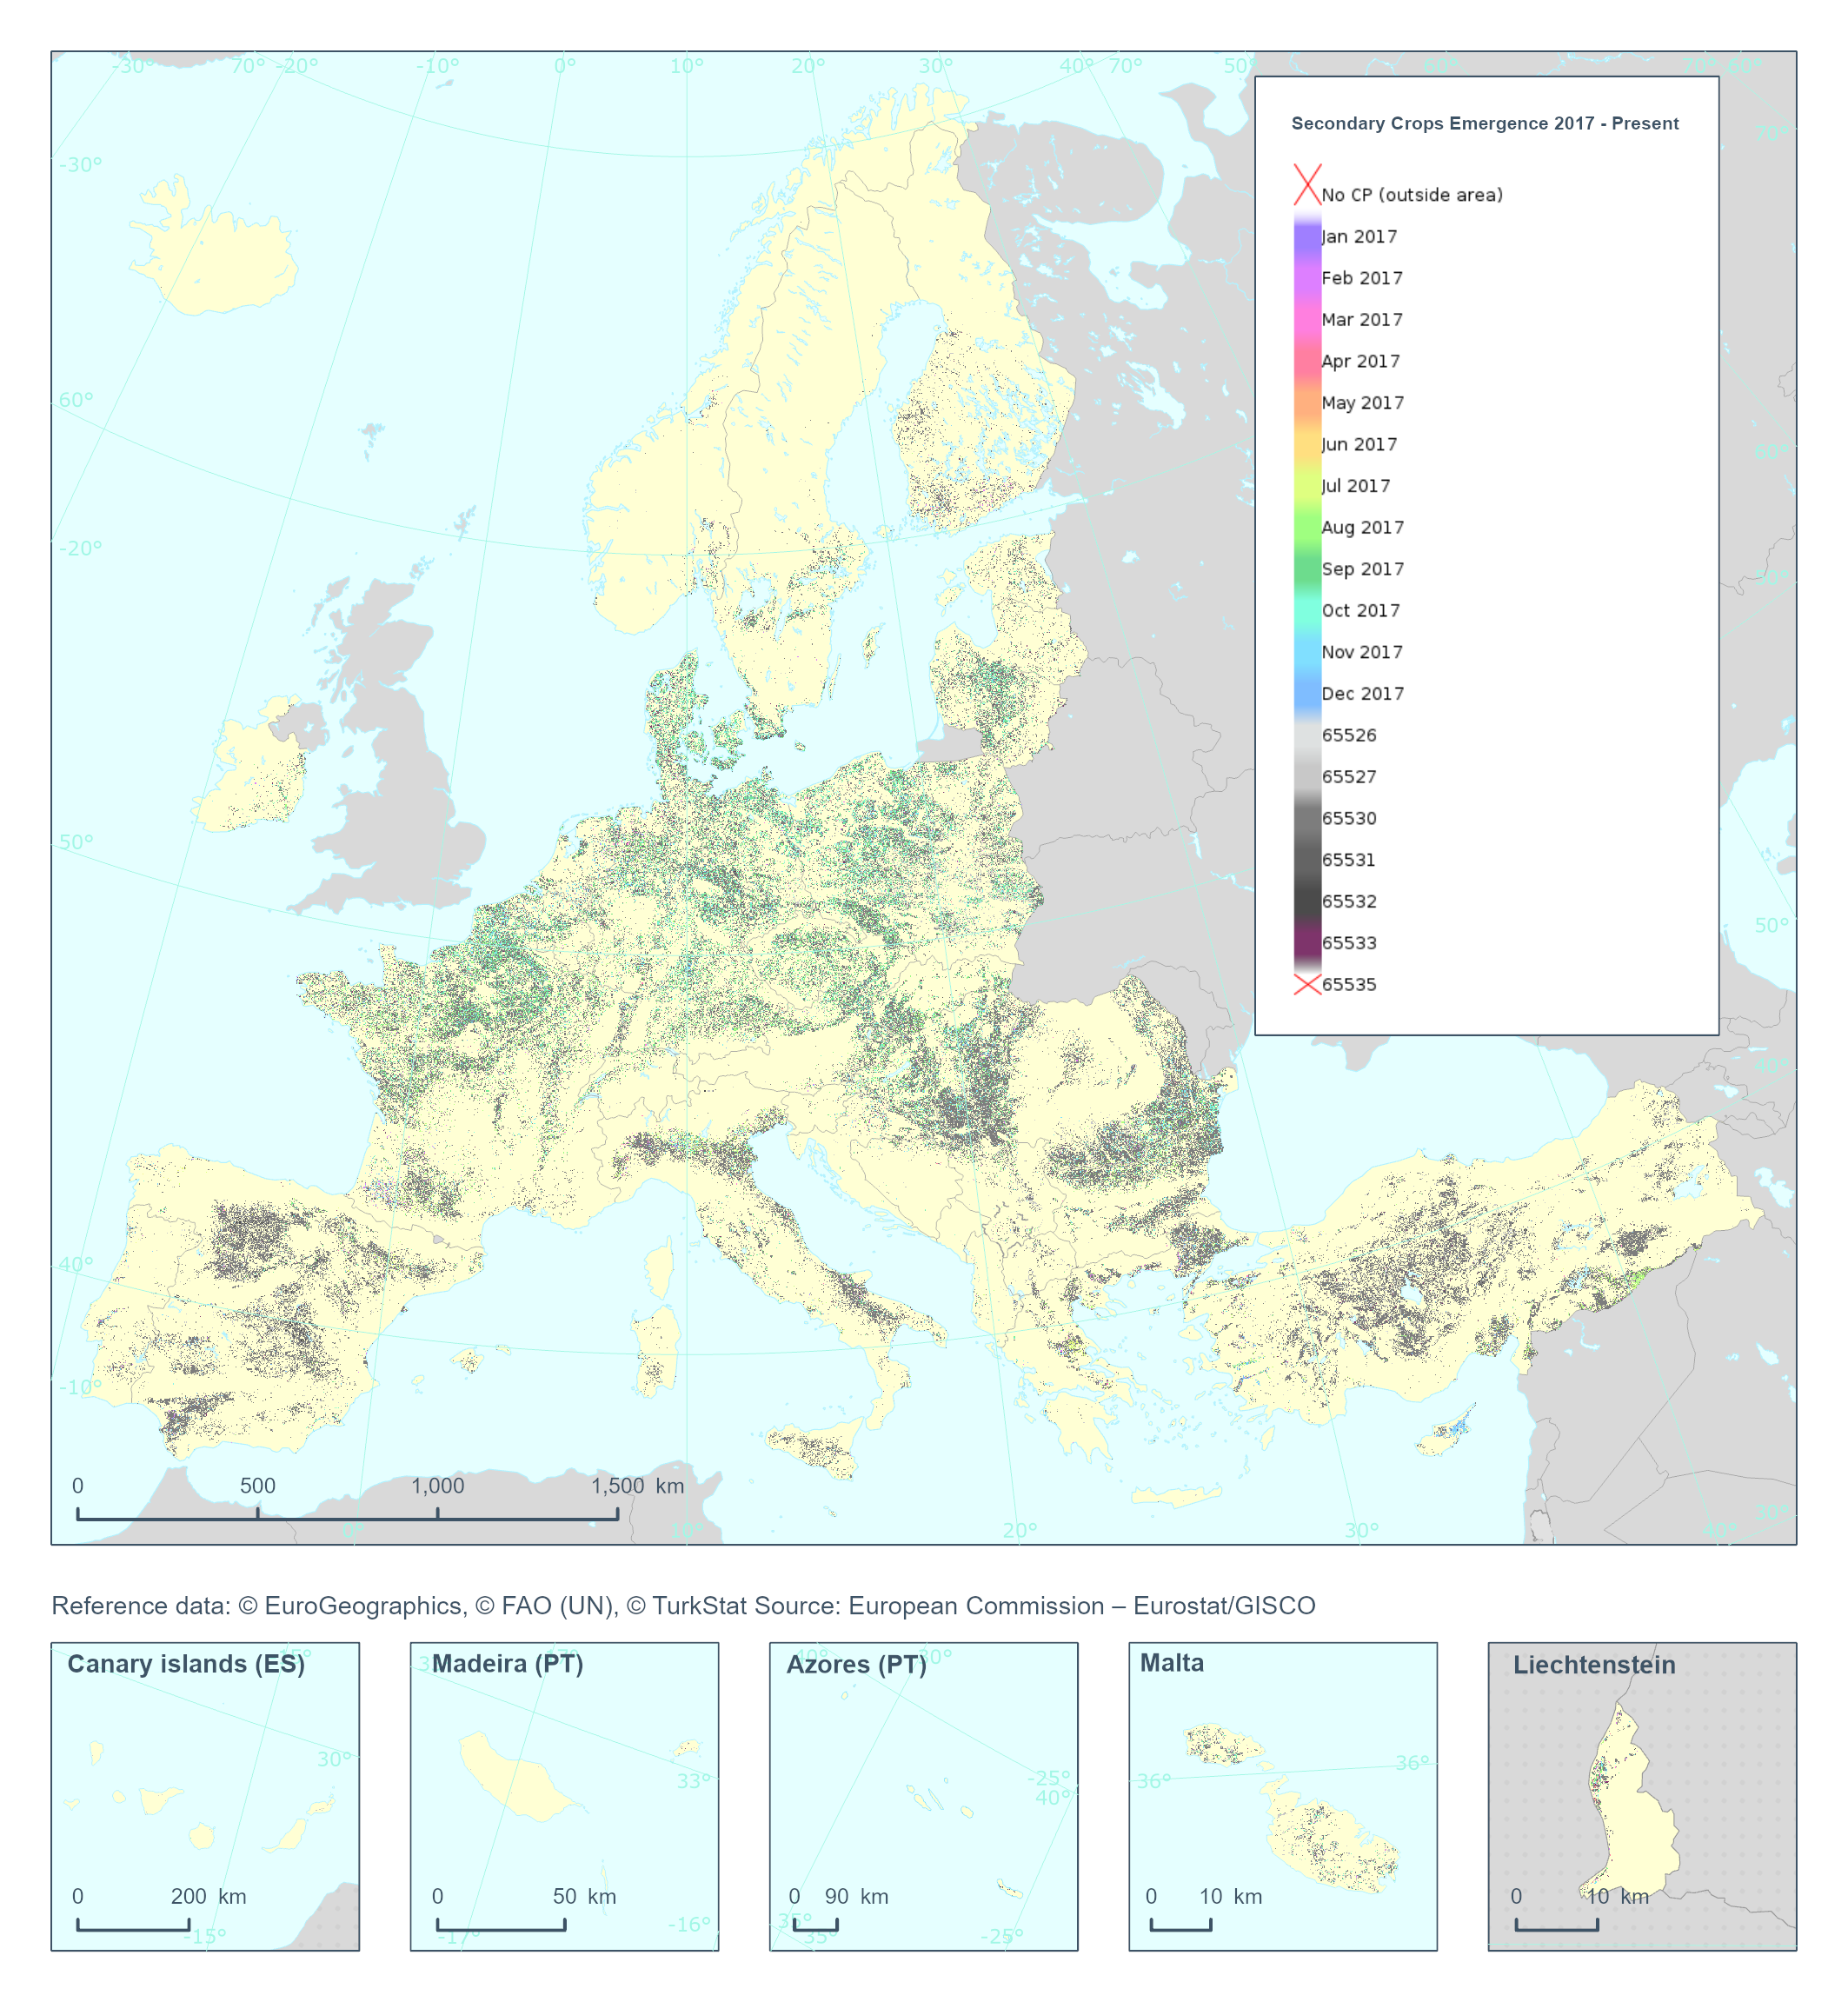
The High Resolution Layer Cropping Patterns - Secondary Crop Emergence (CPSCE) raster product provides the date of emergence of the cover crop in days of the year (DOY). YYDOY where YY = last 2 digits of the year (e.g. 19 for 2019) and DOY is the day of the year (1-365) This dataset is provided annually starting in 2017 with 10 meter rasters (fully conformant with the EEA reference grid) in 100 x 100 km tiles covering the EEA38 countries. High Resolution Layer Croplands product is part of the European Union’s Copernicus Land Monitoring Service. Confidence layer available for the dataset. This dataset includes data from the French Overseas Territories (DOMs)
-
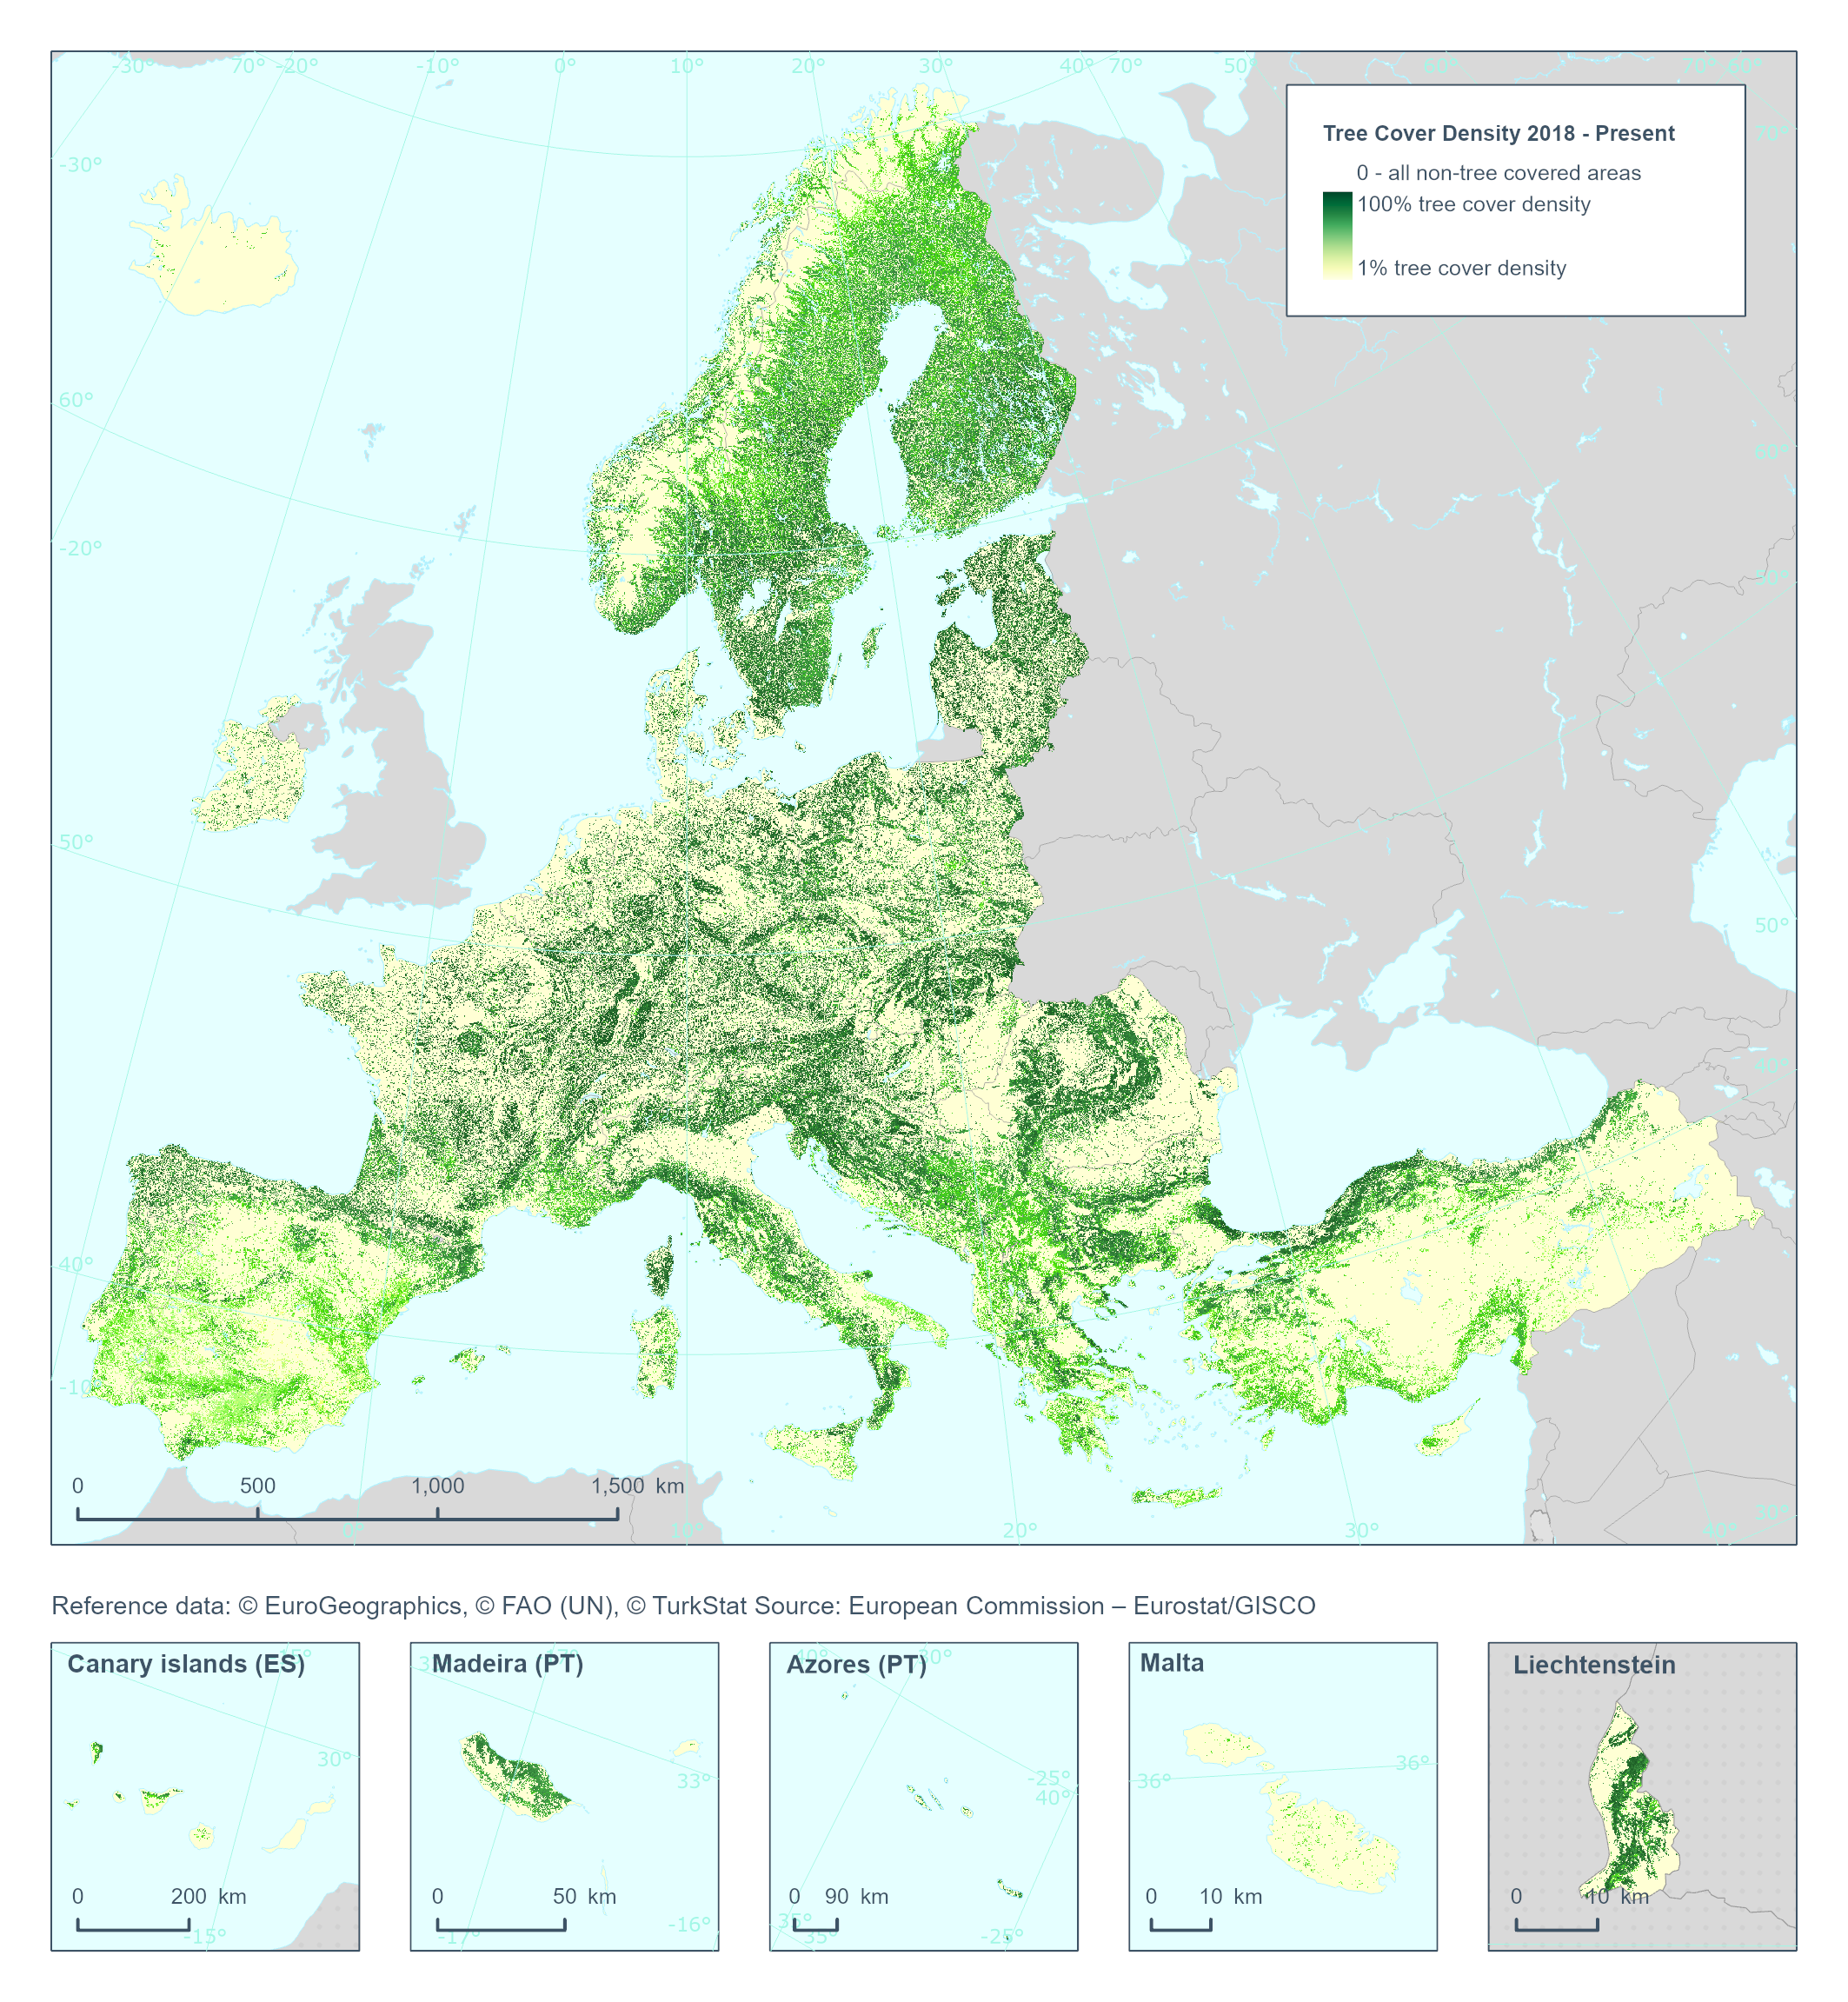
The High Resolution Layer Tree Cover Density (TCD) dataset provides information on the proportional crown coverage per pixel at 10 meter spatial resolution and ranges from 0% (all non-tree covered areas) to 100%, whereby Tree Cover Density is defined as the "vertical projection of tree crowns to a horizontal earth’s surface“. This dataset is provided annually starting with 2018 in 10 meter rasters (fully conformant with the EEA reference grid) in 100 x 100 km tiles covering the EEA38 countries. High Resolution Layer Tree Cover and Forest product is part of the European Union’s Copernicus Land Monitoring Service. Confidence layer available for the dataset. This dataset includes data from the French Overseas Territories (DOMs).
-
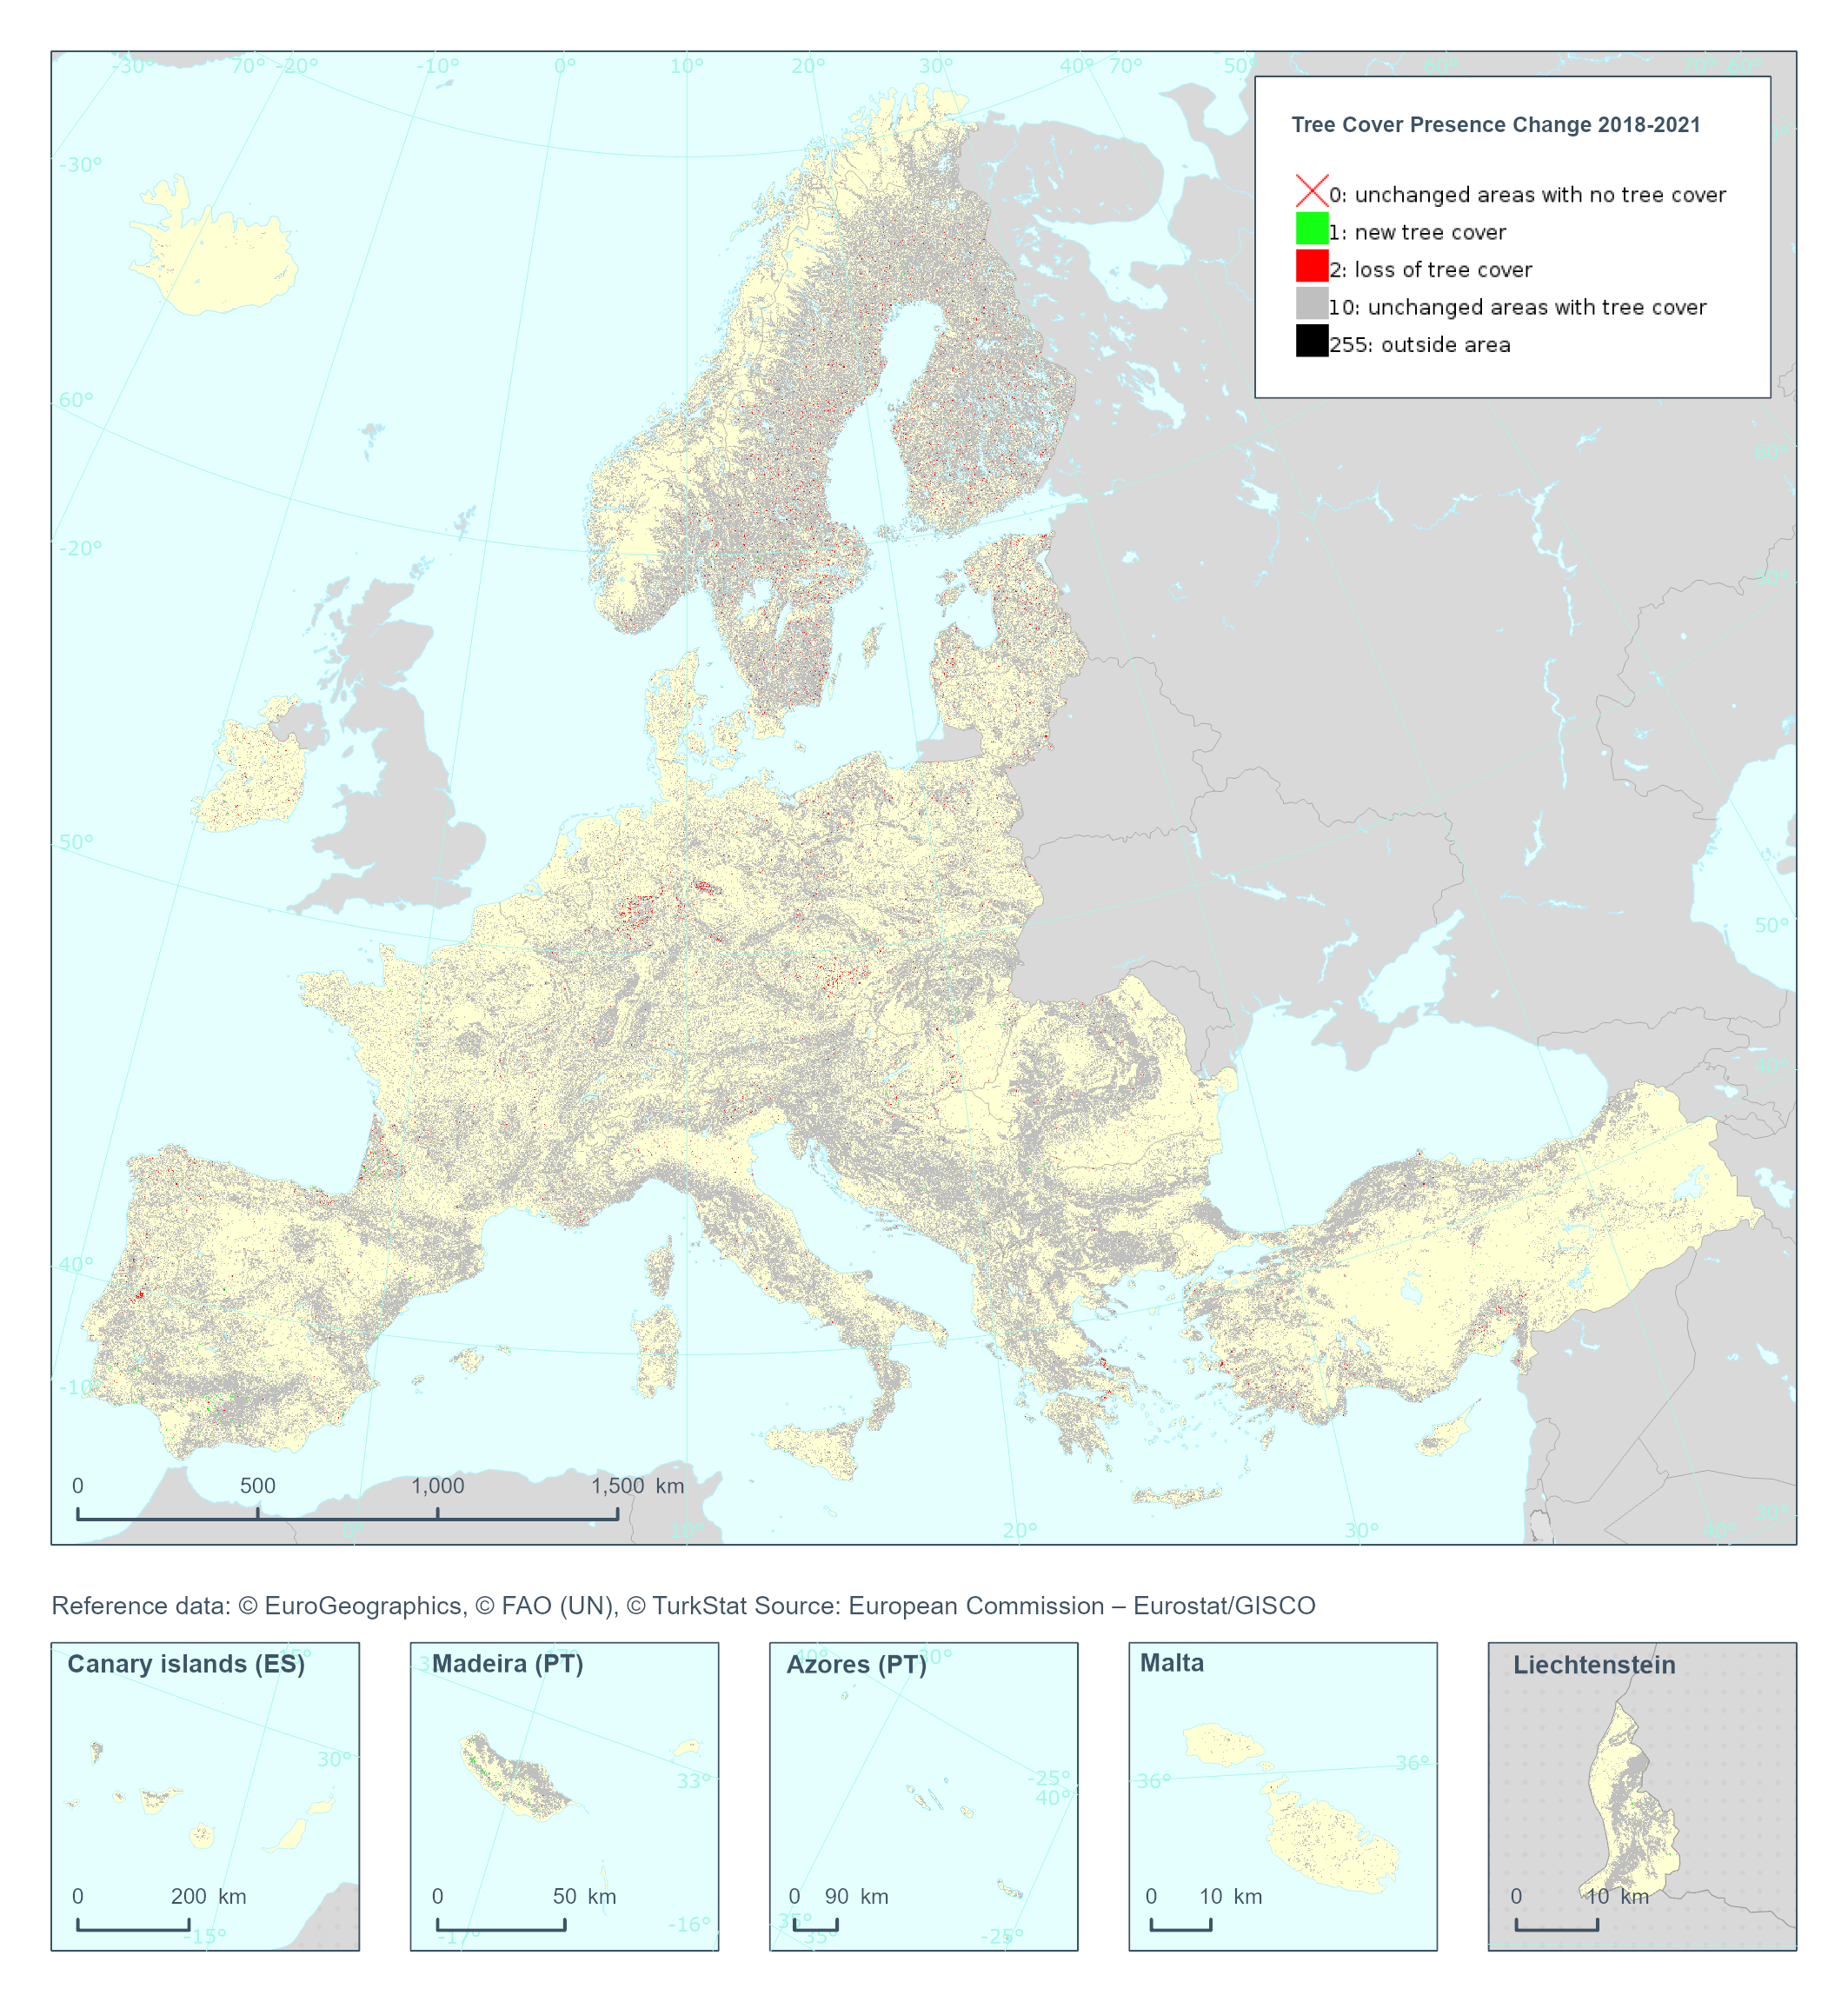
The Copernicus High Resolution Layer Tree Cover Precense Change (TCPC) 2018-2021 raster product provides information on the change between the reference years 2018 and 2021 and consists of 4 thematic classes (unchanged areas with no tree cover / new tree cover / loss of tree cover / unchanged areas with tree cover). The class 255 = outside area is predefined by the 100m boundary layer and remains unchanged. This layer for previous reference year compraissions is called Tree Cover Change Mask (TCCM). This dataset is provided in 20 meter rasters (fully conformant with the EEA reference grid) in 100 x 100 km tiles covering the EEA38 countries. The production of the high resolution forest layers was coordinated by the European Environment Agency (EEA) in the frame of the EU Copernicus programme. Confidence layer available for the dataset. This dataset includes data from the French Overseas Territories (DOMs)
-
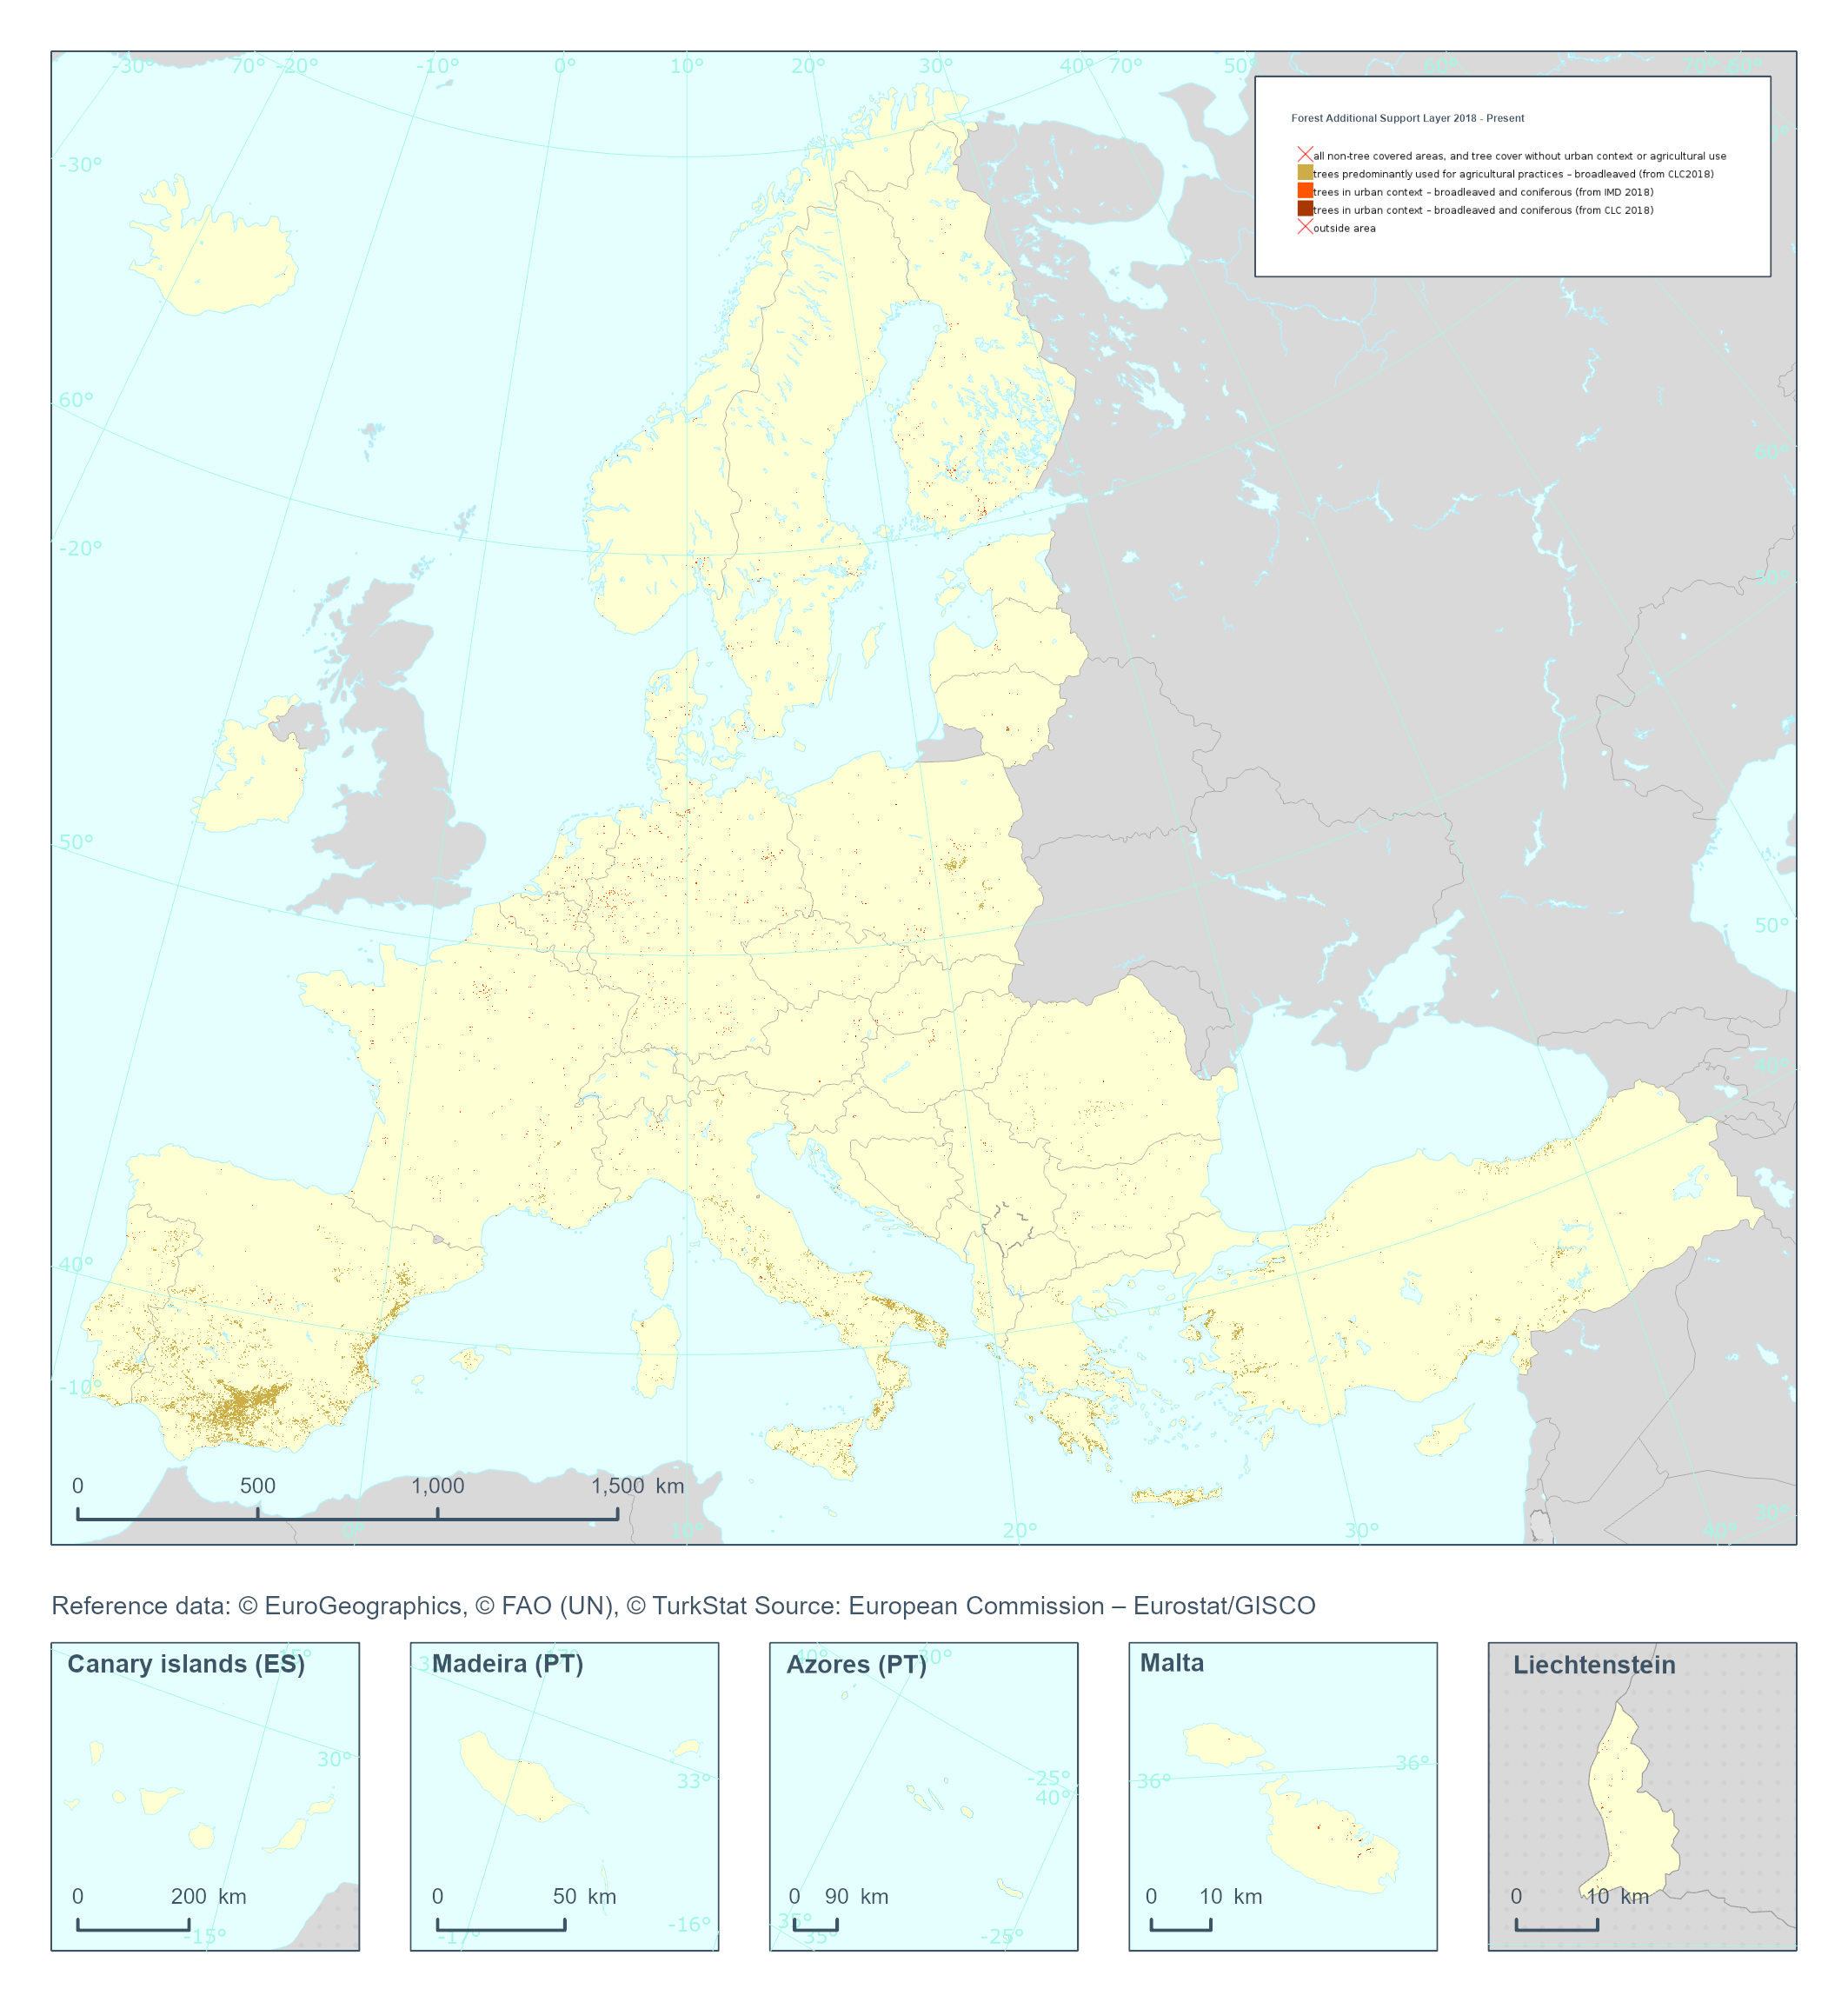
The High Resolution Layer Forest Additional Support Layer (FADSL) provides information on trees under agricultural use or in urban context to be excluded from the Forest Type (FTY) product and at 10m spatial resolution. The derivation of Forest Additional Support Layer (FADSL) is based on the spatial intersection of the 10m DLT and TCD layers with CORINE Land Cover (CLC) 2018 and HRL Imperviousness Degree 2018 with 10 m spatial resolution; TCD range of ≥ 10-100%; with a MMW of 10m and no MMU (pixel base). This dataset is provided on a 3-yearly frequency in 10 meter rasters (fully conformant with the EEA reference grid) in 100 x 100 km tiles covering the EEA38 countries. High Resolution Layer Tree Cover and Forest product is part of the European Union’s Copernicus Land Monitoring Service. This dataset includes data from the French Overseas Territories (DOMs)
-
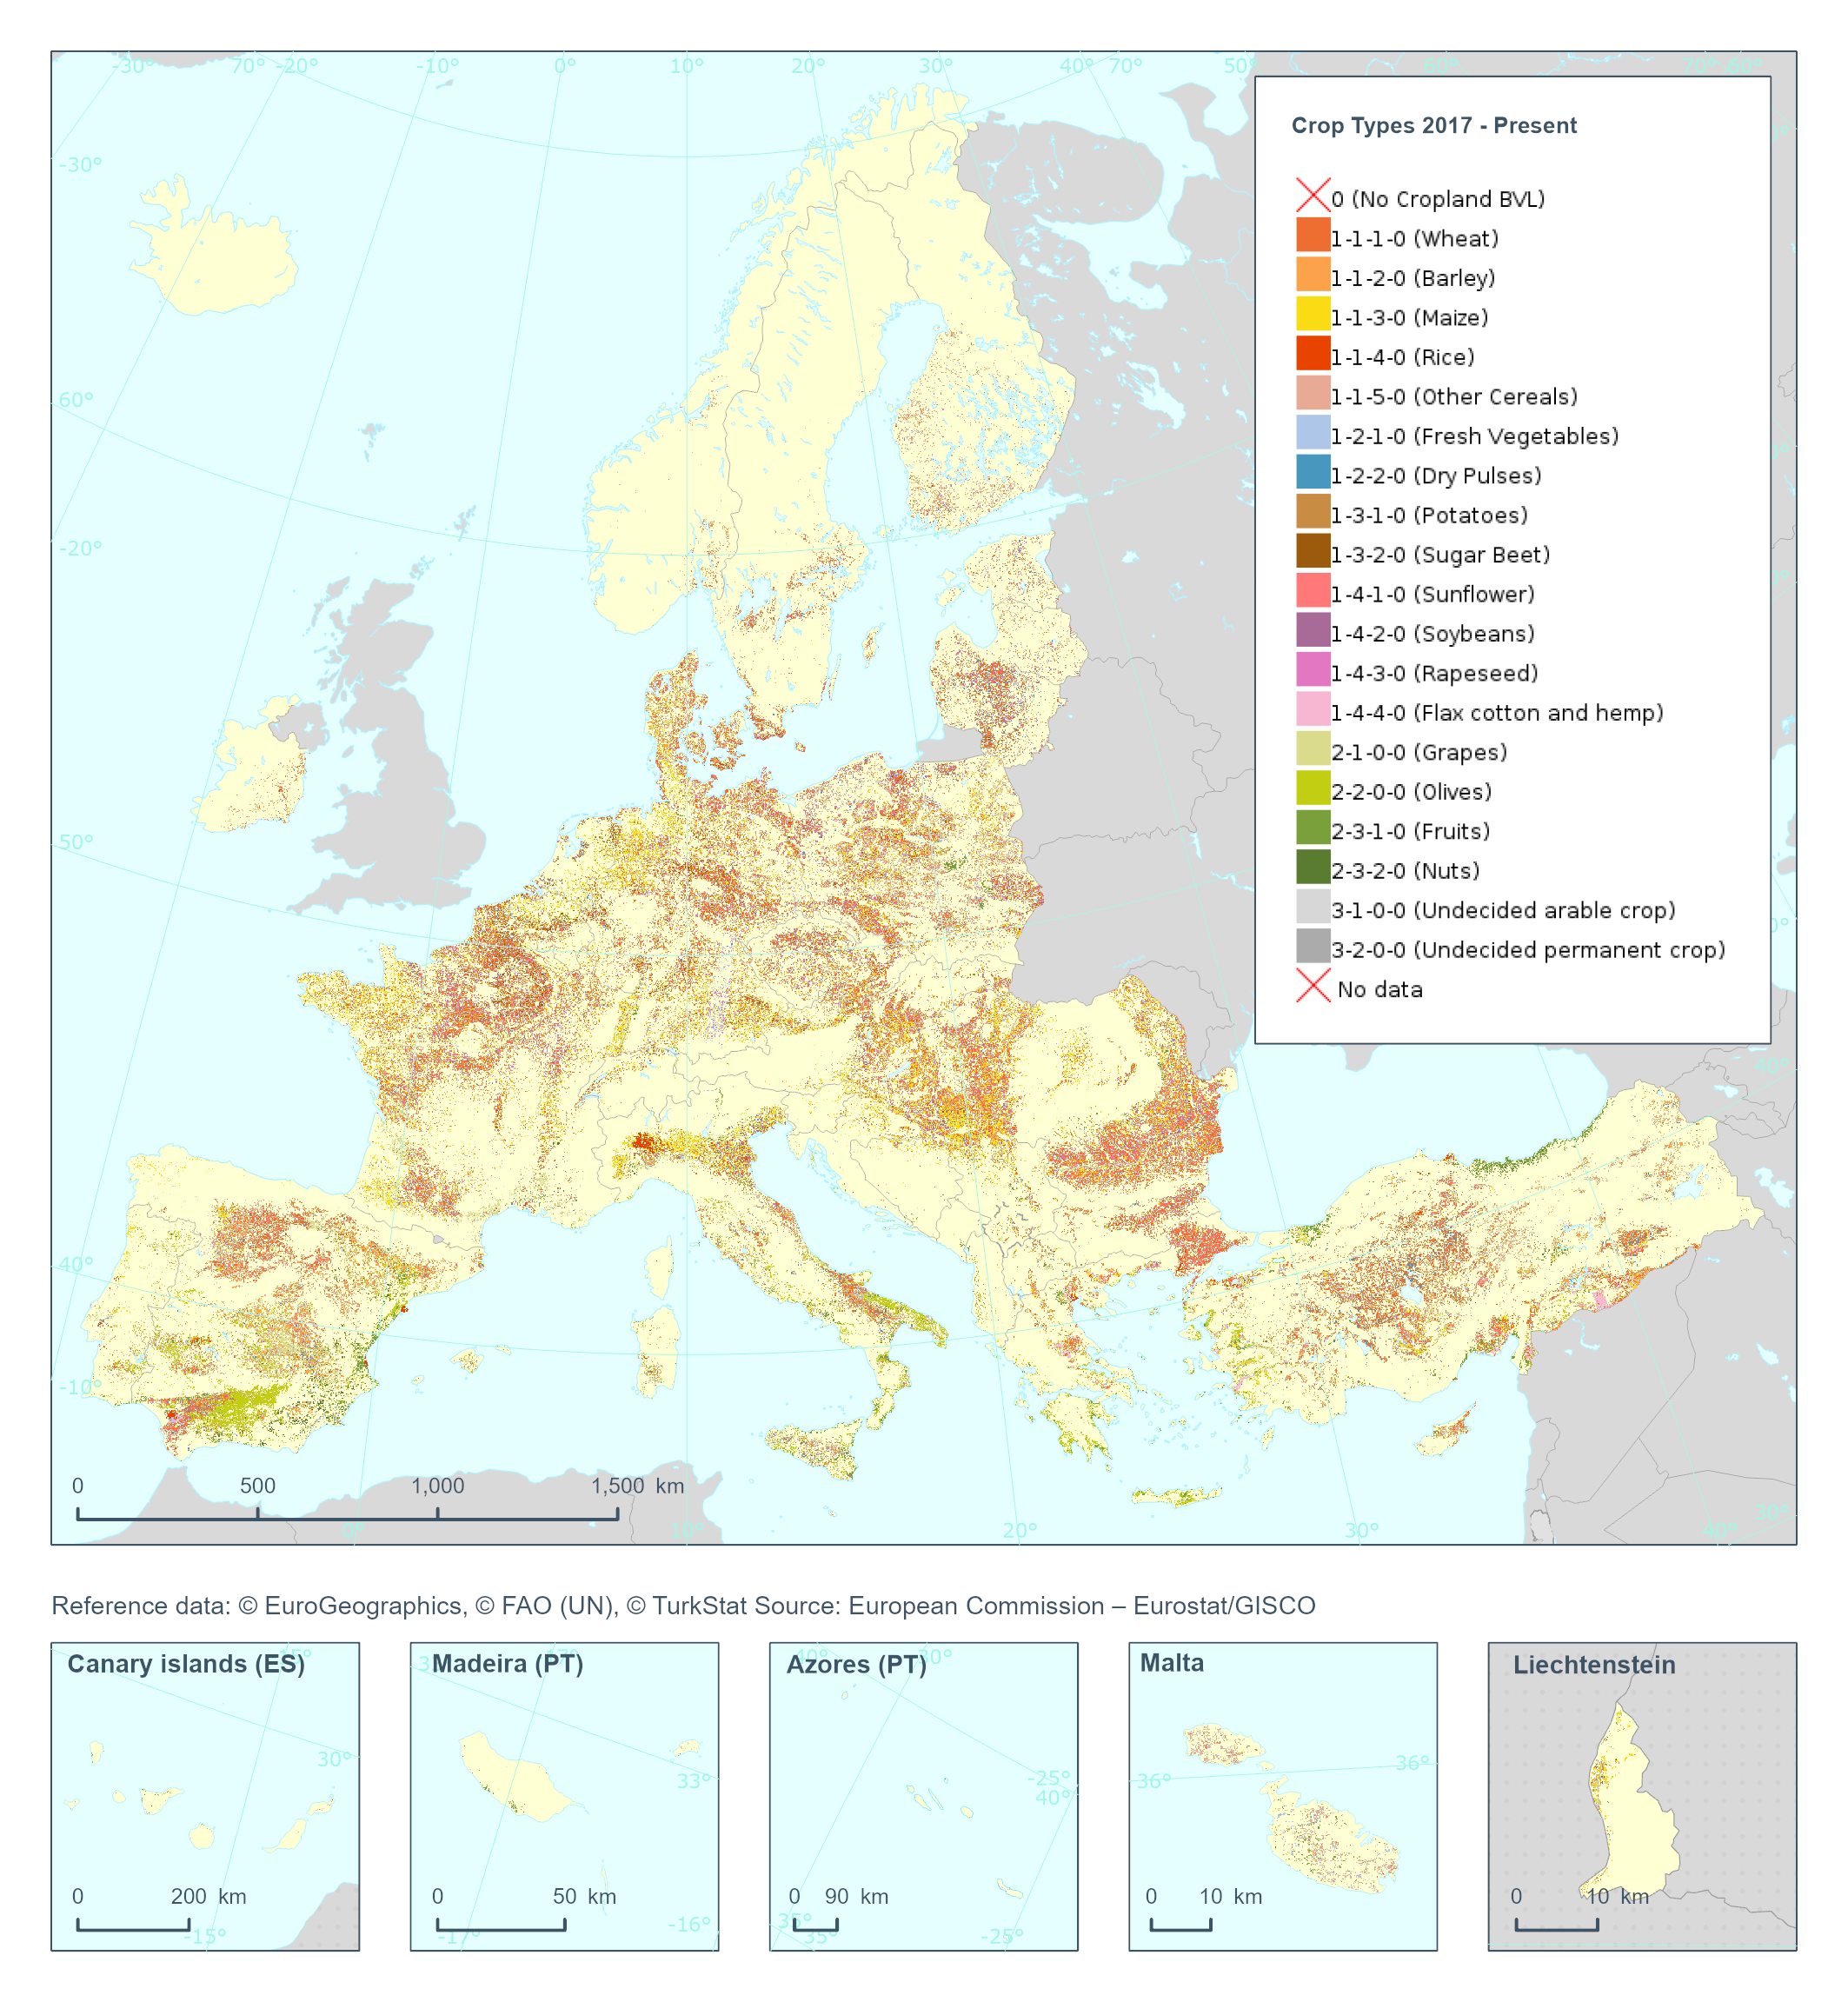
The High Resolution Layer Crop Types (CTY) raster product provides high resolution crop type classification for 17 classes of both arable and permanent crops accross the EEA38 extent. Using both Sentinel-1 and Sentiel-2, the model is finetuned to first map the crop field boundaries, and then determine the main crop for each field. This dataset is provided annually starting in 2017 with 10 meter rasters (fully conformant with the EEA reference grid) in 100 x 100 km tiles covering the EEA38 countries. High Resolution Layer Croplands product is part of the European Union’s Copernicus Land Monitoring Service. Confidence layer available for the dataset. This dataset includes data from the French Overseas Territories (DOMs)