 Arctic SDI catalogue
Geographical maps
Type of resources
Available actions
Topics
Keywords
Contact for the resource
Provided by
Formats
Representation types
Update frequencies
status
Scale
Resolution
-

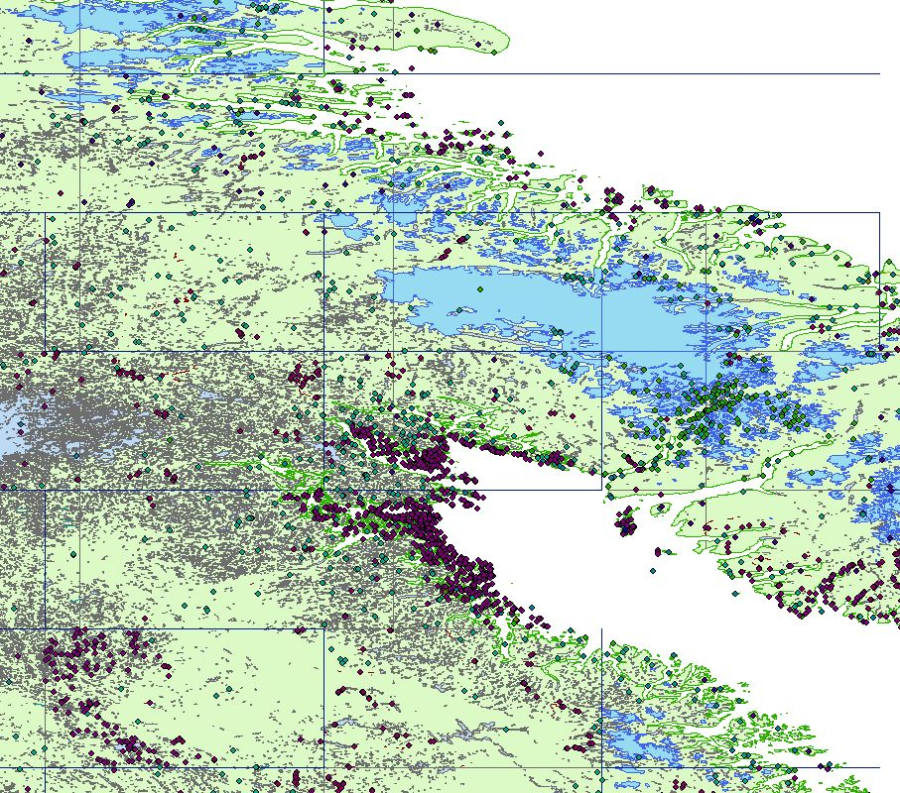
This collection is a legacy product that is no longer supported. It may not meet current Government standards. The National Topographic Data Base (NTDB) comprises digital vector data sets that cover the entire Canadian landmass. The NTDB includes features such as watercourses, urban areas, railways, roads, vegetation, and relief. The organizational unit for the NTDB is the National Topographic System (NTS), based on the North American Datum of 1983 (NAD83). Each file (data set) consists of one NTS unit at either the 1:50,000 or 1:250,000 scale. Related Products: [NTDB Correction Matrices, 2003-2009](https://ouvert.canada.ca/data/en/dataset/b6d0c19c-27e3-4392-b21f-49b1eec95653)
-

Map shows the geography of the northern circumpolar region, north of approximately 55 degrees latitude. This product is derived from the Atlas of Canada's bilingual wall map "The Circumpolar Region - North" (MCR 0001). To limit the impact of aliasing of the annotation we rendered the map into two tiled web services with a service showing the 'base' information and the other the 'annotation.' Combined the two services more or less replicate the wall map online. In addition to the tiled services, the mxd and geodatabase in FGDB format are available for download. Note: Since the geodatabase was derived from a cartographic product not all features have attribute information even though they are labelled on the map. The map uses the azimuthal equidistant projection. Displayed on the map are the international boundaries, as well as the Canadian provincial and territorial boundaries, all current to 2014. Also shown are national capital cities, other cities, towns, villages and hamlets along with some seasonally populated places. The map identifies a number of significant northern features, including the median sea ice extent from September 1981 to 2010, the tree line, undersea relief, land relief, glaciers, ice fields and coastal ice shelves. Labelled are many of the physiographic and hydrographic features.
-

This interactive map is a collaborative project by Natural Resources Canada and the federal, provincial and territorial members of the Geographical Names Board of Canada. The map illustrates a sample of close to 500 places in Canada named for women from a range of backgrounds who have been remembered for many different reasons. Each point on the map is categorized by a theme, and contains a short description of the person behind that place name. The descriptions reveal that information about these women and the places named for them varies widely; some are well-known and well-documented figures, while little is known about others.
-
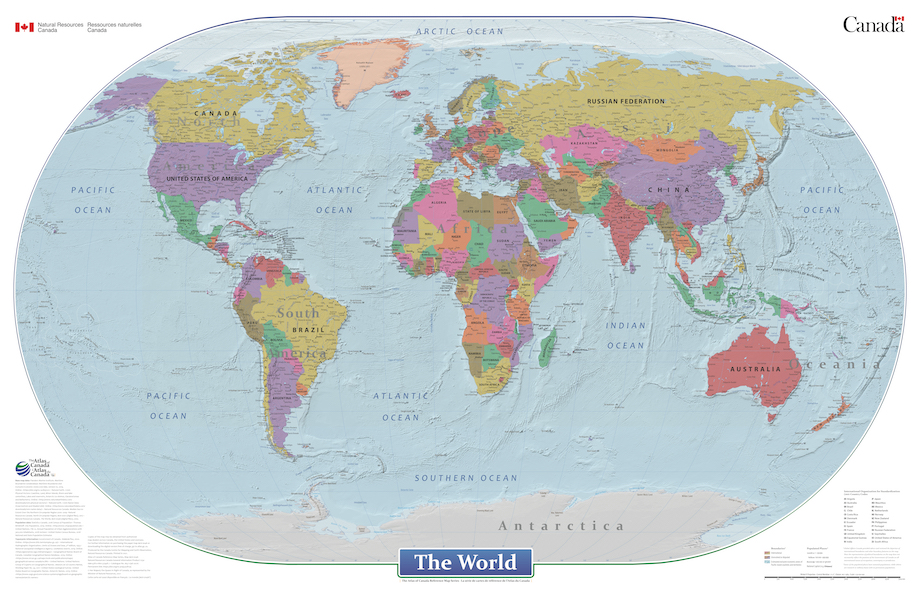
This cartographic digital product is derived from the Atlas of Canada's wall map "The World" (MCR 0046) and "Le monde" (MCR 0046F) published in 2021. The World is a general reference political map focused on the names and international boundaries of sovereign and non-sovereign countries. The information is portrayed using the Winkel II projection at a scale of 1:29 000 000. The dataset includes international boundaries, populated places, and labelled major hydrographic and physical features. In the geodatabase the representation of political boundaries do not necessarily reflect the position of the Government of Canada on all international issues of recognition, sovereignty or jurisdiction; some of the populated places have seasonal populations, while others are research or military bases with no permanent populations; and, there are no attribute information in the geodatabase for the labelled hydrographic and physical features.
-

Reference maps illustrate the location of census standard geographic areas for which census statistical data are tabulated and disseminated. The maps display the boundaries, names and unique identifiers of standard geographic areas, as well as physical features such as streets, railroads, coastlines, rivers and lakes. Reference maps include: Standard Geographical Classification (SGC) Census tracts Federal electoral districts
-

Salmon have a complex hierarchical population structure extending from groups of salmon at individual spawning sites all the way up to taxonomic species. These independently functioning aggregates are defined as Conservation Units (CUs) in the Wild Salmon Policy. A stock management unit (SMU) is a group of one or more CUs that are managed together with the objective of achieving a joint status. There are 69 SMUs containing 468 CUs. In 2022, eight SMUs units did not have enough information to provide an assessment. Sixty-one units were assigned a forecast. There are ongoing requests to represent salmon information for these areas. Salmon are assessed and managed at different levels for different needs. The layers in this dataset include administrative areas, stock management units, and conservation units. The data included is a shapefile containing a single feature class layer represented in point and polygon form, as well as a csv table (attributes) to present Stock Management Unit information in a simple, visual way.
-

Collection of Land Cover products for Canada as produced by Natural Resources Canada using Landsat satellite imagery. This collection of cartographic products offers classified Land Cover of Canada at a 30 metre scale, updated on a 5 year basis. - [Landcover of Canada 2010](https://open.canada.ca/data/en/dataset/c688b87f-e85f-4842-b0e1-a8f79ebf1133) - [Landcover of Canada 2015](https://open.canada.ca/data/en/dataset/4e615eae-b90c-420b-adee-2ca35896caf6) - [Landcover of Canada 2020](https://open.canada.ca/data/en/dataset/ee1580ab-a23d-4f86-a09b-79763677eb47)
-

Canada Center for Mapping and Earth Observation (CCMEO)'s basemap is essential in supporting the Government of Canada’s priorities in areas such as open government, climate change mitigation, Indigenous reconciliation, emergency management, disaster preparedness and response, sustainable natural resource management, infrastructure planning, economy/labour and more. It reinforces CCMEO’s commitment to improving the accessibility, interoperability and integration of geospatial data across Canada. CCMEO currently offers multiple basemap types which include the following found in this series: - Transportation basemap (CBMT) in raster tile format - Transportation basemap (CBMT) in vector tile format EPSG: 3857 (WGS84 Pseudo-Mercator) - Transportation basemap (CBMT) in vector tile format EPSG: 3978 (NAD83 Canada Atlas Lambert) - Digital Elevation Model (DEM) - hillshade basemap (CBME) - Simple grey basemap - Provinces/Territories basemap - Grids (Lat/Long, NTS and UTM) basemap
-
Land cover information is necessary for a large range of environmental applications related to climate impacts and adaption, emergency response, wildlife habitat, etc. In Canada, a 2008 user survey indicated that the most practical land cover data is provided in a nationwide 30 m spatial resolution format, with an update frequency of five years. In response to this need, the Canada Centre for Remote Sensing (CCRS) has generated a 30 m land cover map of Canada for the base year 2010, as the first of a planned series of maps to be updated every five years, or more frequently. This land cover dataset is also the Canadian contribution to the 30 m spatial resolution 2010 Land Cover Map of North America, which is produced by Mexican, American and Canadian government institutions under a collaboration called the North American Land Change Monitoring System (NALCMS). This land cover dataset for Canada is produced using observation from Thematic Mapper (TM) and Enhanced Thematic Mapper (ETM+) Landsat sensors. An accuracy assessment based on 2811 randomly distributed samples shows that land cover data produced with this new approach has achieved 76.60% accuracy with no marked spatial disparities. - [Land Cover of Canada - Cartographic Product Collection](https://open.canada.ca/data/en/dataset/11990a35-912e-4002-b197-d57dd88836d7)
-
The VMap1 collection is a legacy product that is no longer supported. It may not meet current government standards. VMap1 is a vector digital topographic reference product developed by Natural Resources Canada (NRCan) and The Department of National Defence (DND). VMap1 complies with international military specifications vector map, level 1. There are 24 VMap1 libraries covering the Canadian territory. The National Topographic Data Base (NTDB) at scale of 1:250 000 is the main source used to populate the Canadian VMap1 Libraries. Administrative Boundaries from Statistics Canada are used to add international borders, provincial and Indian reserve limits. NRCan paper maps at scale of 1:250 000 and the information in the Canadian Geographical Names Data Base (CGNDB) are used to capture the names. The JOG (Joint Operations Graphic) paper maps were used by DND for the production of libraries 37, 38 and 66. Topographic features mainly from the NTDB have not been updated. VMap1 is published once and no product revision is planned.