 Arctic SDI catalogue
lake
Type of resources
Available actions
Topics
Keywords
Contact for the resource
Provided by
Years
Formats
Representation types
Update frequencies
status
Service types
Scale
Resolution
-
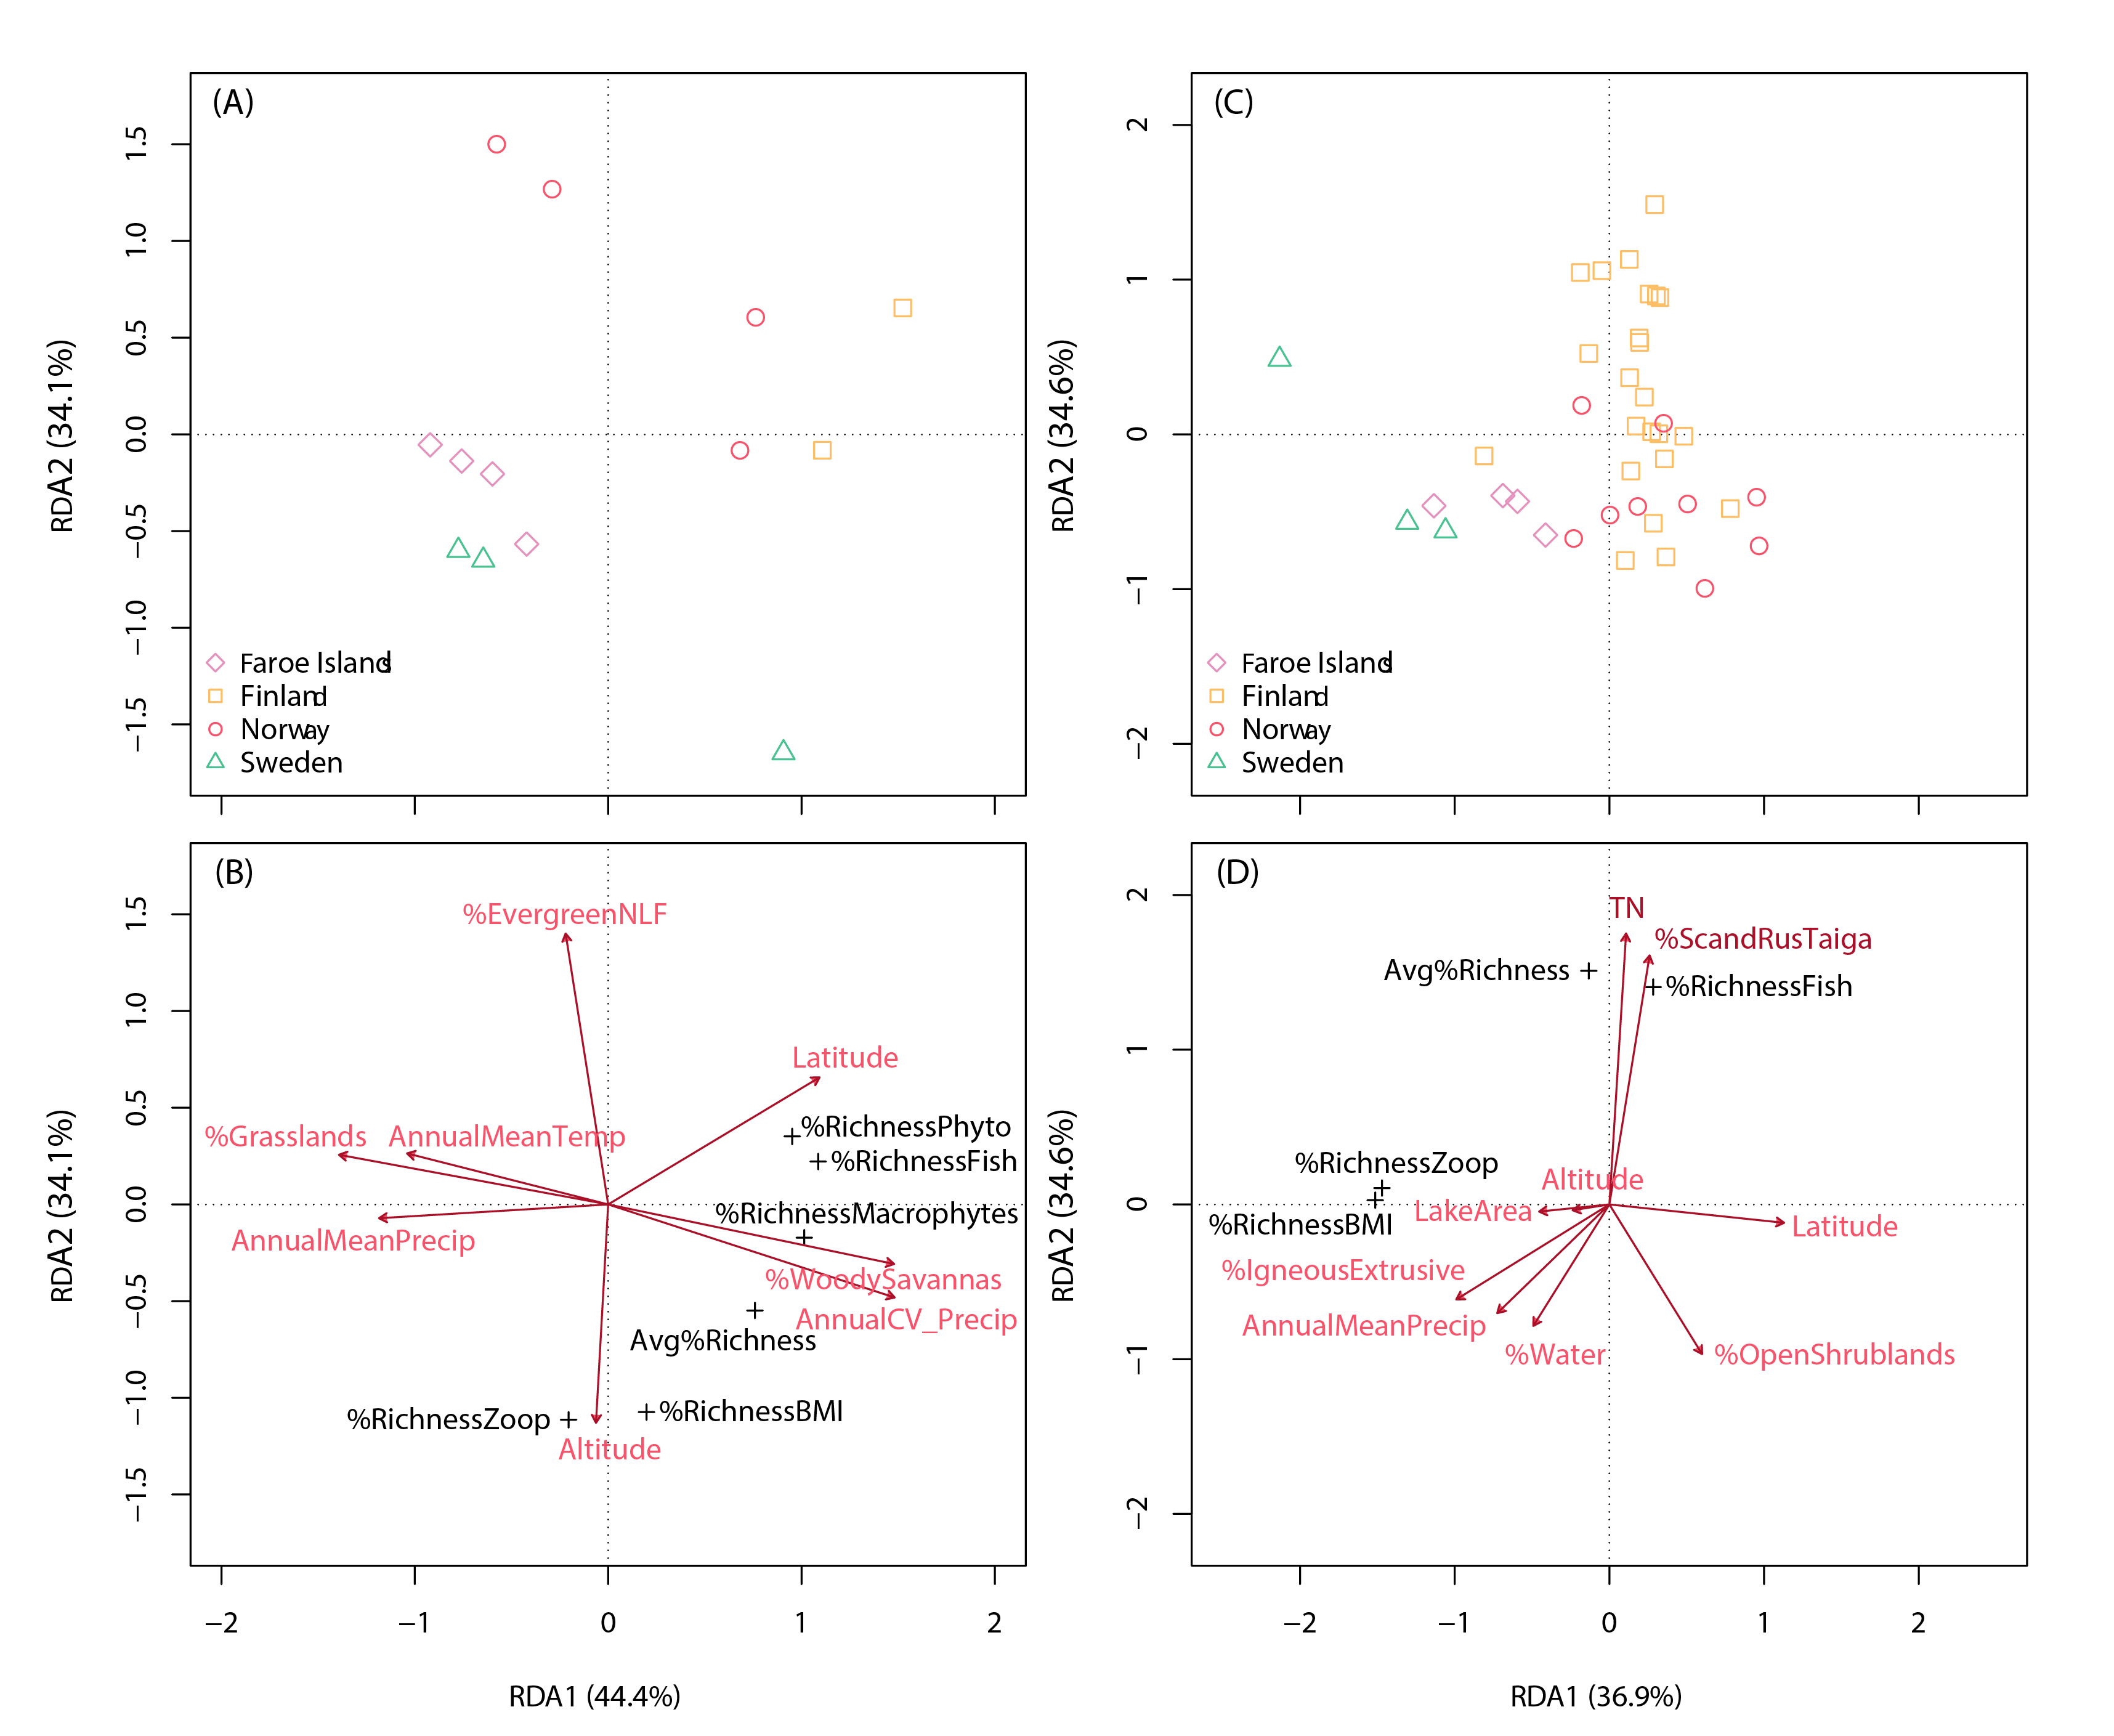
Redundancy analysis of percentage species taxa share (taxa richness relative to richness of all taxa) among 5 FECs (phytoplankton, macrophytes, zooplankton, benthic macroinvertebrates and fish) in 13 Fennoscandian lakes (panels A and B) and among 3 FECs in 39 Fennoscandian lakes (panels C and D).The upper panels show lake ordinations, while the bottom panels show explanatory environmental variables (red arrows), as indicated by permutation tests (p < 0.05). Avg%Richness: average species taxa richness as a percentage of richness of all FECs (i.e., including benthic algae if present); %Richness BMI: relative taxa share in benthic macroinvertebrates; %EvergreenNLF: percentage cover of evergreen needle-leaf forests. State of the Arctic Freshwater Biodiversity Report - Chapter 5 - Page 87 - Figure 5-4
-
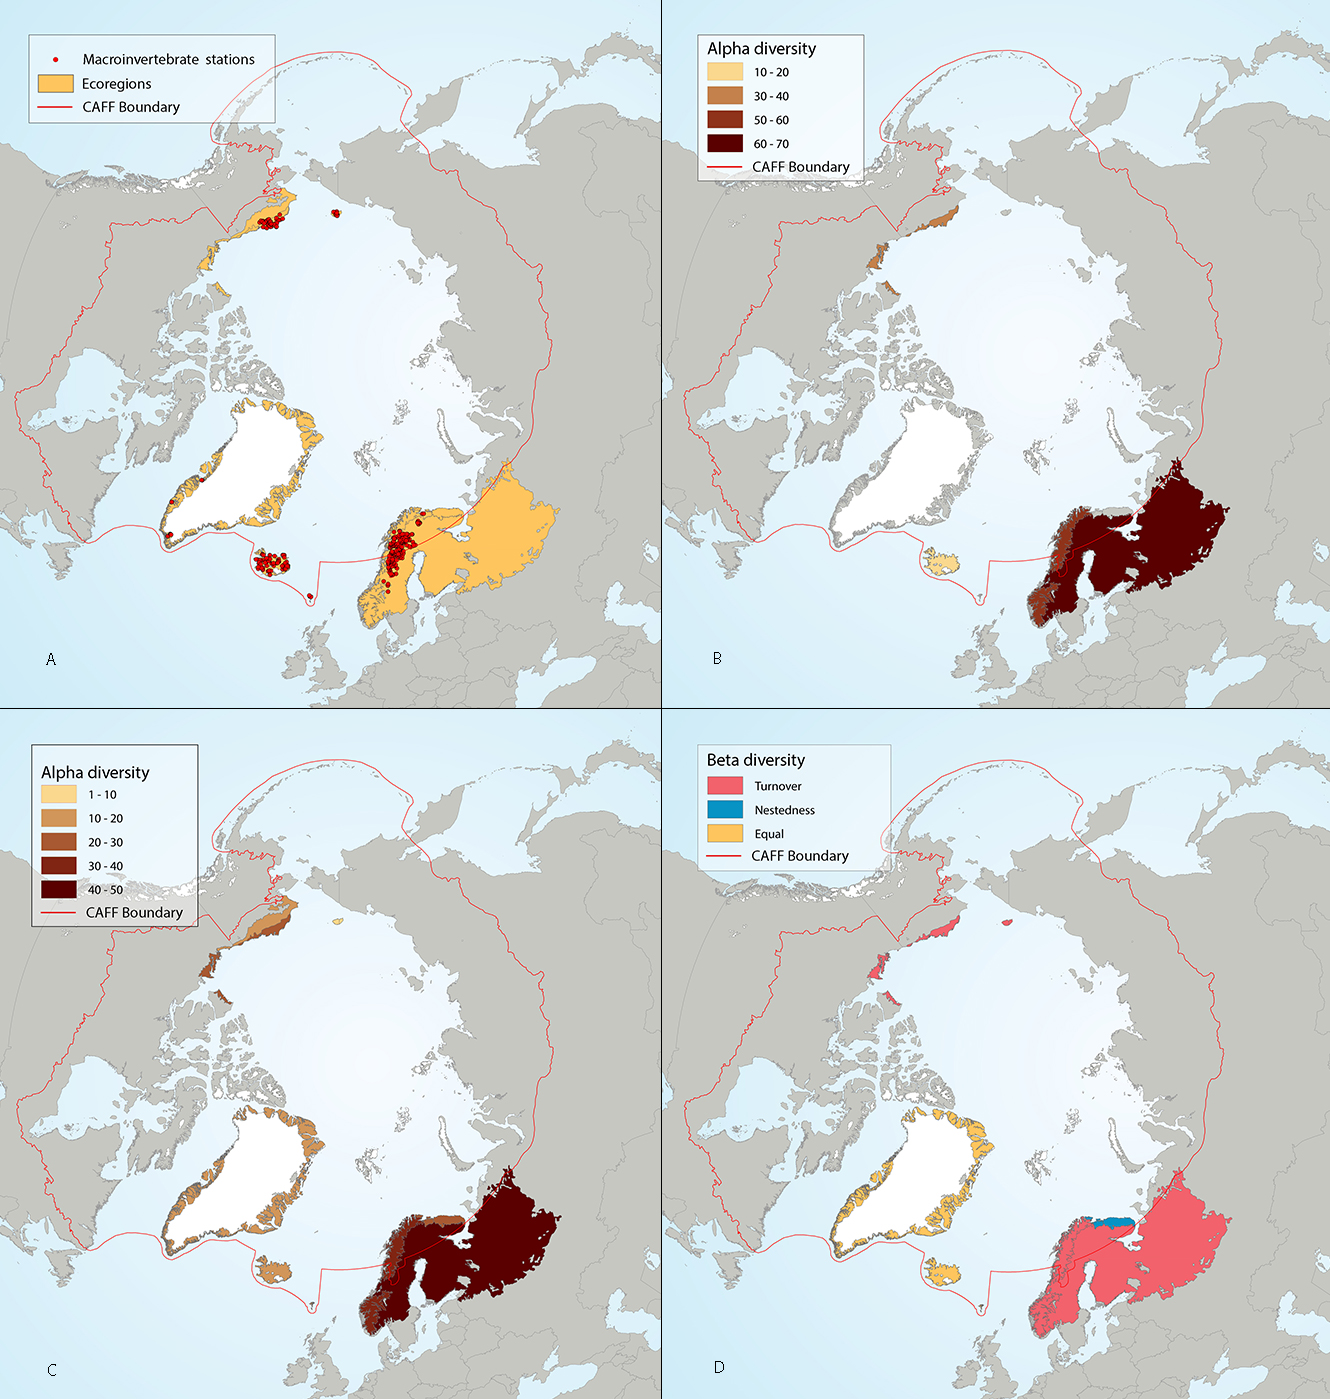
Results of circumpolar assessment of lake littoral benthic macroinvertebrates, indicating (a) the location of littoral benthic macroinvertebrate stations, underlain by circumpolar ecoregions; (b) ecoregions with many littoral benthic macroinvertebrate stations, colored on the basis of alpha diversity rarefied to 80 stations; (c) all ecoregions with littoral benthic macroinvertebrate stations, colored on the basis of alpha diversity rarefied to 10 stations; (d) ecoregions with at least two stations in a hydrobasin, colored on the basis of the dominant component of beta diversity (species turnover, nestedness, approximately equal contribution, or no diversity) when averaged across hydrobasins in each ecoregion. State of the Arctic Freshwater Biodiversity Report - Chapter 4 - Page 65 - Figure 4-29
-
Figure 4 12 Diatom groups from Self Organizing Maps (SOMs) in lake top sediments, showing the geographical distribution of each group (with colors representing different SOM groups). State of the Arctic Freshwater Biodiversity Report - Chapter 4 - Page 39 - Figure 4-12
-

Placer Lake Classification - 50k Distributed from [GeoYukon](https://yukon.ca/geoyukon) by the [Government of Yukon](https://yukon.ca/maps) . Discover more digital map data and interactive maps from Yukon's digital map data collection. For more information: [geomatics.help@yukon.ca](mailto:geomatics.help@yukon.ca)
-

Lake summer survey sites in the Cariboo Region
-
List of freshwater fish species recorded from survey data throughout Nova Scotia.
-
A shapefile of the Nova Scotia Automated Surface Water Quality Monitoring Network monitoring stations. The network was established in 2002 to assess near real-time water quality in surface waters across the province at five river stations and one lake station. The results are used to help manage water resources, determine baseline water quality in lakes and watercourses throughout the province, evaluate the impact of human activities on surface water, and assess long term trends in water quality. The following weblink connects to a Nova Scotia Department of Environment and Climate Change web map that includes the six monitoring station locations and an alternative method for downloading the same dataset: http://nse.maps.arcgis.com/apps/webappviewer/index.html?id=7ded7a30bef44f848e8a4fc8672c89bd
-
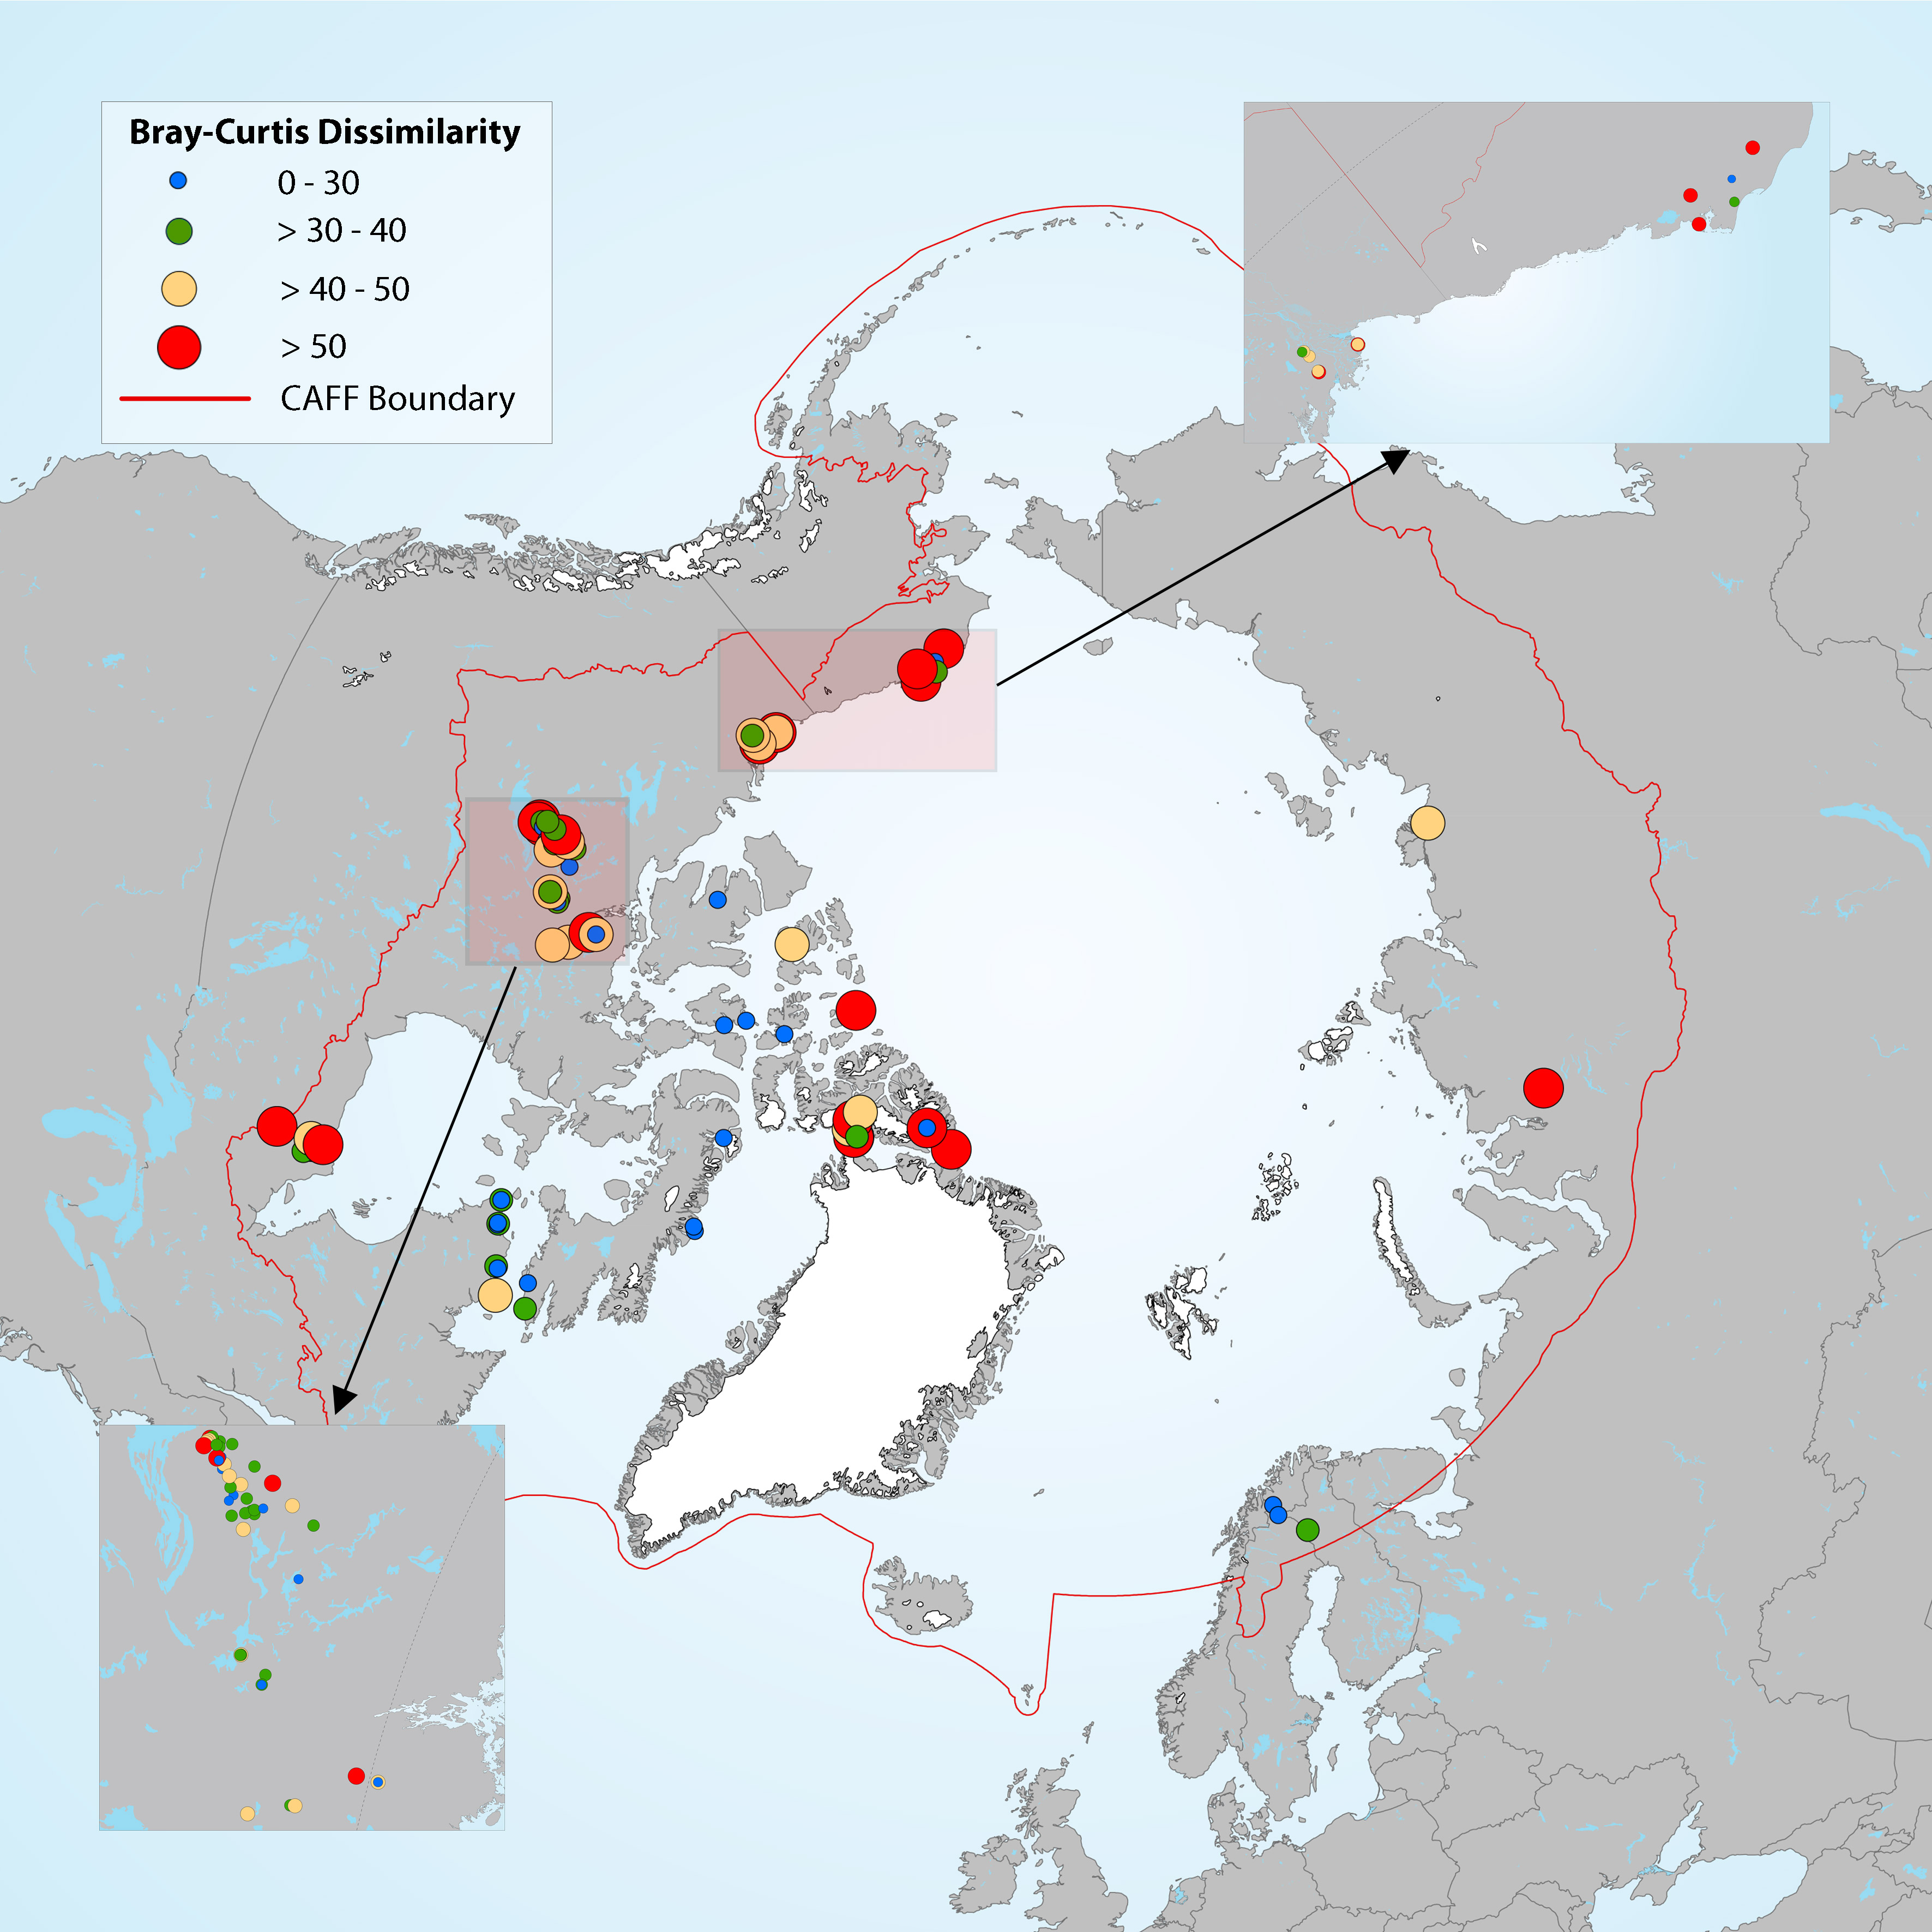
Estimation of diatom assemblage changes over a period of about 200 years (top versus bottom sediment cores). Figure 4-14 Map showing the magnitude of change in diatom assemblages between bottom (pre-industrial) and top (modern) section of the cores, estimated by Bray-Curtis (B-C) dissimilarity. Boundaries for the B-C dissimilarity categories are based on distribution quartiles (0-30%, 30-40%, 40- 50% and >50%), where the lowest values (blue dots) represent the lowest degree of change in diatom assemblage composition between top and bottom sediment core samples in each lake. State of the Arctic Freshwater Biodiversity Report - Chapter 4 - Page 41 - Figure 4-14
-
The Yukon Geological Survey (YGS) has compiled over 195 surficial geology maps into a standardized GIS format, providing approximately 80% coverage of the territory. The maps range in scales from 1:250,000 to 1:10,000 with spatial overlap between scales. The original maps were produced by various agencies, including the Geological Survey of Canada, YGS, Yukon Government, universities, and the City of Whitehorse. All original feature descriptions have been preserved and also converted to standardized values using the Yukon terrain classification system. The compilation includes 4 GIS datasets and supporting documents available for download via [YGS integrated data system](https://data.geology.gov.yk.ca/Compilation/33) (YGSIDS) or GeoYukon. A .lyr file is [provided](https://data.geology.gov.yk.ca/Compilation/33) to symbolize feature classes and differentiate overlapping maps at different scales. Additionally, there is a surficial geology map index. The polygon attributes captured include surficial material, texture, age, surface expression, and geomorphological processes. Line features include geological contacts, glacial limits, glacial landforms (cirques, arêtes, eskers, meltwater channels, moraines), and non-glacial landforms (faults, lineaments, landslides, escarpments). Point features include field station, fossil and sample locations, glacial landforms (erratics, kames, kettles, drumlins, flutings), permafrost features (pingos, palsas, patterned ground, thermokarst depressions), and other non-glacial landforms (landslides, tors). The map index provides information on each map publication such as author, map title, map scale, publisher. These data are valuable for land-use applications in the territory, including: mineral and placer exploration, geotechnical engineering, infrastructure planning, granular resource assessments, permafrost modeling, agricultural assessments, forest management, and biophysical or ecological land classification. Distributed from [GeoYukon](https://yukon.ca/geoyukon) by the [Government of Yukon](https://yukon.ca/maps) . Discover more digital map data and interactive maps from Yukon's digital map data collection. For more information: [geomatics.help@yukon.ca](mailto:geomatics.help@yukon.ca)
-
Features in the Hydrology - Polygon layer are representations of waterbodies for the City of Whitehorse. Data was modeled using the NENA NG9-1-1 GIS Data Template (NENA-REF-006. 2 -202 2 ). Distributed from [GeoYukon](https://yukon.ca/geoyukon) by the [Government of Yukon](https://yukon.ca/maps) . Discover more digital map data and interactive maps from Yukon's digital map data collection. For more information: [geomatics.help@yukon.ca](mailto:geomatics.help@yukon.ca)