 Arctic SDI catalogue
RI_534
Type of resources
Available actions
Topics
Keywords
Contact for the resource
Provided by
Formats
Representation types
Update frequencies
status
-

Each pixel value corresponds to the mean historical “Best-quality” Max-NDVI value for a given week, as calculated from the previous 20 years in the MODIS historical record (i.e. does not include data from the current year). These data are also often referred to as “weekly baselines” or “weekly normals”.
-

This set locates the establishments under the responsibility of the Food Inspection Division of the City of Montreal. It should be noted that the City is a mandatary of the Ministère de l'Agriculture, des Pêcheries et de l'Alimentation du Québec (MAPAQ) with respect to inspection on its territory.**This third party metadata element was translated using an automated translation tool (Amazon Translate).**
-
Data set on agreements concluded under the Regulation for a mixed metropolis to improve the supply of social, affordable and family housing (20-041). Since April 1, 2021, for all permits subject to it, the conclusion of an agreement in accordance with the Regulation is required. This regulation aims to improve the supply of social, affordable and family housing in the city.**This third party metadata element was translated using an automated translation tool (Amazon Translate).**
-
This point layer shows the locations of named places that fall within Parks Canada areas of interest. Data is not necessarily complete - updates will occur weekly.
-

Each pixel value corresponds to the quality control, cloud cover and snow fraction value for each pixel in the Best-Quality Max-NDVI product.
-

Traffic jams in the city of Trois-Rivières**This third party metadata element was translated using an automated translation tool (Amazon Translate).**
-
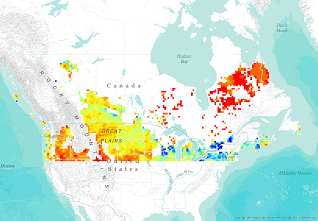
This data series represents the volumetric soil moisture (percent saturated soil) for the surface layer (<5 cm). The data is created daily and is averaged for the ISO standard week and month. The data is produced from passive microwave satellite data collected by the Soil Moisture and Ocean Salinity (SMOS) satellite and converted to soil moisture using version 6.20 of the SMOS soil moisture processor. The data are produced by the European Space Agency and obtained under a Category 1 proposal for Level 2 soil moisture data. The data are gridded to a resolution of 0.25 degrees. Data quality flags have been applied to remove areas where rainfall is present during the acquisition, where snow cover is detected and when Radio Frequency Interference (RFI) is above an acceptable threshold.
-

Mapping of watersheds in the territory of Quebec City.**This third party metadata element was translated using an automated translation tool (Amazon Translate).**
-
The purpose of this feature class is to show areas that are National Parks (NPs), National Park Reserves (NPRs) and National Marine Conservation Area (NMCAs). Parks Canada manages more than 43 NPs. (See: https://parks.canada.ca/voyage-travel/recherche-tous-parks-all) for a list of PCA administered parks. By using this data, it is important to understand and accept that the data is not to be used for defining boundaries. Administrative decisions should be based on legal documents and legal survey plans. Canada Lands Surveys: https://clss.nrcan-rncan.gc.ca/clss/plan/search-recherche
-
City of Trois-Rivières flow control valve**This third party metadata element was translated using an automated translation tool (Amazon Translate).**