 Arctic SDI catalogue
RI_542
Type of resources
Available actions
Topics
Keywords
Contact for the resource
Provided by
Formats
Representation types
Update frequencies
status
Scale
Resolution
-

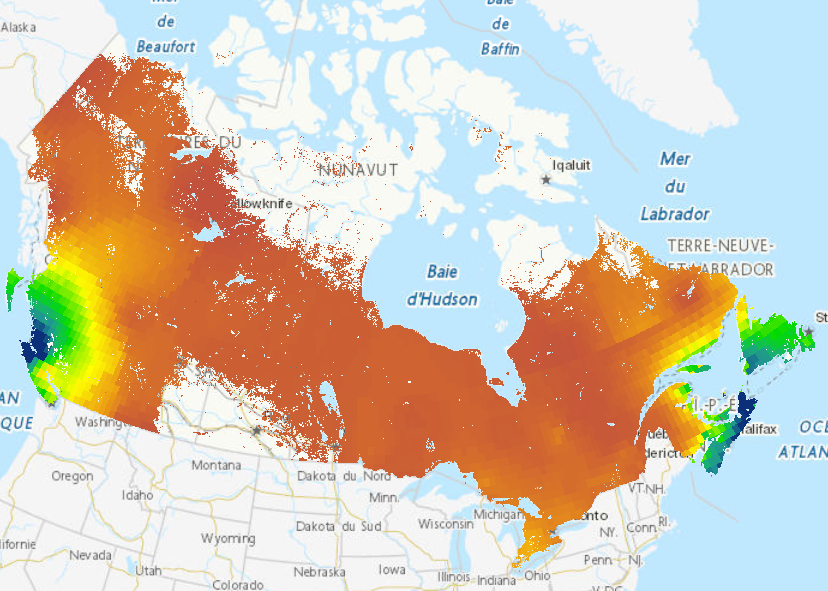
Description: This dataset consists of three simulations from the Northeastern Pacific Canadian Ocean Ecosystem Model (NEP36-CanOE) which is a configuration of the Nucleus for European Modelling of the Ocean (NEMO) V3.6. The historical simulation is an estimate of the 1986-2005 mean climate. The future simulations project the 2046-2065 mean climate for representative concentration pathways (RCP) 4.5 (moderate mitigation scenario) and 8.5 (no mitigation scenario). Each simulation is forced by a climatology of atmospheric forcing fields calculated over these 20 year periods and the winds are augmented with high frequency variability, which introduces a small amount of interannual variability. Model outputs are averaged over 3 successive years of simulation (the last 3, following an equilibration period); standard deviation among the 3 years is available upon request. For each simulation, the dataset includes the air-sea carbon dioxide flux, monthly 3D fields for potential temperature, salinity, potential density, total alkalinity, dissolved inorganic carbon, nitrate, oxygen, pH, total chlorophyll, aragonite saturation state, total primary production, and monthly maximum and minimum values for oxygen, pH, and potential temperature. The data includes 50 vertical levels at a 1/36 degree spatial resolution and a mask is provided that indicates regions where these data should be used cautiously or not at all. For a more detailed description please refer to Holdsworth et al. 2021. The data available here are the outputs of NEP36-CanOE_RCP 4.5; a projection of the 2046-2065 climate for the moderate mitigation scenario RCP 4.5. Methods: This study uses a multi-stage downscaling approach to dynamically downscale global climate projections at a 1/36° (1.5 − 2.25 km) resolution. We chose to use the second-generation Canadian Earth System model (CanESM2) because high-resolution downscaled projections of the atmosphere over the region of interest are available from the Canadian Regional Climate Model version 4 (CanRCM4). We used anomalies from CanESM2 with a resolution of about 1° at the open boundaries, and the regional atmospheric model, CanRCM4 (Scinocca et al., 2016) for the surface boundary conditions. CanRCM4 is an atmosphere only model with a 0.22° resolution and was used to downscale climate projections from CanESM2 over North America and its adjacent oceans. The model used is computationally expensive. This is due to the relatively high number of points in the domain (715 × 1,021 × 50) and the relatively complex biogeochemical model (19 tracers). Therefore, rather than carrying out interannual simulations for the historical and future periods, we implemented a new method that uses atmospheric climatologies with augmented winds to force the ocean. We show that augmenting the winds with hourly anomalies allows for a more realistic representation of the surface freshwater distribution than using the climatologies alone. Section 2.1 describes the ocean model that is used to estimate the historical climate and project the ocean state under future climate scenarios. The time periods are somewhat arbitrary; 1986–2005 was chosen because the Coupled Model Intercomparison Project Phase 5 (CMIP5) historical simulations end in 2005 as no community-accepted estimates of emissions were available beyond that date (Taylor et al., 2009); 2046–2065 was chosen to be far enough in the future that changes in 20 year mean fields are unambiguously due to changing GHG forcing (as opposed to model internal variability) (e.g., Christian, 2014), but near enough to be considered relevant for management purposes. While it is true that 30 years rather than 20 is the canonical value for averaging over natural variability, in practice the difference between a 20 and a 30 year mean is small (e.g., if we average successive periods of an unforced control run, the variance among 20 year means will be only slightly larger than for 30 year means). Also, there is concern that longer averaging periods are inappropriate in a non-stationary climate (Livezey et al., 2007; Arguez and Vose, 2011). We chose 20 year periods because they are adequate to give a mean annual cycle with little influence from natural variability, while minimizing aliasing of the secular trend into the means. As the midpoints of the two time periods are separated by 60 years, the contribution of natural variability to the differences between the historical and future simulations is negligible e.g., (Hawkins and Sutton, 2009; Frölicher et al., 2016). Section 2.2 describes how climatologies derived from observations were used for the initialization and open boundary conditions for the historical simulations and pseudo-climatologies were used for the future scenarios. The limited availability of observations means that the years used for these climatologies differs somewhat from the historical and future periods. Section 2.3 details the atmospheric forcing fields and the method that we developed to generate winds with realistic high-frequency variability while preserving the daily climatological means from the CanRCM4 data. Section 2.4 shows the equilibration of key modeled variables to the forcing conditions Data Sources: Model output Uncertainties: These climate projections are downscaled from a single global climate model (CanESM2/CanRCM4) because the cost of ensembles is presently prohibitive. Our experimental design uses climatological forcing for each time period so the differences between them are almost entirely due to anthropogenic forcing with little effect of natural variability.
-

Flight lines for the Pasqua, Crooked, Echo, and Round Lakes area within the Qu'Appelle Valley River system in Saskatchewan
-

The blue shark (Prionace glauca), is a species found in Atlantic Canadian waters which is commonly encountered in commercial and recreational fisheries. Pop-up Satellite Archival Tags (PSAT) and Smart Position and Temperature tag (SPOT) from Wildlife Computers were applied to blue sharks from 2004 to 2008 to collect data on depth (pressure), temperature and ambient light level (for position estimation). Deployments were conducted in Canada on commercial and recreational vessels from mid-August to early October, but mostly in September. A variety of tag models were deployed: PAT 4 (n=16), Mk10 (N=28), and SPOT3 (N=2) and 39 of 46 tags reported. The blue sharks tagged ranged in size from 124 cm to 251 cm Fork Length (curved); 30 were female, 15 were male and 1 was unknown sex. Time at liberty ranged from 4 – 210 days and 16 tags remained on for the programmed duration. Raw data transmitted from the PSAT’s after release was processed through Wildlife Computers software (GPE3) to get summary files, assuming a maximum swimming speed of 2m/s, NOAA OI SST V2 High Resolution data set for SST reference and ETOPO1-Bedrock dataset for bathymetry reference. The maximum likelihood position estimates are available in .csv and .kmz format and depth and temperature profiles are also in .csv format. Other tag outputs as well as metadata from the deployments can be obtained upon request from: warren.joyce@dfo-mpo.gc.ca or heather.bowlby@dfo-mpo.gc.ca.
-

This theme represents the limit of the Quebec territory of the Agreement on Sustainable Water Resources of the Great Lakes and St. Lawrence River Basin. It was generated from the grouping of watersheds at a cartographic scale of 1:20,000. For more information: http://www.environnement.gouv.qc.ca/eau/grandslacs/2005/index.htm **This third party metadata element was translated using an automated translation tool (Amazon Translate).**
-

Cartography of the vegetation cover of Quebec City. The canopy represents the projection on the ground of the tops (crown) of trees (including leaves, branches, and trunks), which is visible from the sky. The data comes from an automated classification of two satellite images covering Quebec City by the pair of World-View-3 and Pléiades satellites acquired in July 2020 (spatial resolution of 31 cm) and from the 2017 Lidar survey of Quebec City.**This third party metadata element was translated using an automated translation tool (Amazon Translate).**
-

The basking shark (Cetorhinus maximus), is a species found in Atlantic Canadian waters which is mostly encountered “basking” on the surface waters and sometimes caught accidentally in commercial fisheries. One Pop-up Satellite Archival Tag (PSAT Mk10) from Wildlife Computers was applied to a single female basking shark in September 2008 on a commercial vessel to collect data on depth (pressure), temperature and ambient light level (for position estimation). The basking shark was 610 cm Total Length (curved). The tag released on the pre-programmed date 125 days after deployment. Raw data transmitted from the PSAT’s after release was processed through Wildlife Computers software (GPE3) to get summary files, assuming a maximum swimming speed of 2m/s, NOAA OI SST V2 High Resolution data set for SST reference and ETOPO1-Bedrock dataset for bathymetry reference. The maximum likelihood position estimates are available in .csv and .kmz format and depth and temperature profiles are also in .csv format. Other tag outputs as well as metadata from the deployment can be obtained upon request from: warren.joyce@dfo-mpo.gc.ca or heather.bowlby@dfo-mpo.gc.ca.
-
This publication contains thirteen (13) maps of different biogeochemical and soil properties of forest ecosystems of Canada’s managed forest. A scientific article gives additional details on the methodology: Paré, D., Manka, F., Barrette, J., Augustin, F., Beguin, J. 2021. Indicators of site sensitivity to the removal of forest harvest residues at the sub-continental scale: mapping, comparisons, and challenges. Ecol. Indicators. https://dx.doi.org/10.1016/j.ecolind.2021.107516
-

The National Ecological Framework for Canada's "Land and Water Area by Province/Territory and Ecoregion” dataset provides land and water area values by province or territory for the Ecoregion framework polygon, in hectares. It includes codes and their English and French descriptions for a polygon’s province or territory, total area, land-only area and large water body area.
-
Series of Panchromatic orthophotos for 4 reservoir areas, Duncairn, LaFleche, Moosomin, Gouverneur taken in 2005. The photos were meant to coincide at a time when the reservoirs where at high flood supply levels (FSL).
-

This dataset includes metrics of seagrass productivity and resilience collected from field sites along the Atlantic coast of Nova Scotia, Canada. Field sites were located across a gradient of temperature and light conditions. Sampling was conducted monthly from May 2018 to July 2019. Seagrass density and plants were sampled at 10 haphazardly distributed sampling stations within each seagrass bed at approximately the same depth. Stations were ~10m apart and at least 2m from any seagrass-bare interface. Quadrats were used to determine vegetative and reproductive shoot density, and hand corers to collect seagrass above and belowground biomass. Three plants from each sampling station were also collected and processed in the laboratory for length and width leaf 3, number leaves per shoot, rhizome width, and rhizome water soluble carbohydrates. Also included in this data set are time-series records of bottom temperature at each site measured in 15-mins intervals using HOBO TidbiTv2 loggers. Cite this data as: Wong, Melisa C., and Michael Dowd. 2023. “The Role of Short-Term Temperature Variability and Light in Shaping the Phenology and Characteristics of Seagrass Beds.” Ecosphere 14(11): e4698. https://doi.org/10.1002/ecs2.4698