 Arctic SDI catalogue
MXD
Type of resources
Available actions
Topics
Keywords
Contact for the resource
Provided by
Formats
Representation types
Update frequencies
status
Resolution
-
The "Starter Kits" of the Canadian Geospatial Data Infrastructure (CGDI) are curated bundles of geospatial data delivered as a service. These kits are the result of a user needs assessment commissioned by Natural Resources Canada (NRCan), with a primary focus on addressing the specific requirements of Indigenous Peoples. Within these kits, you'll discover a selection of data provided as a service from a collection of over 71,000 datasets falling under the "Nature and Environment" category sourced from CGDI's Federal and Provincial/Territorial partners. These Starter Kits have been thoughtfully crafted into four thematic or geographic areas of Canada: a) British Columbia, b) Northwest Territories, c) Climate Change across Canada, d) And Water Resources across Canada. Each of these kits represents diverse areas and data categories, offering new users a compact, comprehensive, and user-friendly gateway to explore a wide array of information provided by the CGDI.
-

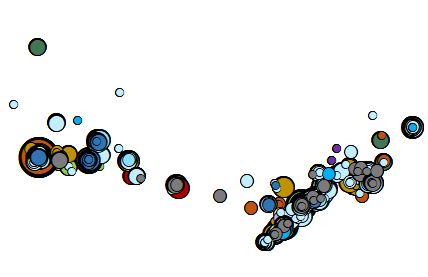
This interactive map is a collaborative project by the Geographical Names Board of Canada, illustrating a curated selection of places in Canada with names that have origins in multiple Indigenous languages. The names selected show the history and evolution of Indigenous place naming in Canada, from derived and inaccurate usage, to names provided by Indigenous organisations. Many Indigenous place names convey stories, knowledge, and descriptions of the land. By celebrating these names through this map, the Geographical Names Board of Canada hopes to increase the awareness of existing Indigenous place names and help promote the revitalization of Indigenous cultures and languages. Many more Indigenous place names exist in Canada and will be added in future releases of this map. The content of this map is a compilation of information obtained from many current and historical sources. The Geographical Names Board of Canada does not warrant or guarantee that the information is accurate, complete or current at all times. For more information, to report data errors, or to suggest improvements to this application, please contact the Geographical Names Board of Canada Secretariat.
-

This interactive map commemorates Canada’s participation in armed conflicts at home and abroad by highlighting a sample of the many geographical features and places named for those that served our country. These commemorative geographical names help us remember war casualties, soldiers, sailors, airmen and airwomen, military leaders, and civilians recognized or decorated for outstanding acts of bravery and sacrifice in battle. These names also commemorate notable battles in which Canada participated, and Canadian military units, regiments, squadrons, and ships in which Canadians served. Federal, provincial and territorial members of the Geographical Names Board of Canada provided these commemorative names for the development of the map. Many more commemorative place names exist in Canada, and will be added in future releases of this evergreen interactive map. If you would like to contribute names to this project, please contact the Geographical Names Board of Canada Secretariat at Natural Resources Canada.
-

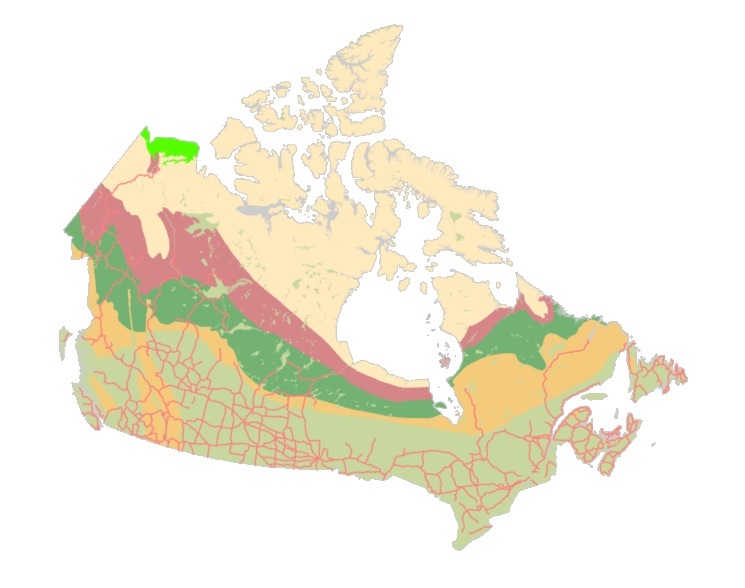
Drought is a deficiency in precipitation over an extended period, usually a season or more, resulting in a water shortage that has adverse impacts on vegetation, animals and/or people. The Climate Moisture Index (CMI) was calculated as the difference between annual precipitation and potential evapotranspiration (PET) – the potential loss of water vapour from a landscape covered by vegetation. Positive CMI values indicate wet or moist conditions and show that precipitation is sufficient to sustain a closed-canopy forest. Negative CMI values indicate dry conditions that, at best, can support discontinuous parkland-type forests. The CMI is well suited to evaluating moisture conditions in dry regions such as the Prairie Provinces and has been used for other ecological studies. Mean annual potential evapotranspiration (PET) was estimated for 30-year periods using the modified Penman-Monteith formulation of Hogg (1997), based on monthly 10-km gridded temperature data. Data shown on maps are 30-year averages. Historical values of CMI (1981-2010) were created by averaging annual CMI calculated from interpolated monthly temperature and precipitation data produced from climate station records. Future values of CMI were projected from downscaled monthly values of temperature and precipitation simulated using the Canadian Earth System Model version 2 (CanESM2) for two different Representative Concentration Pathways (RCP). RCPs are different greenhouse gas concentration trajectories adopted by the Intergovernmental Panel on Climate Change (IPCC) for its fifth Assessment Report. RCP 2.6 (referred to as rapid emissions reductions) assumes that greenhouse gas concentrations peak between 2010-2020, with emissions declining thereafter. In the RCP 8.5 scenario (referred to as continued emissions increases) greenhouse gas concentrations continue to rise throughout the 21st century. Multiple layers are provided. First, the mean annual Climate Moisture Index is shown across Canada for a reference period (1981-2010). Projected mean annual Climate Moisture Index is available for the short- (2011-2040), medium- (2041-2070), and long-term (2071-2100) under the RCP 8.5 (continued emissions increases) and, for the long-term (2071-2100), under RCP 2.6 (rapid emissions reductions). Reference: Hogg, E.H. 1997. Temporal scaling of moisture and the forest-grassland boundary in western Canada. Agricultural and Forest Meteorology 84,115–122.
-

The Indigenous Geographical Names dataset presents an extract from the Canadian Geographical Names Data Base (CGNDB) of geographical names with roots in Indigenous cultures. These geographical names reflect heritage, language, personal names, and cultural practices. Terrain and water features, populated places and culturally relevant places are geographical feature types present in the dataset. The Geographical Names Board of Canada (GNBC) is working to increase awareness of existing Indigenous place names and help promote the revitalization of Indigenous cultures and languages. Many more Indigenous place names exist in Canada, and this dataset will be constantly evolving as additional Indigenous place names are officially recognized and identified. The Geographical Names Board of Canada does not warrant or guarantee that the information is accurate, complete or current at all times. For more information, to report data errors, or to suggest improvements, please contact the GNBC Secretariat at Natural Resources Canada with questions or for more information. The CGNDB is the authoritative national database of Canada's geographical names. The purpose of the CGNDB is to store geographical names and their attributes that have been approved by the GNBC, the national coordinating body responsible for standards and policies on place names. This dataset is extracted from the CGNDB on a weekly basis, and consists of current officially approved names, feature type, coordinates of the feature, decision date, source, Indigenous language of origin where known, and other attributes.
-

Data provided shows grants and contributions provided to Canadian firms by National Research Council (NRC) and its Industrial Research Assistance Program (IRAP) between April 1, 2018 and March 31, 2019.
-

Data provided shows grants and contributions provided to Canadian firms by National Research Council (NRC) and its Industrial Research Assistance Program (IRAP) between April 1, 2019 and March 31, 2020.
-
Data provided shows grants and contributions provided to Canadian firms by National Research Council (NRC) and its Industrial Research Assistance Program (IRAP) between April 1, 2023 and March 31, 2024.
-
Data provided shows grants and contributions provided to Canadian firms by National Research Council (NRC) and its Industrial Research Assistance Program (IRAP) between April 1, 2021 and March 31, 2022.
-
Data provided shows grants and contributions provided to Canadian firms by National Research Council (NRC) and its Industrial Research Assistance Program (IRAP) between April 1, 2022 and March 31, 2023.