 Arctic SDI catalogue
Hydrology
Type of resources
Available actions
Topics
Keywords
Contact for the resource
Provided by
Years
Formats
Representation types
Update frequencies
status
Service types
Scale
-

The “Annual Unit Runoff (dam3/km2) for a 25% Probability of Exceedence” dataset is a line data set that covers the extent of Canada. It shows the 25% Probability of exceedence annual unit runoff.
-

The “Annual Unit Runoff (dam3/km2) for a 90% Probability of Exceedence” dataset is a line data set that covers the extent of Canada. It shows the 90% Probability of exceedence annual unit runoff.
-

The “Annual Unit Runoff (dam3/km2) for a 70% Probability of Exceedence” dataset is a line data set that covers the extent of Canada. It shows the 70% Probability of exceedence annual unit runoff.
-
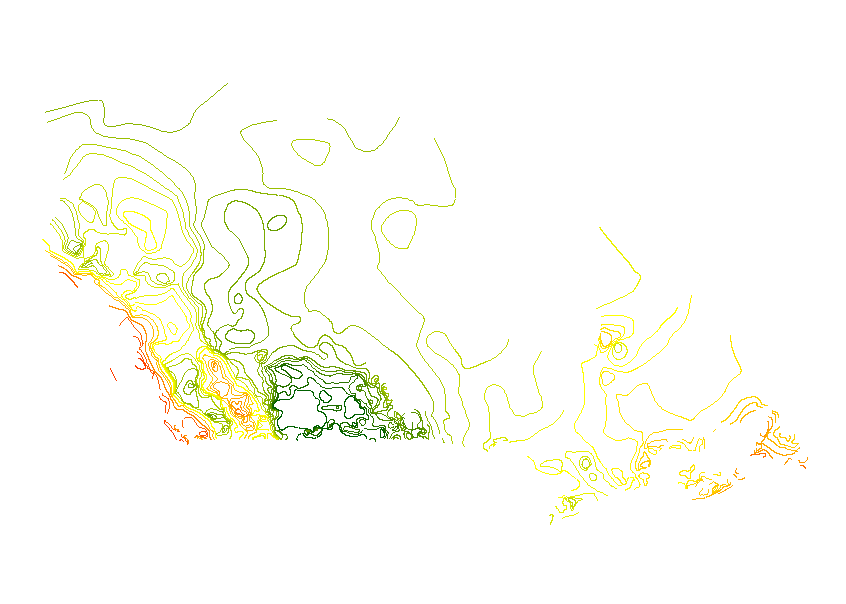
The “Annual Unit Runoff (dam3/km2) for a 50% Probability of Exceedence” dataset is a line data set that covers the extent of Canada. It shows the 50% Probability of exceedence annual unit runoff.
-

The “Annual Unit Runoff (dam3/km2) for a 80% Probability of Exceedence” dataset is a line data set that covers the extent of Canada. It shows the 80% Probability of exceedence annual unit runoff.
-

The “Annual Unit Runoff (dam3/km2) for a 75% Probability of Exceedence” dataset is a line data set that covers the extent of Canada. It shows the 75% Probability of exceedence annual unit runoff.
-

The “Stations used for Unit Runoff Analysis” dataset is a point data set for select hydrological stations that covers the extent of Canada.
-

The “Annual Unit Runoff (dam3/km2) for a 10% Probability of Exceedence” dataset is a line data set that covers the extent of Canada. It shows the 10% Probability of exceedence annual unit runoff.
-

Province-wide spatial view showing licensed water sources (streams and lakes), under the Water Act, (current and historical), not captured (displayed) on TRIM base mapping (or Freshwater Atlas base mapping).
-
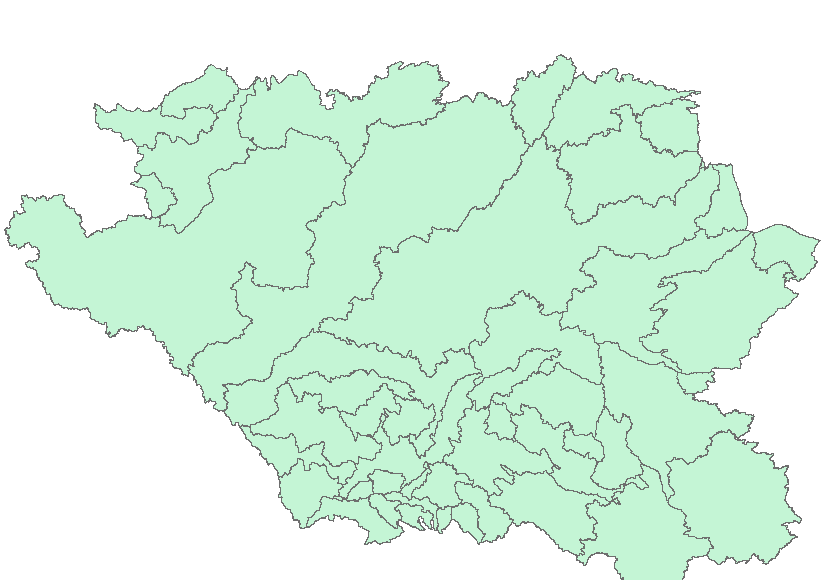
The “PFRA Sub-basins of the AAFC Watersheds Project – 2013” dataset is a geospatial data layer containing polygon features representing the 47 sub-basins within the Agriculture and Agri-Food Canada (AAFC) Watersheds Project, tailored for the Prairie Farm Rehabilitation Administration (PFRA) business needs.